This study affirms the value of the dominant pulse sequence paradigm put forth in Prostate Imaging Reporting and Data System (PI-RADS) version 2, especially in the peripheral zone (PZ), and clarifies that dynamic contrast material–enhanced MR imaging, whose role in PI-RADS version 2 is controversial, adds substantial benefit to PI-RADS category 3 or 4 lesions in the PZ.
Abstract
Purpose
To validate the dominant pulse sequence paradigm and limited role of dynamic contrast material–enhanced magnetic resonance (MR) imaging in the Prostate Imaging Reporting and Data System (PI-RADS) version 2 for prostate multiparametric MR imaging by using data from a multireader study.
Materials and Methods
This HIPAA-compliant retrospective interpretation of prospectively acquired data was approved by the local ethics committee. Patients were treatment-naïve with endorectal coil 3-T multiparametric MR imaging. A total of 163 patients were evaluated, 110 with prostatectomy after multiparametric MR imaging and 53 with negative multiparametric MR imaging and systematic biopsy findings. Nine radiologists participated in this study and interpreted images in 58 patients, on average (range, 56–60 patients). Lesions were detected with PI-RADS version 2 and were compared with whole-mount prostatectomy findings. Probability of cancer detection for overall, T2-weighted, and diffusion-weighted (DW) imaging PI-RADS scores was calculated in the peripheral zone (PZ) and transition zone (TZ) by using generalized estimating equations. To determine dominant pulse sequence and benefit of dynamic contrast-enhanced (DCE) imaging, odds ratios (ORs) were calculated as the ratio of odds of cancer of two consecutive scores by logistic regression.
Results
A total of 654 lesions (420 in the PZ) were detected. The probability of cancer detection for PI-RADS category 2, 3, 4, and 5 lesions was 15.7%, 33.1%, 70.5%, and 90.7%, respectively. DW imaging outperformed T2-weighted imaging in the PZ (OR, 3.49 vs 2.45; P = .008). T2-weighted imaging performed better but did not clearly outperform DW imaging in the TZ (OR, 4.79 vs 3.77; P = .494). Lesions classified as PI-RADS category 3 at DW MR imaging and as positive at DCE imaging in the PZ showed a higher probability of cancer detection than did DCE-negative PI-RADS category 3 lesions (67.8% vs 40.0%, P = .02). The addition of DCE imaging to DW imaging in the PZ was beneficial (OR, 2.0; P = .027), with an increase in the probability of cancer detection of 15.7%, 16.0%, and 9.2% for PI-RADS category 2, 3, and 4 lesions, respectively.
Conclusion
DW imaging outperforms T2-weighted imaging in the PZ; T2-weighted imaging did not show a significant difference when compared with DW imaging in the TZ by PI-RADS version 2 criteria. The addition of DCE imaging to DW imaging scores in the PZ yields meaningful improvements in probability of cancer detection.
© RSNA, 2017
An earlier incorrect version of this article appeared online. This article was corrected on July 27, 2017.
Introduction
The Prostate Imaging Reporting and Data System (PI-RADS), version 2, was introduced recently to “promote global standardization and diminish variation in the acquisition, interpretation, and reporting of prostate multiparametric MR examinations” (1). It was intended to be a living document based on experience and the accrual of scientific data, with a strong likelihood that there would be new versions in the future (1). Studies to test the efficacy of PI-RADS version 2 were encouraged to validate its utility.
One major change in PI-RADS version 2 was the introduction of the dominant pulse sequence concept, in which the pulse sequence varies according to location of the lesion. T2-weighted imaging was proposed to be the dominant pulse sequence for transition zone (TZ) lesions, whereas diffusion-weighted (DW) imaging was proposed to be the dominant pulse sequence for peripheral zone (PZ) lesions. Dynamic contrast material–enhanced (DCE) imaging was assigned a minor role, mainly to upgrade PI-RADS category 3 lesions based on DW imaging score in the PZ to PI-RADS category 4 if DCE findings were positive (ie, PI-RADS 3 + 1 lesion).
The dominant pulse sequence paradigm was first proposed by Vaché et al (2) and was based on studies indicating that DW imaging and DCE were of limited value in the TZ, as benign prostatic hyperplasia nodules can imitate the vascularity and diffusion parameters of cancers (3–5). For the PZ, DW imaging emerged as the dominant pulse sequence, with higher sensitivity for cancer. Moreover, lower apparent diffusion coefficient images were associated with higher Gleason grades (5–7). The limited role of DCE in determining PI-RADS scores reflected current opinion that DCE contributes little to the diagnosis of prostate cancer, as it is primarily useful when DW imaging is not definitive (8,9).
We sought to validate the dominant pulse sequence paradigm and limited role of DCE in PI-RADS version 2 for prostate multiparametric magnetic resonance (MR) imaging using data from a multireader study.
Materials and Methods
Study Population
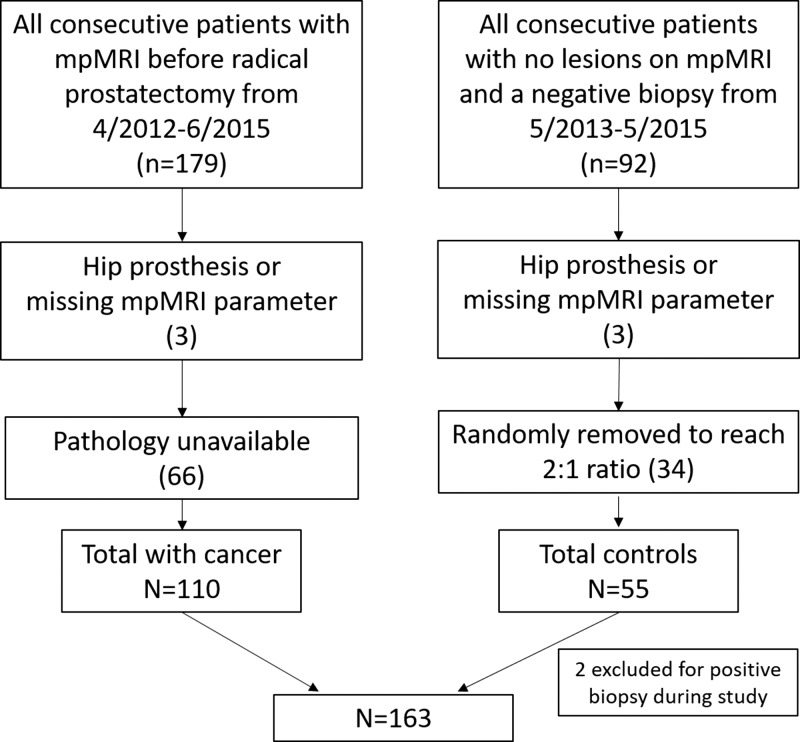
This Health Insurance Portability and Accountability Act–compliant retrospective evaluation of prospectively acquired data was approved by the local ethics committee. A flow diagram for patient inclusion is shown in Figure 1. All patients underwent multiparametric 3-T MR imaging with T2-weighted, DW (apparent diffusion coefficient; b value, 2000 sec/mm2), and DCE sequences with use of an endorectal coil. We included consecutive patients who underwent multiparametric MR imaging between April 2012 and June 2015 and subsequent radical prostatectomy (n = 179). In addition, a control group was established that consisted of consecutive patients who underwent imaging between May 2013 and May 2015 but who had no lesions detected at multiparametric MR imaging and no history of positive findings at systematic transrectal ultrasonographically (US)-guided biopsy (n = 92). These patients were referred for MR imaging primarily because of persistently elevated prostate-specific antigen levels, with negative findings at transrectal US-guided biopsy. Patients in both groups were excluded if they had a hip prosthesis or if there were missing pulse sequences at multiparametric MR imaging (n = 6). Patients with prostate cancer were also excluded if whole-mount specimens were not available. A total of 69 patients and 37 control subjects were excluded. Two additional control patients were excluded for a positive biopsy result subsequently obtained during the course of the study. The total study population comprised 163 patients (110 patients with prostate cancer, 53 control subjects). Characteristics of control subjects and patients with cancer and are reported in Table 1.
Figure 1:
Flow diagram shows inclusion and exclusion criteria. mpMRI = multiparametric MR imaging.
Table 1.
Baseline Characteristics of Patients with Cancer and Control Subjects
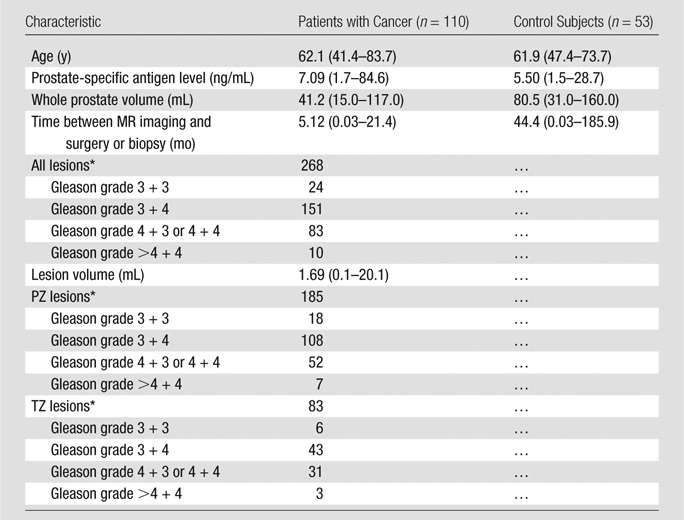
Note.—Unless otherwise indicated, data are averages, with the range reported in parentheses.
*Data are number of lesions.
Thirty-four of 163 patients were previously included in a multireader study (10). That study was an initial evaluation of the accuracy and agreement of PI-RADS version 2, whereas this one was performed to evaluate the role of DCE and the dominant pulse sequence paradigm of PI-RADS version 2. There were more than 1.5 years between these studies. Overlap was necessary to reach our targeted number of patients.
MR Imaging Protocol
Prostate multiparametric MR images were acquired with a 3-T imager (Achieva 3.0-T-TX; Philips Healthcare, Best, the Netherlands) using an endorectal coil (BPX-30; Medrad, Pittsburgh, Pa) filled with 45 mL of fluorinert (3M, Maplewood, Minn) and the anterior half of a 32-channel cardiac sensitivity-encoding coil (InVivo, Gainesville, Fla). Table 2 contains the pulse sequences and MR imaging acquisition parameters used in this study.
Table 2.
Multiparametric MR Imaging Sequence Parameters at 3 T

*For apparent diffusion coefficient map calculation, five evenly spaced b values (range, 0–750 sec/mm2) were used.
† The b value was 2000 sec/mm2.
Study Design
Nine radiologists served as readers (T.B., L.K.B., S.B., I.M.K., Y.M.L., J.M., H.S., R.M.S., B.T.): three were highly experienced in prostate multiparametric MR imaging (>2000 studies read in the past 2 years); three, moderately experienced (>500 studies read in the past 2 years), and three, novices (<500 studies read in the past 2 years). Readers represented six countries and eight institutions. All had experience with PI-RADS version 2 prior to this study.
Randomization was stratified by a patient’s disease status (patient with cancer vs control subjects) so that patient allocation maintained a 2:1 ratio for each reader. Specifically, 19 patients with cancer and nine control subjects were randomly selected and were evaluated by all nine readers, and the remaining 135 patients (91 patients with cancer, 44 control subjects) were randomly allocated to a total of 36 pairs of readers, with each reader pair evaluating two or three patients with cancer and one or two control subjects. Each reader evaluated, on average, 58 patients (range, 56–60 patients).
MR Image Interpretation
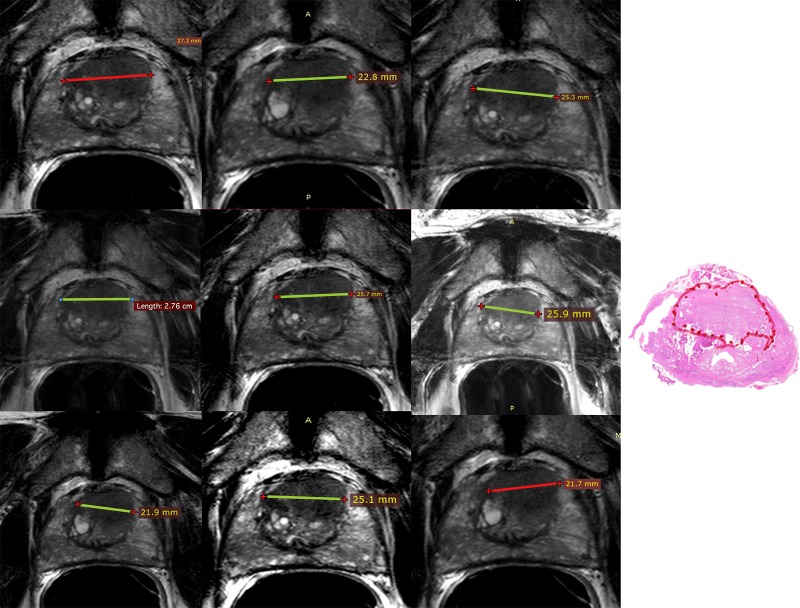
Readers were blinded to all clinical and pathologic findings. All patient information was removed from images. A Digital Imaging and Communications in Medicine viewer (11) (RadiAnt, Poznan, Poland) was used to view images. Readers detected up to three lesions on multiparametric MR images that would be included as part of a clinical report and scored each lesion by using PI-RADS version 2 software. No lesions were preselected. Per PI-RADS version 2 recommendations, for each lesion readers recorded zone (TZ or PZ) and scores for T2-weighted (range, 1–5), DW (range, 1–5), and DCE (positive or negative) sequences. Readers marked lesions and saved a screen shot with the lesion marked, with no effort to ensure readers interpreted the same lesions (Fig 2). All data were recorded in Microsoft Access (Microsoft, Redmond, Wash).
Figure 2:
Left: Screenshots for nine readers. Images were obtained in a 66-year-old man with a prostate-specific antigen level of 8.3 ng/mL who underwent endorectal coil 3-T multiparametric MR imaging with T2-weighted (apparent diffusion coefficient, b value = 2000 sec/mm2) and DCE MR imaging followed by prostatectomy. Nine readers were asked to detect all lesions that would be included in a clinical report and score them with PI-RADS version 2. Shown are the T2-weighted screen shots of all nine readers who marked the largest lesion diameter of an anterior midtransition zone lesion that received a Gleason score of 3 + 4 at prostatectomy. Right: Histopathologic image.
Radiologic and Pathologic Comparison
All patients with prostate cancer had whole-mount radical prostatectomy specimens produced with patient-specific MR imaging–based three-dimensionally printed molds to correlate MR imaging and pathology findings (6). Lesion locations and Gleason grades on whole-mount specimens were annotated by a genitourinary pathologist (M.J.M.) who had no knowledge of MR imaging results. Lesion volumes were measured digitally based on the pathologist’s marked lesion boundaries. Lesion comparison between readers was based on screen-shots from each reader, allowing up to two slices (3-mm slices) between readers for a lesion with the same anatomic and morphologic features. If readers did not agree on the location of a lesion in a patient, those two lesions were treated as distinct lesions. Comparison with pathology findings was based on prostate landmarks and lesion morphology. Comparison between reader screen shots and prostatectomy specimens was made by a research fellow (M.D.G.) and cross-checked by a prostate multiparametric MR imaging–dedicated radiologist (B.T.). Clinically important disease was defined as a Gleason grade of 3 + 4 or higher. For control subjects, 12-core systematic biopsy was used to validate MR imaging results.
Statistical Analyses
Data for this study were collected as part of a study comparing computer aided-diagnosis prostate multiparametric MR imaging to prostate multiparametric MR imaging alone (publication pending). The data used in this analysis were from the prostate multiparametric MR imaging–alone arm of that study. The sample size was determined to reach the primary end point of that comparison.
The overall PI-RADS scores were determined by using the scores given to a lesion by a reader at T2-weighted, DW, or DCE imaging, per PI-RADS version 2 (1). The probability of cancer detection was defined as the proportion of true-positive lesions among all detected lesions. To determine the efficacy of individual PI-RADS scores, the probability of cancer detection was calculated as the weighted average of reader probability of cancer detection, with weight proportional to the number of lesions detected by each reader. For example, if one unique lesion in one patient was detected by nine readers, then nine total lesions would be considered equally. The purpose of taking a weighted average was to reduce the variability of probability of cancer detection for PI-RADS scores in which the number of lesions detected by an individual reader is small and to provide an assessment of PI-RADS version 2 performance across a broad spectrum of reader experience. As scores of the same lesion and of multiple lesions in the same patient detected by multiple readers may be correlated, generalized estimating equations with a logit link function under an independence working model assumption were used to obtain the robust sandwich variance estimates of the regression coefficients in the generalized estimating equations models. The delta method was used to obtain standard errors of probability of cancer detection, and the Wald test was used for inference.
The probability of cancer detection was calculated for overall PI-RADS scores and for pulse sequence–specific (T2-weighted, DW imaging) PI-RADS scores in all zones combined and in the TZ and PZ individually. The probability of cancer detection for PI-RADS 3 + 1 lesions in the PZ or PI-RADS category 4 lesions in the PZ by virtue of a DW imaging score of 3 and positive DCE findings was compared with the probability of cancer detection of overall PI-RADS category 4 and PI-RADS category 3 by DW imaging = 4 or 3 in the PZ. In these analyses, reader PI-RADS score was the factor predictor for all zones, and PI-RADS score, PZ, and their interaction terms were the factor predictors for zonal analysis. To partially account for multiple testing, a more conservative significance level of .01 was applied to the comparisons made in these analyses.
To assess the performance of T2-weighted and DW imaging in each zone, lesion-based logistic regression models were developed based on pulse sequence scores (T2-weighted and DW imaging) and location (PZ or TZ) of a lesion. In these analysis, zonal analysis was performed separately with PI-RADS score and a dummy variable (DW vs T2-weighted imaging) as the factor predictors. Similarly, to assess the value of DCE positivity, the probability of cancer detection for each PI-RADS score at T2-weighted and DW imaging with or without DCE positivity was estimated by using a zonal-specific logistic regression model using separate T2-weighted and DW imaging scores with and without DCE as a coparameter. T2-weighted and DW imaging scores were treated as continuous linear predictors in the logistic models. For all models, variance estimates of the regression coefficients, odds ratios (ORs), and Wald test were based on generalized estimating equations under an independence working model assumption. OR was calculated as the ratio of odds of cancer of two consecutive scores. The fit of each predicted model was assessed with graphic display of observed versus model-based (predicted) probability of cancer detection and by testing for goodness of fit for the generalized estimating equations model with binary responses (12). All P values correspond to two-sided tests, with P < .05 considered to represent a significant difference.
Results
Radiologic Lesion Characteristics
In 163 patients, a total of 654 lesions were scored as PI-RADS category 1 or higher by all readers, for a total of 336 unique lesions (most lesions were detected by more than one reader). A total of 420 of 654 lesions were in the PZ. For overall PI-RADS scores of 1, 2, 3, 4, or 5, there were three, 70, 115, 305, and 161 lesions, respectively. In the PZ, there were two, 41, 131, 171, and 75 lesions with a PI-RADS score of 1, 2, 3, 4, or 5, respectively. In the TZ, there were one, 28, 81, 56, and 68 lesions with a PI-RADS score of 1, 2, 3, 4, or 5, respectively. Lesions with a PI-RADS score of 1 were excluded from further analysis on the basis of small sample size (n = 3).
Performance of PI-RADS Version 2 Scores
The probability of cancer detection with standard error of the overall PI-RADS scores is shown in Table 3. The probability of cancer detection for PI-RADS category 2 was 24.3% (17 of 70) for all lesions and 15.7% (11 of 70) for clinically important disease. The probability of cancer detection for PI-RADS category 3 was 40.0% (46 of 115) for all lesions and 33.0% (38 of 115) for clinically important disease. The probability of cancer detection for PI-RADS category 4 was 78.7% (240 of 305) for all lesions and 70.5% (215 of 305) for clinically important disease. The probability of cancer detection for PI-RADS category 5 was 91.3% (147 of 161) for all lesions and 90.7% (146 of 161) for clinically important disease. Except between PI-RADS category 2 and category 3, for all lesions, the increase in probability of cancer detection between each increment in PI-RADS score was significant (P < .01).
Table 3.
Probability of Cancer Detection for Overall PI-RADS Scores for All Lesions and Clinically Important Lesions

Note.—Data in parentheses are standard errors.
*P value between consecutive PI-RADS scores.
Among the 70 PI-RADS category 2 lesions, 43 of 70 (61.0%) were in the PZ, and 16 of 17 (94.1%) of the true-positive findings were in the PZ. Less experienced readers detected 42 of 70 (60.0%) of these lesions; however, highly experienced readers detected 10 of 17 (58.8%) of the true-positive lesions. These lesions were primarily detected as category 2 at DW imaging and T2-weighted imaging (41 of 70). The negative predictive value of PI-RADS category 2 lesions was 75.7% (53 of 70); if either DW imaging > 2 up-scored these lesions, the negative predictive value decreased to 73.8% (31 of 42). These lesions were primarily small lesions, with a median volume of 0.21 mL (range, 0.12–3.99 mL) and a low grade (14 of 17 lesions had a Gleason score of less than 4 + 3).
Probability of Cancer Detection in the PZ and TZ
The probability of cancer detection with standard error of the overall PI-RADS score in each zone is shown in Table 4. For all lesions with a PI-RADS score of 2, the probability of cancer detection in the PZ was 38.1% (16 of 42) versus 3.6% (one of 28) in the TZ (P = .001). For PI-RADS category 3 lesions, the probability of cancer detection was 51.1% (23 of 45) in the PZ versus 32.9% (23 of 70) in the TZ (P = .078). For PI-RADS category 4 lesions, the probability of cancer detection was 81.9% (199 of 243) in the PZ versus 66.1% (41 of 52) in the TZ (P = .039). For PI-RADS category 5 lesions, the probability of cancer detection was 94.3% (83 of 88) in the PZ versus 87.7% (64 of 73) in the TZ (P = .273). Only the difference for PI-RADS category 2 lesions was borderline significant for clinically important disease (23.8% in the PZ vs 3.6% in the TZ, P = .021).
Table 4.
Probability of Cancer Detection for All Lesions and Clinically Important Lesions for Overall PI-RADS Scores between the PZ and TZ

Note.—Data in parentheses are standard errors.
*P value between PZ and TZ.
Role of PI-RADS 3 + 1 Lesions
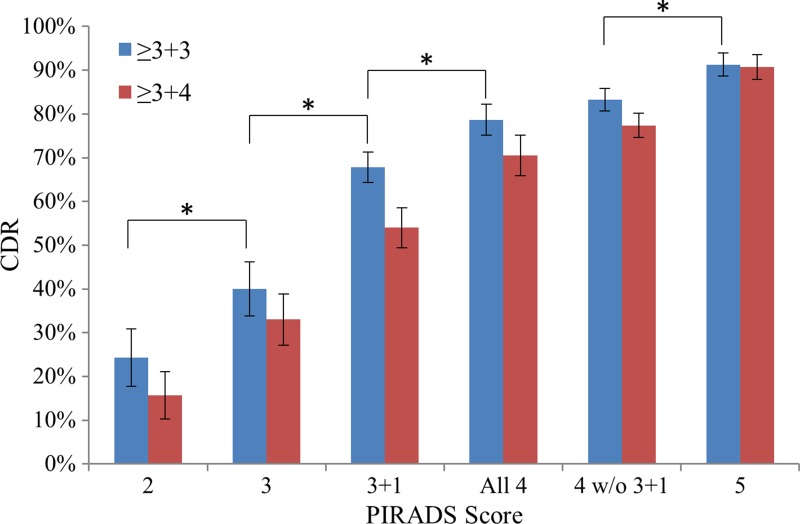
The relative probability of cancer detection for each PI-RADS score for PZ lesions rated PI-RADS category 3 at DW imaging and considered positive at DCE imaging (PI-RADS 3 + 1 lesions) is shown in Figure 3. The probability of cancer detection for PI-RADS 3 + 1 lesions was 67.8% (59 of 87) for all lesions and 54.0% for clinically important lesions; these probabilities were significantly higher than those for overall PI-RADS category 3 lesions (40.0% [46 of 115] vs 67.8% [47 of 87], P = .02) and lower than those for pure PI-RADS category 4 lesions (67.8% [47 of 87] vs 83.3% [184 of 221], P = .002).
Figure 3:
Graph shows probability of cancer detection with standard error for each PI-RADS version 2 score. Each score showed an added benefit over the previous score (P < .05). DW imaging lesions with a PI-RADS score of 3 and DCE-positive lesions in the PZ (Gleason 3 + 1) represent a distinct risk population from all other PI-RADS category 4 or 3 lesions. * = P < .05. CDR = cancer detection rate.
Validation of the Dominant Sequence
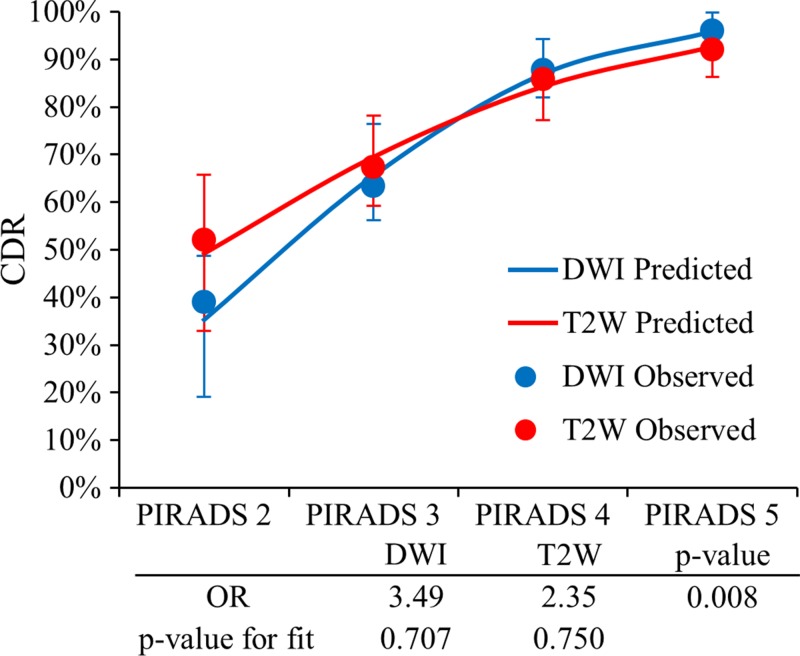
The predictive value of DW imaging versus that of T2-weighted imaging in the PZ for observed and modeled values is depicted in Figure 4. In the PZ, both DW and T2-weighted models fit the data well (goodness-of-fit test, P = .600 and P = 0.655, respectively). Higher probability of cancer detection for high-likelihood disease and lower probability of cancer detection for low-likelihood disease were predicted with DW imaging as compared with those values predicted with T2-weighted imaging. For DW imaging versus T2-weighted imaging, the predicted probability of cancer detection was 95.9% versus 92.7% for PI-RADS category 5 lesions and 35.3% versus 49.2% for PI-RADS category 2 lesions. The OR for DW imaging versus T2-weighted imaging for increasing probability of cancer detection for each incremental score was 3.49 (95% confidence interval [CI]: 2.34, 5.20) versus 2.35 (95% CI: 1.63, 3.40) (P = .008). Similar results were found for clinically important lesions, with an OR of 4.11 (95% CI: 2.81, 6.01) versus 2.43 (95% CI: 1.77, 3.35) (P < .001) for DW imaging versus T2-weighted imaging (Fig E1 [online]). These results tend to validate the dominant pulse sequence paradigm in the PZ.
Figure 4:
Graph shows validation of the dominant parameter in the PZ. PI-RADS scores at DW and T2-weighted imaging in the PZ are shown with corresponding ORs and P value for goodness of fit. PI-RADS DW imaging scores showed a higher predictive value for high likelihood scores (PI-RADS category 4 or 5) and a lower predictive value for low likelihood scores (PI-RADS category 2) versus PI-RADS T2-weighted scores (OR = 3.49 vs 2.35, P = .008).
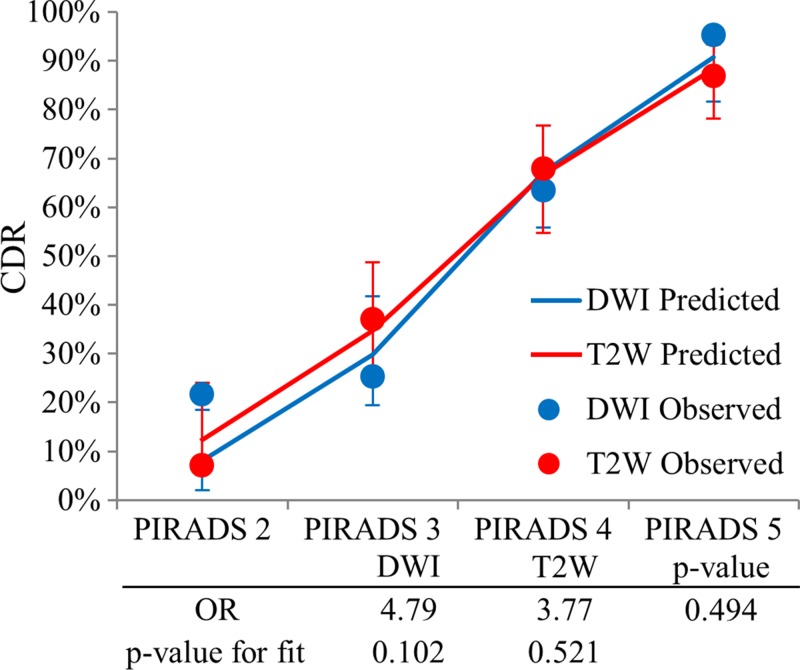
For the TZ, the difference between the performance of DW imaging and of T2-weighted imaging for all lesions was not significant (OR, 4.79 [95% CI: 2.79, 8.19] vs 3.77 [95% CI: 2.61, 5.44] for DW imaging vs T2-weighted imaging; P = .494). However, the observed versus predicted probability of cancer detection plot for the TZ shown in Figure 5 trended for a good fit for T2-weighted imaging (goodness-of-fit test, P = .521), which was not observed at DW imaging (goodness-of-fit test, P = .102). Similar results were found for clinically important lesions (OR, 4.99 [95% CI 2.86, 8.72] vs 3.74 [95% CI: 2.61, 5.36] for DW imaging vs T2-weighted imaging; P = .437) and are shown in Figure E2 (online). Thus, the value of the dominant pulse sequence paradigm for the TZ was not convincingly demonstrated.
Figure 5:
Graph shows validation of the dominant parameter in the TZ. PI-RADS scores at DW and T2-weighted imaging in the TZ are shown with corresponding ORs and P value for goodness of fit. No clear separation in incremental prediction value of PI-RADS scores was seen (OR, 3.77 vs 4.79; P = .494). However, the observed versus predicted plot trended for a better fit for T2-weighted (goodness-of-fit test, P = .521) over DW (goodness-of-fit test, P = .102) imaging.
Benefit of DCE Sequence
Among the 654 detected lesions, 505 (77.2%) were deemed positive at DCE imaging. For true-positive lesions (450 of 654 [68.8%]), 83.6% (376 of 450) were positive at DCE imaging. For false-positive lesions, 63.2% (129 of 204) were deemed positive at DCE imaging. Thus, if a lesion was scored as positive at DCE imaging, it had an OR of 2.95 of being a true-positive finding (95% CI: 2.02, 4.31; P < .001). The rate of DCE positivity for false-positive lesions was similar among all patients (63.2%) and in control patients (66.7%, 72 of 108).
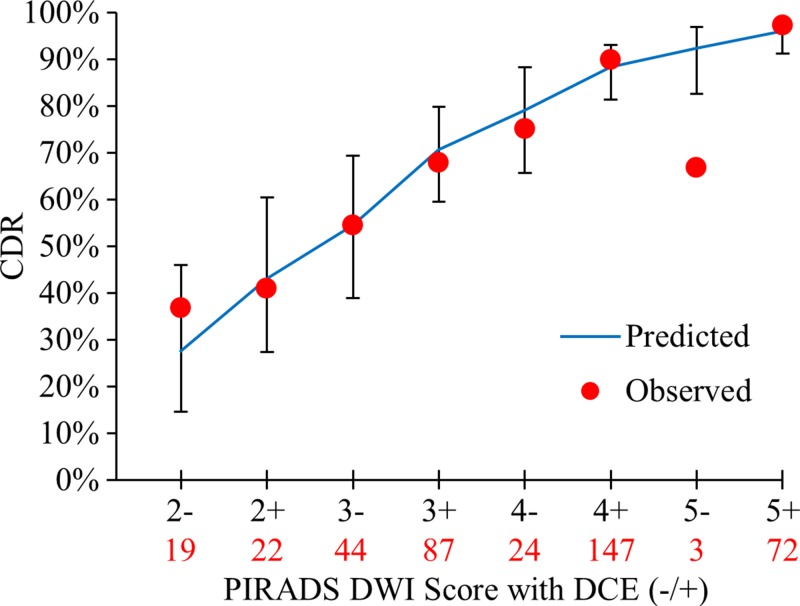
The incremental benefit of DCE positivity at each PI-RADS score was evaluated with the OR obtained from the predicted model and with the predicted value for each DW imaging score. DCE positivity was an independent predictor for cancer detection in the PZ for all lesions and for clinically important lesions. The OR was 2.0 (95% CI: 1.08, 3.70; P = .027) for all lesions, indicating the odds of detecting cancer were two times higher when DCE was positive for any DW imaging score in the PZ. Figure 6 shows observed versus predicted probability of cancer detection, along with predicted probability of cancer detection 95% CIs for DW imaging scores with and without DCE positivity. The predicted model fit the data well, with the exception of PI-RADS category 5 lesions at DW imaging, where only three lesions were detected (goodness-of-fit test, P = .747). For clinically important lesions in the PZ, the overall fit of the model predicted with DW imaging and DCE was appropriate (goodness-of-fit test, P = .356), with an OR of 2.45 (95% CI: 1.22, 4.91; P = .011) (Fig E3 [online]).
Figure 6:
Graph shows incremental value of DCE in the PZ to DW imaging scoring for all lesions. Displayed are the observed cancer detection rate (CDR) for each PI-RADS DW imaging score in the PZ, with DCE negativity or positivity and PI-RADS DW imaging score as independent variables in the model-based prediction with 95% CI bars. Total number of lesions detected for a given PI-RADS score is shown in red below each score. DCE positivity had an OR of 2.0 (95% CI: 1.08, 3.70; P = .027) for cancer positivity.
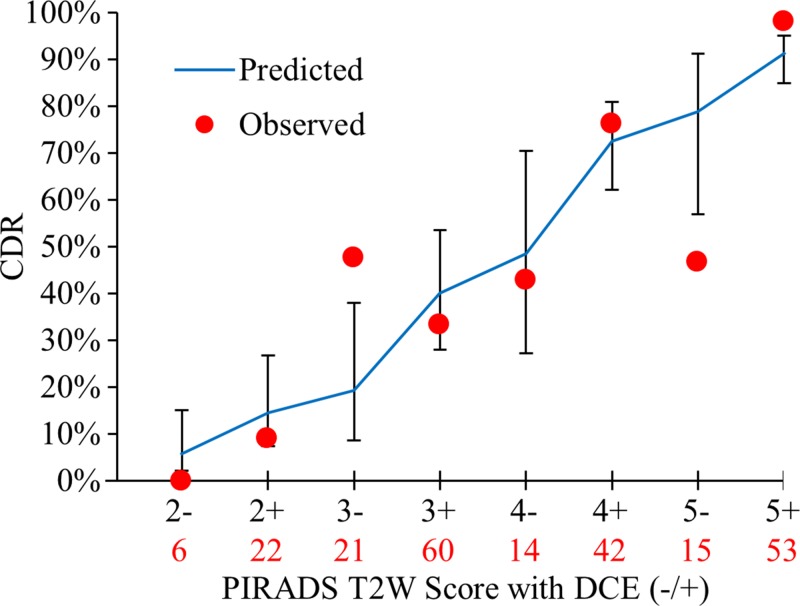
For all lesions in the TZ, Figure 7 shows the observed versus predicted probability of cancer detection, along with predicted probability of cancer detection 95% CIs for T2-weighted scores with and without DCE positivity. Because of the small number of lesions detected in the majority of T2-weighted DCE scores in the TZ, observed probability of cancer detection exhibits large variability, which was not well accounted for with the predicted model (goodness-of-fit test, P = .009). Nevertheless, the effect of DCE positivity for T2-weighted imaging in the TZ was significant and almost identical for all lesions (OR, 2.8; 95% CI: 1.09, 7.16; P = .032) and for clinically important lesions (OR, 2.9; 95% CI: 1.14, 7.39; P = .026) (Fig E4 [online]).
Figure 7:
Graph shows incremental value of DCE in the TZ to T2-weighted imaging for all lesions. Displayed are the observed cancer detection rate (CDR) for each PI-RADS T2-weighted imaging score in the TZ, with DCE negativity or positivity and PI-RADS T2-weighted scores as independent variables in the model-based prediction with 95% CI bars. Total number of lesions detected for a given PI-RADS score is shown in red below each score. DCE positivity had an OR of 2.8 (95% CI 1.09, 7.16; P = .032) for cancer positivity. However, the model is limited by fit to the observed values (P = .009).
Discussion
This study suggests PI-RADS version 2 scores are effective in cancer detection in the PZ and TZ. Our results show significant increases in the predictive value for each increment in PI-RADS score for all cancers and for clinically important cancers (P < .05 for all scores). PI-RADS scores resulted in probability of cancer detection that was not statistically different in the PZ and TZ probability of cancer detection for clinically important disease, except for PI-RADS category 2 lesions (23.8% vs 3.6%, P = .021). These data affirm the use of the dominant pulse sequence paradigm introduced in PI-RADS version 2 for PZ lesions, where the dominant pulse sequence is DW imaging. The dominant pulse sequence paradigm could not be validated in the TZ, where T2-weighted imaging is the dominant pulse sequence. These data also confirm the PI-RADS 3 + 1 strategy for using DCE positivity to boost a PI-RADS category 3 score to a PI-RADS category 4 score in the PZ. However, these data also suggest that DCE yields a larger benefit across all PI-RADS scores by increasing the probability of cancer detection in the PZ at all scores. Again, this effect is seen in the TZ but is less convincing, and a positive DCE does not yield as much benefit as it does in a PZ lesion.
Logistic regression models enabled us to confirm that PI-RADS DW imaging scores enable more reliable prediction of cancer in the PZ than do T2-weighted scores. The performance of DW imaging in the PZ enables us to confirm assumptions derived from previous research that show increased tumor-to-PZ contrast at high b values (13), higher sensitivity of DW imaging in the PZ than in the TZ (14), prediction of extraprostatic extension (15), and correlation of apparent diffusion coefficient values and Gleason scores (6). Our results suggest the DW imaging PI-RADS score is reliable in suggesting cancer in the PZ when DW and T2-weighted imaging findings are interpreted together, as suggested in PI-RADS version 2. For the TZ, T2-weighted PI-RADS scores trended toward better performance but were essentially equivalent to those for DW imaging. This may be due to a high false-positive rate from DW imaging in the TZ from benign prostatic hyperplasia, which can be further evaluated on T2-weighted images. Conversely, marked restricted diffusion can draw a reader’s eye to an abnormality that would have been missed at T2-weighted imaging. Thus, one primary dominant pulse sequence may not be appropriate for the TZ. Collectively, these results provide evidence for the dominant pulse sequence paradigm of PI-RADS version 2, particularly in the PZ.
The role of DCE imaging in prostate multiparametric MR imaging has been the topic of much discussion (8,9,16,17). The use of DCE imaging is increasingly controversial, with several authors suggesting it be abandoned (16,17). PI-RADS version 2 scoring criteria limit the role of DCE to the PI-RADS 3 + 1 strategy that permits a PI-RADS category 3 lesion to be increased to a PI-RADS category 4 lesion for DCE positivity. In the analysis of added benefit of DCE imaging at each PI-RADS score for each parameter in the PZ and TZ, DCE positivity improved the probability of cancer detection of PI-RADS category 2, 3, and 4 lesions for the PZ (OR, 2.00; P = .027). While DCE findings trended toward a similar pattern in the TZ, no conclusive significance was found with the relatively few lesions in the TZ in this cohort. A potential weakness of PI-RADS version 2 is that the definitions of PI-RADS category 2, 3, and 4 lesions are vague and have caused some confusion among users (18). Mertan et al (19) found in a single-reader prospective study of PI-RADS version 2 that PI-RADS category 4 lesions highly underperformed when compared with PI-RADS category 5 lesions for targeted biopsies (probability of cancer detection, 42.6% vs 78.1%, P = .002). Our data suggest a positive DCE finding in a lesion detected over all PI-RADS scores increases the likelihood of a positive biopsy of clinically important disease. Additionally, although PI-RADS category 5 and DCE-negative lesions were a rare occurrence (three in the PZ, 15 in the TZ), the probability of cancer detection for these lesions was lower than expected (66.7% negative vs 92.3% positive in the PZ, 46.7% negative vs 78.8% positive in the TZ at DCE imaging). This suggests DCE positivity may be useful for increasing the likelihood of disease for PI-RADS category 5 lesions. However, the role of DCE imaging in lesion detection cannot be conclusively determined from these data. In addition, the high rate of DCE positivity (63.2%) in patients with false-positive findings may be decreased without DCE. Prospective controlled trials are necessary to elucidate the value of DCE imaging.
This study revealed another interesting feature of PI-RADS version 2, namely the higher-than-expected probability of cancer detection for PI-RADS category 2 lesions in the PZ. Conceptually, PI-RADS category 2 lesions do not require biopsy, and readers in this study were instructed to detect lesions that would be included in a clinical report, presumed to be PI-RADS category 3 or higher lesions. While the probability of cancer detection for all of these lesions was low for clinically important disease (15.7%), the PI-RADS category 2 lesions in the PZ had a higher than expected probability of cancer detection of 24% for clinically important lesions. These PI-RADS category 2 true-positive (or false-negative) lesions were primarily small lesions at pathologic analysis that were less likely to be detected at biopsy. The dominant pulse sequence paradigm did a show mild increase in negative predictive value for PI-RADS category 2 lesions instead of taking the highest value (DW or T2-weighted imaging) score. Although we did not study interreader variability, it is likely that there was some ambiguity in the mind of readers between PI-RADS category 2 and 3 lesions. In future revisions of PI-RADS, the subjectivity and resulting overlap between PI-RADS category 2 and 3 lesions should be considered when recommending biopsy on the basis of PI-RADS scores.
There were several limitations to our study. Our study cohort relied on patients undergoing radical prostatectomy. This has the advantage of having certainty regarding the pathologic outcome of all lesions, but this population tends to be younger and have higher risk than does the general population. To reduce detection bias, we included control subjects without lesions detected at multiparametric MR imaging and with negative systematic biopsy results. Our study was also limited because it was performed at one institution. However, the imaging and interpretation protocols were entirely within PI-RADS version 2 guidelines. Furthermore, we included nine readers who practice at eight different institutions in six different countries to represent a broad population of readers with varying experience. Although interreader agreement was not a central theme of this study, we did account for interreader correlation in our generalized estimating equations model, and the results are indicative of how readers across a broad spectrum of experience would score a detected lesion.
In conclusion, this study affirms the value of the dominant pulse sequence paradigm put forth in PI-RADS version 2, especially in the PZ, and clarifies that DCE MR imaging, whose role in PI-RADS version 2 is controversial, adds significant benefit to PI-RADS category 3 and 4 lesions in the PZ. Rather than suggesting DCE should be eliminated, these data suggest DCE should be expanded to other PI-RADS scores to stratify risk more accurately.
Advances in Knowledge
■ The Prostate Imaging Reporting and Data System (PI-RADS) version 2 scores result in significantly distinct probability of cancer detection (15.7%, 33.1%, 70.5%, 90.7% for PI-RADS category 2, 3, 4, and 5 lesions, respectively; P < .01 between each).
■ PI-RADS version 2 scores show equivalent probability of cancer detection for peripheral zone (PZ) and transition zone (TZ) tumors for clinically important disease (P > .05 for PI-RADS category 3, 4, and 5 lesions), with the exception of PI-RADS category 2 lesions (23.8% in the PZ, 3.6% in the TZ; P = .021).
■ Diffusion-weighted (DW) imaging outperforms T2-weighted imaging in the PZ when using PI-RADS version 2 scoring criteria, validating DW imaging as the dominant pulse sequence in the PZ (odds ratio [OR], 3.49 vs 2.45 for DW imaging and T2-weighted imaging, respectively; P = .008).
■ Dynamic contrast-enhanced imaging improves the probability of cancer detection for PI-RADS category 3 and 4 lesions in the PZ (OR, 2.0; P = .027).
Implication for Patient Care
■ We show that PI-RADS version 2 yields efficient scoring criteria to facilitate probability of cancer detection by radiologists; however, dynamic contrast-enhanced imaging may be of more assistance than PI-RADS version 2 proposes.
SUPPLEMENTAL FIGURES
Received June 20, 2016; revision requested August 10; revision received February 17, 2017; accepted April 4; final version accepted May 4.
Supported by the Intramural Research Program, National Cancer Institute, National Institutes of Health (grant ZIA BC 010655).
Current address: Cleveland Clinic Lerner College of Medicine, Cleveland, Ohio.
Disclosures of Conflicts of Interest: M.D.G. disclosed no relevant relationships. J.H.S. disclosed no relevant relationships. N.L. disclosed no relevant relationships. T.B. disclosed no relevant relationships. L.K.B. disclosed no relevant relationships. S.B. disclosed no relevant relationships. I.M.K. disclosed no relevant relationships. Y.M.L. disclosed no relevant relationships. J.M. disclosed no relevant relationships. H.S. disclosed no relevant relationships. F.V.M. disclosed no relevant relationships. M.J.M. disclosed no relevant relationships. B.J.W. Activities related to the present article: has a cooperative research and development agreement with Philips and InVivo. Activities not related to the present article: disclosed no relevant relationships. Other relationships: has multiple patents in the field of fusion imaging, as well as devices and systems for prostate fusion, navigation, and fusion, licensed to Philips and InVivo. P.A.P. disclosed no relevant relationships. R.M.S. Activities related to the present article: disclosed no relevant relationships. Activities not related to the present article: has a cooperative research and development agreement with Ping An. Other relationships: has a patent pending for prostate MR imaging computer-aided detection and a patent for CT colonography computer-aided detection, with royalties paid by iCAD. P.L.C. disclosed no relevant relationships. B.T. disclosed no relevant relationships.
Abbreviations:
- CI
- confidence interval
- DCE
- dynamic contrast enhanced
- DW
- diffusion weighted
- OR
- odds ratio
- PI-RADS
- Prostate Imaging Reporting and Data System
- PZ
- peripheral zone
- TZ
- transition zone
References
- 1.American College of Radiology . MR Prostate Imaging Reporting and Data System version 2.0. Reston, Va: American College of Radiology, 2015. [Google Scholar]
- 2.Vaché T, Bratan F, Mège-Lechevallier F, Roche S, Rabilloud M, Rouvière O. Characterization of prostate lesions as benign or malignant at multiparametric MR imaging: comparison of three scoring systems in patients treated with radical prostatectomy. Radiology 2014;272(2):446–455. [DOI] [PubMed] [Google Scholar]
- 3.Delongchamps NB, Rouanne M, Flam T, et al. Multiparametric magnetic resonance imaging for the detection and localization of prostate cancer: combination of T2-weighted, dynamic contrast-enhanced and diffusion-weighted imaging. BJU Int 2011;107(9):1411–1418. [DOI] [PubMed] [Google Scholar]
- 4.Akin O, Sala E, Moskowitz CS, et al. Transition zone prostate cancers: features, detection, localization, and staging at endorectal MR imaging. Radiology 2006;239(3):784–792. [DOI] [PubMed] [Google Scholar]
- 5.Hoeks CM, Hambrock T, Yakar D, et al. Transition zone prostate cancer: detection and localization with 3-T multiparametric MR imaging. Radiology 2013;266(1):207–217. [DOI] [PubMed] [Google Scholar]
- 6.Turkbey B, Shah VP, Pang Y, et al. Is apparent diffusion coefficient associated with clinical risk scores for prostate cancers that are visible on 3-T MR images? Radiology 2011;258(2):488–495. [DOI] [PMC free article] [PubMed] [Google Scholar]
- 7.Rosenkrantz AB, Mannelli L, Kong X, et al. Prostate cancer: utility of fusion of T2-weighted and high b-value diffusion-weighted images for peripheral zone tumor detection and localization. J Magn Reson Imaging 2011;34(1):95–100. [DOI] [PubMed] [Google Scholar]
- 8.Iwazawa J, Mitani T, Sassa S, Ohue S. Prostate cancer detection with MRI: is dynamic contrast-enhanced imaging necessary in addition to diffusion-weighted imaging? Diagn Interv Radiol 2011;17(3):243–248. [DOI] [PubMed] [Google Scholar]
- 9.Junker D, Quentin M, Nagele U, et al. Evaluation of the PI-RADS scoring system for mpMRI of the prostate: a whole-mount step-section analysis. World J Urol 2015;33(7):1023–1030. [DOI] [PubMed] [Google Scholar]
- 10.Greer MD, Brown AM, Shih JH. Accuracy and agreement of PIRADSv2 for prostate cancer mpMRI: a multireader study. J Magn Reson Imaging 2017;45(2):579–585. [DOI] [PMC free article] [PubMed] [Google Scholar]
- 11.Medixant . RadiAnt DICOM Viewer. 2.2.9.10728 ed. http://www.radiantviewer.com/2015. Accessed December 1, 2015.
- 12.Barnhart HX, Williamson JM. Goodness-of-fit tests for GEE modeling with binary responses. Biometrics 1998;54(2):720–729. [PubMed] [Google Scholar]
- 13.Rosenkrantz AB, Parikh N, Kierans AS, et al. Prostate cancer detection using computed very high b-value diffusion-weighted imaging: how high should we go? Acad Radiol 2016;23(6):704–711. [DOI] [PubMed] [Google Scholar]
- 14.Jie C, Rongbo L, Ping T. The value of diffusion-weighted imaging in the detection of prostate cancer: a meta-analysis. Eur Radiol 2014;24(8):1929–1941. [DOI] [PMC free article] [PubMed] [Google Scholar]
- 15.Kayat Bittencourt L, Litjens G, Hulsbergen-van de Kaa CA, Turkbey B, Gasparetto EL, Barentsz JO. Prostate cancer: the European Society of Urogenital Radiology Prostate Imaging Reporting and Data System criteria for predicting extraprostatic extension by using 3-T multiparametric MR imaging. Radiology 2015;276(2):479–489. [DOI] [PubMed] [Google Scholar]
- 16.Rud E, Baco E. Re: Jeffrey C. Weinreb, Jelle O. Barentsz, Peter L. Choyke, et al. PI-RADS Prostate Imaging - Reporting and Data System: 2015, Version 2. Eur Urol 2016;69:16-40: Is Contrast-enhanced Magnetic Resonance Imaging Really Necessary When Searching for Prostate Cancer? Eur Urol 2016;70(5):e136. [DOI] [PubMed] [Google Scholar]
- 17.Barentsz JO, Choyke PL, Cornud F, et al. Reply to Erik Rud and Eduard Baco’s Letter to the Editor re: Re: Jeffrey C. Weinreb, Jelle O. Barentsz, Peter L. Choyke, et al. PI-RADS Prostate Imaging - Reporting and Data System: 2015, Version 2. Eur Urol 2016;69:16-40. Eur Urol 2016;70(5):e137–e138. [DOI] [PMC free article] [PubMed] [Google Scholar]
- 18.Rosenkrantz AB, Oto A, Turkbey B, Westphalen AC. Prostate Imaging Reporting and Data System (PI-RADS), Version 2: a critical look. AJR Am J Roentgenol 2016;206(6):1179–1183. [DOI] [PubMed] [Google Scholar]
- 19.Mertan FV, Greer MD, Shih JH, et al. Prospective evaluation of the Prostate Imaging Reporting and Data System Version 2 for prostate cancer detection. J Urol 2016;196(3):690–696. [DOI] [PubMed] [Google Scholar]
Associated Data
This section collects any data citations, data availability statements, or supplementary materials included in this article.


