

Targeted monoclonal antibody–conjugated hybrid nanoparticles serve as a catalyst for photothermal ablation of colorectal liver metastases, thus increasing ablation zones.
Abstract
Purpose
To demonstrate that anti-MG1 conjugated hybrid magnetic gold nanoparticles (HNPs) act as a catalyst during photothermal ablation (PTA) of colorectal liver metastases, and thus increase ablation zones.
Materials and Methods
All experiments were performed with approval of the institutional animal care and use committee. Therapeutic and diagnostic multifunctional HNPs conjugated with anti-MG1 monoclonal antibodies were synthesized, and the coupling efficiency was determined. Livers of 19 Wistar rats were implanted with 5 × 10⁶ rat colorectal liver metastasis cell line cells. The rats were divided into three groups according to injection: anti-MG1–coupled HNPs (n = 6), HNPs only (n = 6), and cells only (control group, n = 7). Voxel-wise R2 and R2* magnetic resonance (MR) imaging measurements were obtained before, immediately after, and 24 hours after injection. PTA was then performed with a fiber-coupled near-infrared (808 nm) diode laser with laser power of 0.56 W/cm2 for 3 minutes, while temperature changes were measured. Tumors were assessed for necrosis with hematoxylin-eosin staining. Organs were analyzed with inductively coupled plasma mass spectrometry to assess biodistribution. Therapeutic efficacy and tumor necrosis area were compared by using a one-way analysis of variance with post hoc analysis for statistically significant differences.
Results
The coupling efficiency was 22 μg/mg (55%). Significant differences were found between preinfusion and 24-hour postinfusion measurements of both T2 (repeated measures analysis of variance, P = .025) and T2* (P < .001). Significant differences also existed for T2* measurements between the anti-MG1 HNP and HNP-only groups (P = .034). Mean temperature ± standard deviation with PTA in the anti-MG1–coated HNP, HNP, and control groups was 50.2°C ± 7.8, 51°C ± 4.4, and 39.5°C ± 2.0, respectively. Inductively coupled plasma mass spectrometry revealed significant tumor targeting and splenic sequestration. Mean percentages of tumor necrosis in the anti-MG1–coated HNP, HNP, and control groups were 38% ± 29, 14% ± 17, and 7% ± 8, respectively (P = .043).
Conclusion
Targeted monoclonal antibody–conjugated HNPs can serve as a catalyst for photothermal ablation of colorectal liver metastases by increasing ablation zones.
© RSNA, 2017
Introduction
The American Cancer Society estimates that colorectal cancer will account for 51 690 deaths annually, making it the third most common cause of cancer-related death nationally (1). Surgical resection of the primary tumor is curative; however, 19% of patients present with synchronous metastases (1,2). Only 25% of patients with colorectal liver metastases are candidates for surgical resection due to number, size, and location of their hepatic metastases (2). However, only 50% of those who undergo surgical resection with curative intent are alive at 5 years (3,4). Ablative techniques can be a good alternative to surgery; however, their use is limited by tumor size, because ablation typically is only effective in tumors smaller than 4–5 cm in diameter (5). Sensitization with nanotechnology can increase ablative capabilities without causing further toxicity and/or damage to a liver that has already been exposed to hepatotoxic chemotherapy.
Multifunctional gold nanoparticles have been increasingly important in multimodality treatment approaches for many types of cancer, including breast, pancreatic, and colorectal cancers (6–9). These treatment algorithms should include an efficient nanomaterial system that permits magnetic resonance (MR) imaging visualization and quantification (10) and photothermal sensitization (11,12). Multifunctional nanoparticles composed of iron oxide permit MR imaging visualization by means of R2 and R2* relaxivity mechanisms and allow for noninvasive quantification of nanoparticle delivery to targeted tumors (13,14). The addition of a gold shell allows targeted hyperthermia through conversion of external electromagnetic energy, such as near-infrared (NIR) laser irradiation, into heat because of strong cross-sectional absorption of light and heat conversion (15). Although nanoshells have not been used clinically to treat colorectal liver metastases, the combination of gold nanoshells and laser thermal therapy tested in ex vivo canine liver tissue showed safety and therapeutic efficacy (16). The optimal penetration of laser light is directly associated with less risk of carbonization and vaporization of tissue and better treatment results for tumors (17). The depth of laser penetration is greater in metastatic tumors than in normal liver tissue (18). To our knowledge, there have been a limited number of trials that were proposed to treat liver metastases with lasers. However, most of the trials that have included laser treatment have shown safety and efficacy in treatment of liver metastases and reductions in morbidity and mortality (19). Laser photothermal ablation (PTA) is effective to treat surface tumors but has limited application for treatment of deep tissue tumors, primarily because of the light scattered by tissue. However, multifunctional nanoparticles that can be triggered by lasers have expanded the use of laser applications (20). Furthermore, nanoparticles conjugated to tumor-selective monoclonal antibodies (mAbs) permit specific tumor targeting to increase the intratumoral concentration of nanoparticles for photothermal sensitization. It is crucial to choose a suitable surface-targeting ligand that is highly up-regulated in tumor cells but absent or poorly expressed in normal tissue (11,12). MG1 mAbs have been shown to localize to rat colorectal liver metastasis cells, or the CC-531 cell line, in a rat model, while not binding to other tissue (21). Thus, anti-MG1 should serve as an effective surface ligand for in vivo selective binding.
Biofunctionalized gold nanoparticles should increase ablative capabilities in the treatment of colorectal liver metastases by increasing the size of ablation zones. Because gold converts light energy to heat and the nanoparticles deposit in all tumor cells (including those at the periphery), the area of heat generated will be increased, allowing for a larger zone of ablation. The purpose of our study was to demonstrate that anti-MG1 conjugated hybrid magnetic gold nanoparticles (HNPs) act as a catalyst during PTA, thus increasing ablation zones.
Materials and Methods
Nanoparticle Synthesis
HNPs were synthesized by using gold chloride, cetyltrimethylammonium bromide, ascorbic acid, sodium borohydride (Sigma-Aldrich) and ultrasmall superparamagnetic iron oxide nanoparticles (D.H.K. and A.C.L., with 15 and 20 years of experience, respectively, in nanomaterial synthesis and in vivo imaging) (22–25). Anti-MG1 mAbs (Acris Antibodies, San Diego, Calif) were conjugated with HNPs in accordance with established 1-ethyl-3-[3-dimethylaminopropyl] carbodiimide hydrochloride/N-hydroxy-sulfosuccinimide, or EDC/NHS, chemistry (Fig 1a) and were measured with transmission electron microscopy. The transduction efficiency, which represents the ability of a nanoparticle to convert light to heat, was calculated, as described previously (26,27). The photothermal ablation transduction efficiency was calculated according to this formula:
where  is photothermal transduction efficiency, h is the heat transfer coefficient, A is the surface area, Tmax is the maximum temperature achieved, Ta is ambient temperature, I is the laser power, and OD is optical density at 808 nm. The coupling capacity was determined by using an ultraviolet, visible, and NIR spectrophotometer (LAMBDA1050; PerkinElmer, Boston, Mass) at the wavelength of 280 nm. The coupling efficiency of anti-MG1 mAbs with HNPs was calculated according to this formula: mAbup = 1 − (ODpost/ODpre) (28), where mAbup is mAb uptake and ODpost and ODpre are OD at 280 nm after and before coupling, respectively. HNPs not coupled to anti-MG1 were also produced and were used to serve as a control.
Figure 1a:

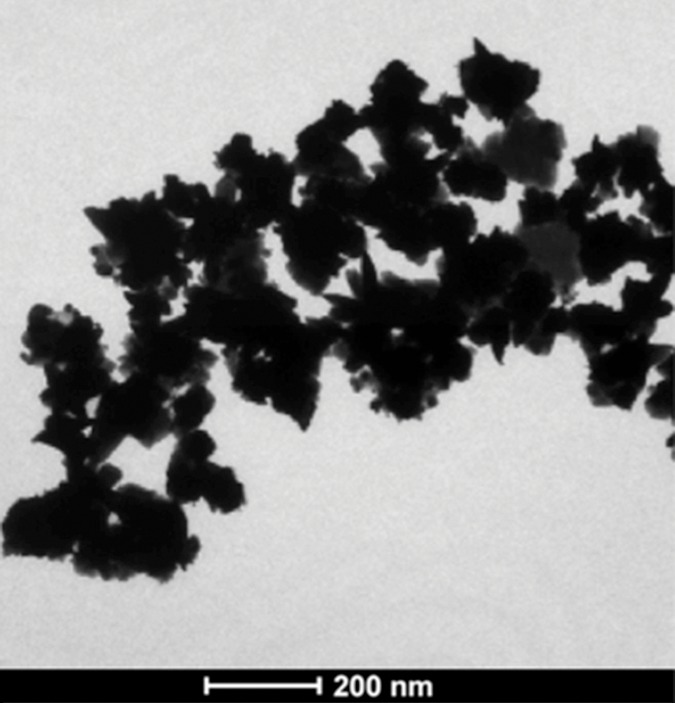
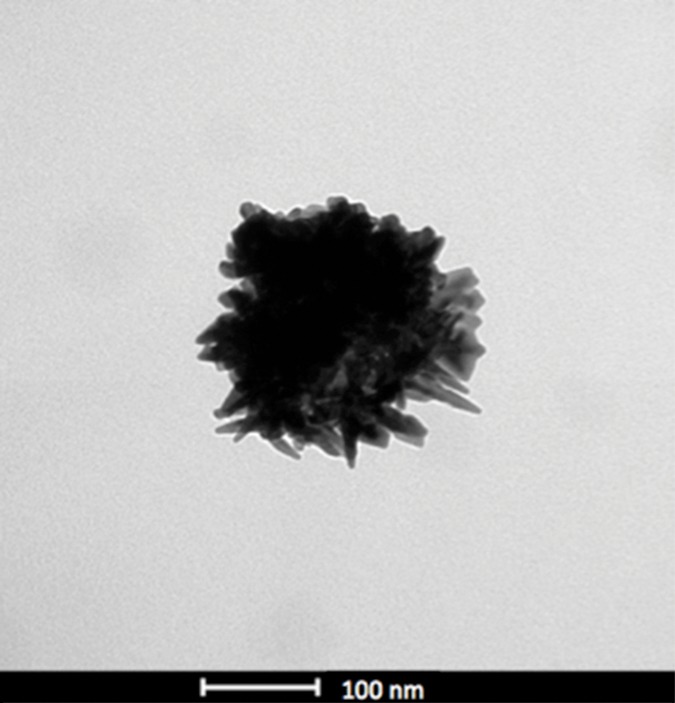
Nanomaterial synthesis. Ultrasmall superparamagnetic iron oxide (USPIO) clusters were mixed with silver (Ag), which acts as a catalyst allowing gold (Au) to coat USPIO clusters. Polyethylene glycol (PEG) is added, which contains sulfyl (SH) and hydroxyl (COOH) groups at opposite ends of the molecules. The sulfonyl group binds to the gold shell, while the hydroxyl group binds to a commercially available coupling agent (1-ethyl-3-[3-dimethylaminopropyl] carbodiimide hydrochloride/N-hydroxysulfosuccinimide, or EDC-NHS). The anti-MG1 mAb can then be coupled to the nanoparticle. (a) Illustration shows synthesis of mAb conjugated HNP, (b–d) transmission electron microscopic images show USPIO clusters measuring (b) 200 nm, (c) 200 nm, and (d) 100 nm. Graphs show size distribution measured with (e) Zetasizer and (f) absorption band of USPIO clusters and HNP.
Figure 1b:

Nanomaterial synthesis. Ultrasmall superparamagnetic iron oxide (USPIO) clusters were mixed with silver (Ag), which acts as a catalyst allowing gold (Au) to coat USPIO clusters. Polyethylene glycol (PEG) is added, which contains sulfyl (SH) and hydroxyl (COOH) groups at opposite ends of the molecules. The sulfonyl group binds to the gold shell, while the hydroxyl group binds to a commercially available coupling agent (1-ethyl-3-[3-dimethylaminopropyl] carbodiimide hydrochloride/N-hydroxysulfosuccinimide, or EDC-NHS). The anti-MG1 mAb can then be coupled to the nanoparticle. (a) Illustration shows synthesis of mAb conjugated HNP, (b–d) transmission electron microscopic images show USPIO clusters measuring (b) 200 nm, (c) 200 nm, and (d) 100 nm. Graphs show size distribution measured with (e) Zetasizer and (f) absorption band of USPIO clusters and HNP.
Figure 1c:
Nanomaterial synthesis. Ultrasmall superparamagnetic iron oxide (USPIO) clusters were mixed with silver (Ag), which acts as a catalyst allowing gold (Au) to coat USPIO clusters. Polyethylene glycol (PEG) is added, which contains sulfyl (SH) and hydroxyl (COOH) groups at opposite ends of the molecules. The sulfonyl group binds to the gold shell, while the hydroxyl group binds to a commercially available coupling agent (1-ethyl-3-[3-dimethylaminopropyl] carbodiimide hydrochloride/N-hydroxysulfosuccinimide, or EDC-NHS). The anti-MG1 mAb can then be coupled to the nanoparticle. (a) Illustration shows synthesis of mAb conjugated HNP, (b–d) transmission electron microscopic images show USPIO clusters measuring (b) 200 nm, (c) 200 nm, and (d) 100 nm. Graphs show size distribution measured with (e) Zetasizer and (f) absorption band of USPIO clusters and HNP.
Figure 1d:
Nanomaterial synthesis. Ultrasmall superparamagnetic iron oxide (USPIO) clusters were mixed with silver (Ag), which acts as a catalyst allowing gold (Au) to coat USPIO clusters. Polyethylene glycol (PEG) is added, which contains sulfyl (SH) and hydroxyl (COOH) groups at opposite ends of the molecules. The sulfonyl group binds to the gold shell, while the hydroxyl group binds to a commercially available coupling agent (1-ethyl-3-[3-dimethylaminopropyl] carbodiimide hydrochloride/N-hydroxysulfosuccinimide, or EDC-NHS). The anti-MG1 mAb can then be coupled to the nanoparticle. (a) Illustration shows synthesis of mAb conjugated HNP, (b–d) transmission electron microscopic images show USPIO clusters measuring (b) 200 nm, (c) 200 nm, and (d) 100 nm. Graphs show size distribution measured with (e) Zetasizer and (f) absorption band of USPIO clusters and HNP.
Cell Culture
The rat colorectal liver metastasis cell line (CC-531, a gift from the University of Pittsburgh) was tested and found to be free of viruses and mycoplasma. The cells were cultured in Dulbecco’s modified Eagle’s medium (Life Technologies, Carlsbad, Calif) supplemented with 10% fetal bovine serum (Gemini Bio-Products, West Sacramento, Calif) and 1%–5% penicillin-streptomycin (Sigma-Aldrich, St Louis, Mo).
Cellular Uptake of Nanoparticles
In a 24-well plate, 2.5 × 10⁶ cells were incubated with 7.6 μmol of anti-MG1 HNPs for 24 hours to allow for selective binding. The cells were then fixed and stained with 4ʹ,6-diamidine-2-phenylindole, or DAPI, and immunofluorescence was performed (Y.G., with 8 years of experience in imaging and MR imaging and S.B.W., with 10 years of experience in cytology, animal experiments, and imaging). Images were acquired by using a laser scanning confocal microscope (UV LSM 510; Zeiss, Jena, Germany). In addition, transmission electron microscopy (Tecnai Spirit G2; FEI, Hillsboro Ore) was performed to confirm cellular uptake of anti-MG1 HNPs compared with that of HNPs only.
Temperature Measurements and Cellular Viability
Anti-MG1 HNPs at different concentrations were seeded in 96 well plates and were irradiated for 3 minutes with an NIR laser system (BWF5; B&W Tek, Newark, Del) with a diode fiber laser by using a continuous wave of 808 nm at 0.47 and 0.94 W/cm2. In addition, cells seeded in 96 well plates were incubated with and without nanomaterial. The cells were divided into three groups according to treatment: (a) the photothermal ablation (0.47 W/cm2 for 3 minutes) group, (b) the HNP exposure group, and (c) the control group (cells alone). Temperature was recorded at 15-second intervals by using fiber-optic probes (FTP-LN2; Photon Control, Burnaby, Canada). After ablation, the number of viable cells was counted by using trypan blue staining, and the percentage of viable cells was determined (Y.G., S.B.W.).
Animal Experimentation
All experiments were performed with approval of the institutional animal care and use committee. Wistar rats weighing 300–350 g were acclimated for 1 week and housed with food and water ad libitum.
Cellular Inoculation
Anesthesia was administered by using 2%–3% isoflurane. A 5-cm midline incision was made in each rat and both the left and right hepatic lobes were mobilized to implant subcapsular tumors as described elsewhere (29) (S.B.W.). The rats underwent weekly MR imaging until the tumors reached 0.5–1 cm in greatest dimension, typically 1–2 weeks.
MR Imaging
MR imaging examinations were performed by using a 7.0-T MR imager (Bruker ClinScan; Bruker Biospin, Ettlingen, Germany) with a 30-cm bore and a 75-mm QuadTransceiver rat coil (Bruker Biospin), an isoflurane anesthesia system, a body temperature control and monitoring system for vital signs, and an MR imaging–compatible small animal gating system (SA Instruments, Stony Brook, NY) to permit free-breathing acquisition sequences for pre- and postprocedural MR imaging measurements (S.B.W., Y.G., and J.C., with 2 years of experience in animal experiments and imaging). Phantom models containing anti-MG1 HNPs at different concentrations were constructed by using 0.5% agarose. The phantoms were imaged with a multisection spin-echo sequence and a multiple gradient-recalled-echo sequence. A gradient-recalled-echo sequence was performed with the following parameters: repetition time msec/echo times msec, 800/3.28, 6.14, 9.00, and 11.86; field of view, 150 × 60 mm2; matrix, 192 × 78; bandwidth, 500 Hz per pixel; and section thickness, 1 mm. A spin-echo sequence was performed with the following parameters: 800/11.1, 22.2, 33.3, and 44.4; section thickness, 1 mm; field of view, 150 × 60 mm2; matrix, 192 × 78. The rats were imaged before, immediately after, and 24 hours after anti-MG1 HNP infusion with coronal orientation by using the multisection spin-echo and multiple gradient-recalled-echo sequences with imaging parameters the same as those described. Respiratory triggering was performed by using a gating system (Model 1025, SA Instruments). To estimate HNP concentrations in each phantom or rat, voxel-wise R2 and R2* maps were generated with software (Matlab; Math Works, Natick, Mass) by using the nonlinear Levenberg-Marquardt algorithm to fit the monoexponential decay component: SITEi = SI0 · exp (−R2* · TEi), where SITEi is the MR signal intensity at echo time TEi, and SI0 is the MR imaging signal intensity at echo time 0 (J.C., A.C.L. and W.L., with 10 years of experience in MR imaging). These MR imaging–measured HNP concentrations were verified by means of comparison with the reference standard inductively coupled plasma mass spectrometry measurements and were used to confirm delivery of HNPs to the tumors in the rats. Mean changes in R2* and R2 with concentration were used to calculate the least squares fit line with the slope providing the R2* or R2 relaxivity per second and concentration of nanoparticles.
Nanoparticle Infusion and Photothermal Ablation
Nanoparticles (7.6 μmol of anti-MG1 HNPs [concentration range at which 85% of cells were viable] and 1.5 mg of HNPs) were infused into the tail veins of the rats (S.B.W.). After MR imaging, photothermal ablation was performed by using a laser power of 0.56 W/cm2 for 3 minutes. Because photothermal heating rates increase with increasing rates of laser power, the power of 0.56 W/cm3 was used to overcome the dissipation of heat due to the in vivo environment (blood flow causing heat sink effect) while still allowing safe ablation and preventing nonspecific tissue heating. An infrared thermal camera (ICI7320P; Infrared Cameras, Beaumont, Tex) was used to measure the temperature of the irradiated region (S.B.W., Y.G., and D.H.K.).
Tumor Necrosis
After the completion of MR imaging (24 hours after infusion), animals were euthanized, and tumors were collected for histologic assessment with hematoxylin-eosin and Prussian blue staining. Tumor necrosis was determined in each group by recording the longest and transverse dimensions of each tumor and necrosis area, and these dimensions allowed comparison of treatment efficacy. Area was estimated by using the following formula: A = LD · TD, where A is the area, LD is the longest dimension, and TD is the transverse dimension (Y.Y., with 5 of years experience in MR imaging and analysis).
Biodistribution
Organs were digested in a 9:1 mixture of 70% nitric acid (VWR Scientific, Radnor, Pa) and 30% hydrogen peroxide (Sigma Aldrich) by using a digestion system (EZ Microwave Digestion System; Milestone, Shelton, Conn) (S.B.W., J.C., D.H.K., and V.G., with 1 year of experience in imaging, inductively coupled plasma mass spectrometry, and animal experimentation). The iron and gold content of the HNPs were characterized by comparing them to a multielement internal standard. Inductively coupled plasma mass spectrometry was performed with a mass spectrometer (Thermo iCapQc ICP-MS; Thermo Fisher Scientific, Waltham, Mass) equipped with an auto sampler (Cetac 260; Thermo Fisher Scientific).
Statistical Analysis
R2 and R2* for each phantom model was compared with iron concentration measured with inductively coupled plasma mass spectrometry by using Spearman correlation and a nonparametric Mann-Whitney U test to compare therapeutic efficacy in the ablated tumors with that in the control tumors (Y.G., W.L., S.B.W.). The Student t test was performed to compare changes in the temperatures, viability of cells, and the distributed iron amounts in organs (D.H.K.). A one-way analysis of variance was performed for the area of necrosis in post hoc analysis (Y.Y.). Repeated measures analyses of variance were performed to compare the T2 and T2* measurements before infusion with those at 24 hours after infusion and between the anti-MG1 HNP and HNP alone treatment groups (W.L.). P values of less than .05 were considered to indicate a statistically significant difference. Statistical analysis was performed by using software (SAS; SAS, Cary, NC).
Results
Nanoparticle Synthesis
HNPs were measured at 47 nm (Fig 1), branches at 10–20 nm, and cores at 20 nm. Size distribution was measured (Zetasizer Nano-S; Malvern Instruments, Malvern, Germany). The hydrodynamic size was increased slightly to 54 nm with the organic surface layer of HNPs compared with the measured size of 47 nm on transmission electron microscopic images (Fig 1e). HNPs absorbed 798 nm of NIR light; NIR absorption was not observed for iron oxide nanoclusters (Fig 1f). The calculated percentage of photothermal transduction efficiency for HNP was determined to be 55% and the coupling efficiency of the anti-MG1 antibody was 22 μg/mg (55%).
Figure 1e:

Nanomaterial synthesis. Ultrasmall superparamagnetic iron oxide (USPIO) clusters were mixed with silver (Ag), which acts as a catalyst allowing gold (Au) to coat USPIO clusters. Polyethylene glycol (PEG) is added, which contains sulfyl (SH) and hydroxyl (COOH) groups at opposite ends of the molecules. The sulfonyl group binds to the gold shell, while the hydroxyl group binds to a commercially available coupling agent (1-ethyl-3-[3-dimethylaminopropyl] carbodiimide hydrochloride/N-hydroxysulfosuccinimide, or EDC-NHS). The anti-MG1 mAb can then be coupled to the nanoparticle. (a) Illustration shows synthesis of mAb conjugated HNP, (b–d) transmission electron microscopic images show USPIO clusters measuring (b) 200 nm, (c) 200 nm, and (d) 100 nm. Graphs show size distribution measured with (e) Zetasizer and (f) absorption band of USPIO clusters and HNP.
Figure 1f:

Nanomaterial synthesis. Ultrasmall superparamagnetic iron oxide (USPIO) clusters were mixed with silver (Ag), which acts as a catalyst allowing gold (Au) to coat USPIO clusters. Polyethylene glycol (PEG) is added, which contains sulfyl (SH) and hydroxyl (COOH) groups at opposite ends of the molecules. The sulfonyl group binds to the gold shell, while the hydroxyl group binds to a commercially available coupling agent (1-ethyl-3-[3-dimethylaminopropyl] carbodiimide hydrochloride/N-hydroxysulfosuccinimide, or EDC-NHS). The anti-MG1 mAb can then be coupled to the nanoparticle. (a) Illustration shows synthesis of mAb conjugated HNP, (b–d) transmission electron microscopic images show USPIO clusters measuring (b) 200 nm, (c) 200 nm, and (d) 100 nm. Graphs show size distribution measured with (e) Zetasizer and (f) absorption band of USPIO clusters and HNP.
Temperature Measurements and Cellular Viability
The strong NIR absorption of the HNPs around 798 nm induced fast photothermal heating (initial heating rate, 2.88°C/sec at 100 μg/mL) when the HNPs were irradiated with an NIR laser (808 nm; 0.47 W/cm2) for 3 minutes. Heating rates varied with the concentration of HNPs. The mean increase in temperature after laser irradiation at 0.47 W/cm2 for 3 min-utes in the control group was 6.03°C (range, 21.56°–27.59°C); in the the group with a concentration of HNP of 2.79 μmol (2.79-μmol group), 11.69°C (range, 20.59°–32.28°C); in the 5.58-μmol group, 15°C (range, 20.08°–35.08°C); in the 8.12-μmol group, 26.69°C (range, 19.93°–46.62°C); in the 10.66-μmol group, 30.55°C (range, 20.33°–50.88°C); and in the 17.76- μmol group, 36.27°C (range, 20.18°–56.45°C). The mean increase in temperature after laser irradiation at 0.94 W/cm2 for 3 minutes in the control group was 13.92°C (range, 22.53°–36.45°C); in the 2.79-μmol group, 24.24°C (range, 22.26°–46.5°C); in the 5.58-μmol group, 30.54°C (range, 21.23°–51.77°C); in the 8.12-μmol group, 50.49°C (range, 21.05°–71.54°C); inthe 10.66-μmol group, 50.72°C (range, 20.36°–71.08°C); and in the 17.76-μmol group, 62.87°C (range, 21.03°–83.9°C). Photothermal ablation of CC-531 cells showed a mean viability in the laser alone (control) group of 92% (243 viable cells of 263 total cells). HNP exposure alone showed a decrease in mean viability of 94% with 0.13-mM HNP exposure and 30% with 0.89-mM exposure. The cells treated with both HNP exposure and laser irradiation showed the greatest reductions in viability (P < .001), with 83% and 10.5% with 0.13-mM and 0.89-mM HNP exposure and irradiation, respectively, which was due to increased temperatures leading to thermal denaturation and coagulation achieved with the combined therapy.
Cellular Uptake of Nanoparticles
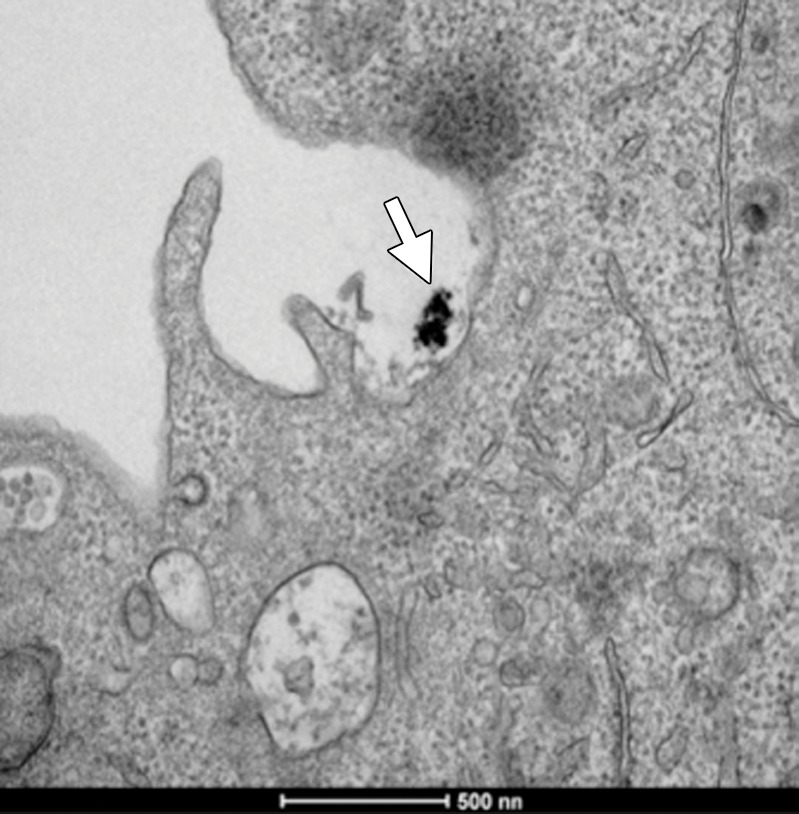
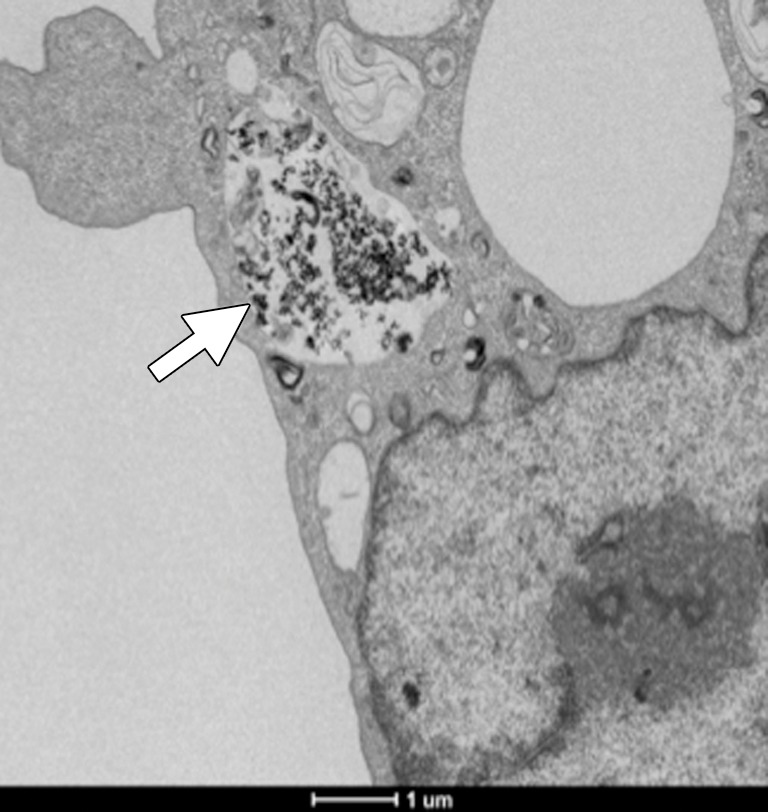
Scanning confocal microscopic results validated selective binding (Fig 2a) and demonstrated the selective uptake of anti-MG1 HNPs into the CC-531 cells. Cells incubated with HNPs alone showed no fluorescence, which indicated that HNPs were not taken up into the cells. Transmission electron microscopic results confirmed cellular uptake of HNPs coated with mAbs, while no uptake was seen for the uncoated HNPs (Fig 2b and 2c).
Figure 2a:

In vitro studies. (a) Immunofluorescence image shows CC-531 cells that were incubated with anti-MG1 mAb–conjugated HNP for 24 hours and then fixed. Immunofluorescence was performed. Image on left is CC-531 cells stained with 4ʹ,6-diamidine-2-phenylindole. Middle image shows fluorescent anti-MG1 mAb-conjugated HNP. Image on the right is coregistered and shows selective binding of anti-MG1 mAb-conjugated HNP to CC-531 (10 μm). (b) Transmission electron microscopic image shows CC-531 cells that were incubated with HNP for 24 hours and then fixed (10 μm). Images show (b) cell beginning to undergo endocytosis in cluster of anti-MG1 mAb-conjugated HNPs (arrow, 500 nm) and (c) endocytoma-containing anti-MG1 mAb-conjugated HNP (arrow, 1 μm).
Figure 2b:
In vitro studies. (a) Immunofluorescence image shows CC-531 cells that were incubated with anti-MG1 mAb–conjugated HNP for 24 hours and then fixed. Immunofluorescence was performed. Image on left is CC-531 cells stained with 4ʹ,6-diamidine-2-phenylindole. Middle image shows fluorescent anti-MG1 mAb-conjugated HNP. Image on the right is coregistered and shows selective binding of anti-MG1 mAb-conjugated HNP to CC-531 (10 μm). (b) Transmission electron microscopic image shows CC-531 cells that were incubated with HNP for 24 hours and then fixed (10 μm). Images show (b) cell beginning to undergo endocytosis in cluster of anti-MG1 mAb-conjugated HNPs (arrow, 500 nm) and (c) endocytoma-containing anti-MG1 mAb-conjugated HNP (arrow, 1 μm).
Figure 2c:
In vitro studies. (a) Immunofluorescence image shows CC-531 cells that were incubated with anti-MG1 mAb–conjugated HNP for 24 hours and then fixed. Immunofluorescence was performed. Image on left is CC-531 cells stained with 4ʹ,6-diamidine-2-phenylindole. Middle image shows fluorescent anti-MG1 mAb-conjugated HNP. Image on the right is coregistered and shows selective binding of anti-MG1 mAb-conjugated HNP to CC-531 (10 μm). (b) Transmission electron microscopic image shows CC-531 cells that were incubated with HNP for 24 hours and then fixed (10 μm). Images show (b) cell beginning to undergo endocytosis in cluster of anti-MG1 mAb-conjugated HNPs (arrow, 500 nm) and (c) endocytoma-containing anti-MG1 mAb-conjugated HNP (arrow, 1 μm).
MR Imaging
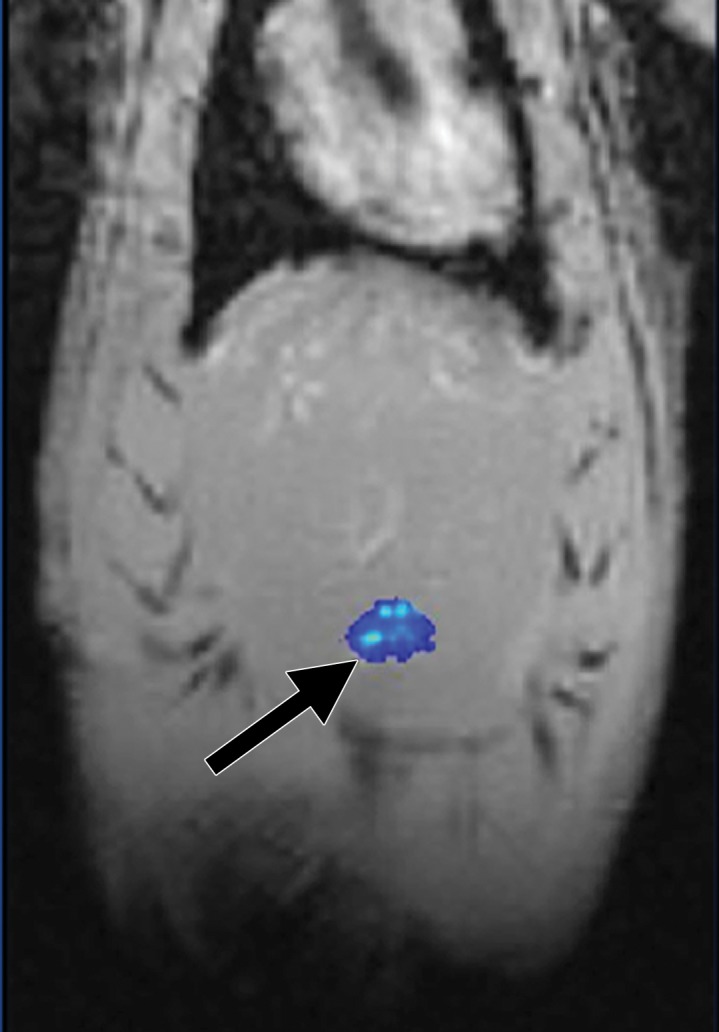
MR imaging studies showed that R2 and R2* measurements were well correlated with HNP concentrations in phantoms (R2 = 0.98 for R2 and R2 = 0.99 for R2*) (Fig 3a and 3b). Comparison of coronal R2* MR images before and 24 hours after infusion of HNPs in animals revealed a substantial signal intensity loss, seen as dark areas on the images, in both the liver and the tumor, which suggests accumulation of iron in these tissues. Overlay maps helped us to discern tumor from liver tissue and allowed quantification of iron in tumors (Fig 3c and 3d). Mean tumor T2 measurements ± standard deviation were 54.17 msec ± 10.76 and 43.4317 msec ± 11.04 for before and 24 hours after anti-MG1 HNP infusion, respectively, while the measured tumor T2* was 24.2136 msec ± 5.68 before and 17.84 msec ± 5.67 24 hours after infusion. Significant differences were found between preinfusion and 24-hour postinfusion measurements of both T2 (P = .025) and T2* (P < .001). Significant differences also existed for T2* measurements between the anti-MG1 HNP and HNP-only treatment groups (P = .034). For temperature measurements during PTA, a thermal camera was used (Fig 3e). The mean temperatures in the anti-MG1 HNP, HNP only, and control group tumor tissue were 50.2°C ± 7.8, 51°C ± 4.4, and 39.5°C ± 2.0, respectively.
Figure 3a:

R2 and R2* imaging and quantification. Wistar rats inoculated with CC-531 cells and tumors (arrow, c, d) were allowed to grow for 7–10 days. R2 and R2* images of rats were obtained with a 7.0-T MR imager at baseline and immediately after and at 24 hours after infusion. Voxel-wise R2 and R2* measurements were performed, and color map overlays were created. Plots show measurements of (a) R2 and (b) R2* and their correlation with HNP concentrations. (c) Coronal R2* baseline MR image (unit, one per second). (d) Coronal MR image shows R2* 24 hours after infusion of HNP (unit, one per second). Signal intensity loss is noted both in liver and in tumor between the time points. (e) Image of rat taken with a thermal camera during PTA while temperature measurements were being taken. ICP concen = inductively coupled plasma concentration.
Figure 3b:

R2 and R2* imaging and quantification. Wistar rats inoculated with CC-531 cells and tumors (arrow, c, d) were allowed to grow for 7–10 days. R2 and R2* images of rats were obtained with a 7.0-T MR imager at baseline and immediately after and at 24 hours after infusion. Voxel-wise R2 and R2* measurements were performed, and color map overlays were created. Plots show measurements of (a) R2 and (b) R2* and their correlation with HNP concentrations. (c) Coronal R2* baseline MR image (unit, one per second). (d) Coronal MR image shows R2* 24 hours after infusion of HNP (unit, one per second). Signal intensity loss is noted both in liver and in tumor between the time points. (e) Image of rat taken with a thermal camera during PTA while temperature measurements were being taken. ICP concen = inductively coupled plasma concentration.
Figure 3c:
R2 and R2* imaging and quantification. Wistar rats inoculated with CC-531 cells and tumors (arrow, c, d) were allowed to grow for 7–10 days. R2 and R2* images of rats were obtained with a 7.0-T MR imager at baseline and immediately after and at 24 hours after infusion. Voxel-wise R2 and R2* measurements were performed, and color map overlays were created. Plots show measurements of (a) R2 and (b) R2* and their correlation with HNP concentrations. (c) Coronal R2* baseline MR image (unit, one per second). (d) Coronal MR image shows R2* 24 hours after infusion of HNP (unit, one per second). Signal intensity loss is noted both in liver and in tumor between the time points. (e) Image of rat taken with a thermal camera during PTA while temperature measurements were being taken. ICP concen = inductively coupled plasma concentration.
Figure 3d:

R2 and R2* imaging and quantification. Wistar rats inoculated with CC-531 cells and tumors (arrow, c, d) were allowed to grow for 7–10 days. R2 and R2* images of rats were obtained with a 7.0-T MR imager at baseline and immediately after and at 24 hours after infusion. Voxel-wise R2 and R2* measurements were performed, and color map overlays were created. Plots show measurements of (a) R2 and (b) R2* and their correlation with HNP concentrations. (c) Coronal R2* baseline MR image (unit, one per second). (d) Coronal MR image shows R2* 24 hours after infusion of HNP (unit, one per second). Signal intensity loss is noted both in liver and in tumor between the time points. (e) Image of rat taken with a thermal camera during PTA while temperature measurements were being taken. ICP concen = inductively coupled plasma concentration.
Figure 3e:

R2 and R2* imaging and quantification. Wistar rats inoculated with CC-531 cells and tumors (arrow, c, d) were allowed to grow for 7–10 days. R2 and R2* images of rats were obtained with a 7.0-T MR imager at baseline and immediately after and at 24 hours after infusion. Voxel-wise R2 and R2* measurements were performed, and color map overlays were created. Plots show measurements of (a) R2 and (b) R2* and their correlation with HNP concentrations. (c) Coronal R2* baseline MR image (unit, one per second). (d) Coronal MR image shows R2* 24 hours after infusion of HNP (unit, one per second). Signal intensity loss is noted both in liver and in tumor between the time points. (e) Image of rat taken with a thermal camera during PTA while temperature measurements were being taken. ICP concen = inductively coupled plasma concentration.
Tumor Necrosis
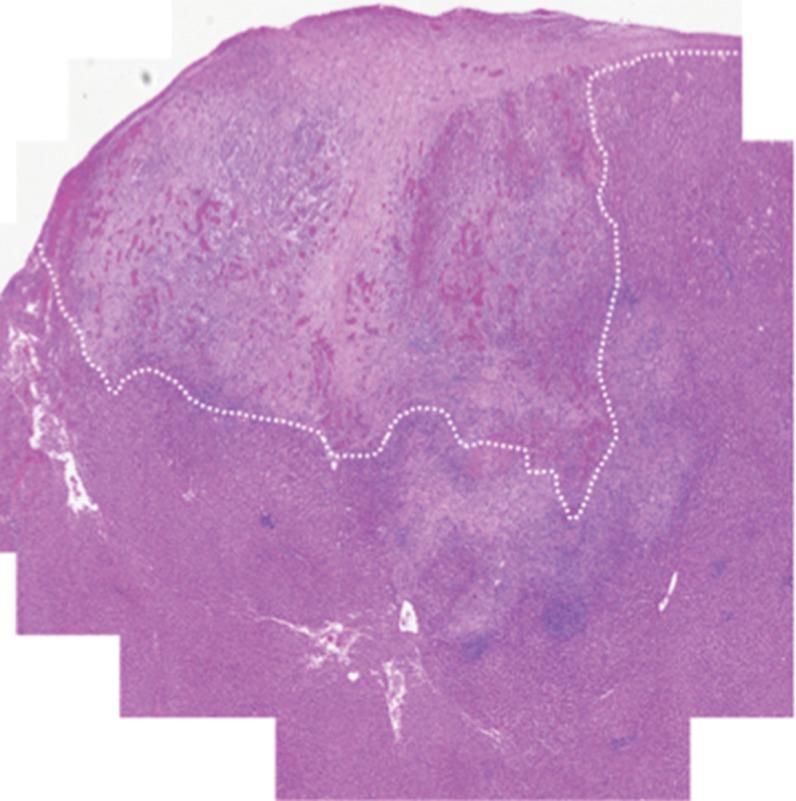
Prussian blue staining of the sections from animals infused with HNPs showed blue clusters of iron against a pink counterstain background in the tumor regions that showed accumulation of HNPs (Fig 4a and 4b). Furthermore, larger zones of tumor necrosis were seen with PTA in tumors in the anti-MG1 HNP group than those seen in tumors from the HNP-only group (Fig 4c and 4d). The mean percentages of tumor necrosis were 38% ± 29, 14% ± 17, and 7% ± 8 in the anti-MG1–coated HNP, HNP-only, and control groups, respectively (P = .043) (Fig 4e). There was no difference between the anti-MG1 HNP group and the HNP group (P = .14), or between the HNP group and the control group (P = .14).
Figure 4a:

Histologic evaluation. (a) Representative photomicrograph shows hematoxylin-eosin–stained section demonstrating large colorectal liver metastasis with densely packed tumor cells (magnification, ×20). (b) Prussian blue staining (iron stains blue) shows deposition of anti-MG1–conjugated HNP around tumor. Image in inset shows Prussian blue staining at higher magnification (×20) in tumor. Hematoxylin-eosin slides were analyzed and total tumor area (densely packed areas of liver) and area of necrosis (dashed lines) were determined for control group, (c) HNP group, and (d) mAb-conjugated HNP group (magnification, ×20). (e) Hematoxylin-eosin slides were evaluated to determine percentage of necrosis, and control, HNP (NP), and mAb-conjugated anti-MG1 HNPs were compared (P = .043).
Figure 4b:

Histologic evaluation. (a) Representative photomicrograph shows hematoxylin-eosin–stained section demonstrating large colorectal liver metastasis with densely packed tumor cells (magnification, ×20). (b) Prussian blue staining (iron stains blue) shows deposition of anti-MG1–conjugated HNP around tumor. Image in inset shows Prussian blue staining at higher magnification (×20) in tumor. Hematoxylin-eosin slides were analyzed and total tumor area (densely packed areas of liver) and area of necrosis (dashed lines) were determined for control group, (c) HNP group, and (d) mAb-conjugated HNP group (magnification, ×20). (e) Hematoxylin-eosin slides were evaluated to determine percentage of necrosis, and control, HNP (NP), and mAb-conjugated anti-MG1 HNPs were compared (P = .043).
Figure 4c:

Histologic evaluation. (a) Representative photomicrograph shows hematoxylin-eosin–stained section demonstrating large colorectal liver metastasis with densely packed tumor cells (magnification, ×20). (b) Prussian blue staining (iron stains blue) shows deposition of anti-MG1–conjugated HNP around tumor. Image in inset shows Prussian blue staining at higher magnification (×20) in tumor. Hematoxylin-eosin slides were analyzed and total tumor area (densely packed areas of liver) and area of necrosis (dashed lines) were determined for control group, (c) HNP group, and (d) mAb-conjugated HNP group (magnification, ×20). (e) Hematoxylin-eosin slides were evaluated to determine percentage of necrosis, and control, HNP (NP), and mAb-conjugated anti-MG1 HNPs were compared (P = .043).
Figure 4d:
Histologic evaluation. (a) Representative photomicrograph shows hematoxylin-eosin–stained section demonstrating large colorectal liver metastasis with densely packed tumor cells (magnification, ×20). (b) Prussian blue staining (iron stains blue) shows deposition of anti-MG1–conjugated HNP around tumor. Image in inset shows Prussian blue staining at higher magnification (×20) in tumor. Hematoxylin-eosin slides were analyzed and total tumor area (densely packed areas of liver) and area of necrosis (dashed lines) were determined for control group, (c) HNP group, and (d) mAb-conjugated HNP group (magnification, ×20). (e) Hematoxylin-eosin slides were evaluated to determine percentage of necrosis, and control, HNP (NP), and mAb-conjugated anti-MG1 HNPs were compared (P = .043).
Figure 4e:

Histologic evaluation. (a) Representative photomicrograph shows hematoxylin-eosin–stained section demonstrating large colorectal liver metastasis with densely packed tumor cells (magnification, ×20). (b) Prussian blue staining (iron stains blue) shows deposition of anti-MG1–conjugated HNP around tumor. Image in inset shows Prussian blue staining at higher magnification (×20) in tumor. Hematoxylin-eosin slides were analyzed and total tumor area (densely packed areas of liver) and area of necrosis (dashed lines) were determined for control group, (c) HNP group, and (d) mAb-conjugated HNP group (magnification, ×20). (e) Hematoxylin-eosin slides were evaluated to determine percentage of necrosis, and control, HNP (NP), and mAb-conjugated anti-MG1 HNPs were compared (P = .043).
Biodistribution
Targeted amounts of anti-MG1 HNPs in tumors were slightly higher than were HNPs without anti-MG1 at 24 hours after injection (P = .09) (Fig 5). Accumulation in the rest of the organs, including that in the liver, spleen, and kidney relating to the reticuloendothelial system showed the typical distribution (22).
Figure 5:

Graph shows biodistribution of HNP. Freshly harvested or snap frozen tissues were subjected to inductively coupled plasma mass spectrometry for gold (Au) and iron (Fe) analysis, and the amounts present in each tissue were expressed in micrograms per gram of tissue. L = tumor in the left lobe of liver, NP = nanoparticle, and R = tumor in the right lobe.
Discussion
Ablative techniques have gained wide acceptance as adjunct treatments for surgically nonresectable colorectal liver metastases, with significant survival advantages over palliative chemotherapy (30). However, only tumors smaller than 5 cm have shown durable response to the ablative techniques. Thermal ablation after intravenous plasmonic nanomaterial administration allows for larger ablation zones because of preferential accumulation in tumors due to an enhanced permeation and retention effect in in vivo (31) and ex vivo canine colorectal liver metastases (16). Because only the tumor cells harbor the nanoparticles, only the tumor cells will be affected by the light and heat up to temperatures high enough to cause cell death. The surrounding tissue, such as the blood vessels and bile ducts, will not achieve temperatures high enough for cell death, sparing them of any injury. On the other hand, hypovascular tumors and metastatic sites require additional ways of selective localization of nanomaterials to tumors. While preferential accumulation of sensitizers into tumors usually determines the outcome of PTA, the ability to perform PTA in deeper tissue is limited and often challenging to translate into a clinical environment (32). Therefore, we focused our efforts on bolstering the tumor-specific delivery of nanoparticles and on performing targeted PTA while concurrently exploring different imaging modalities. We and other groups have shown that iron oxide–based nanomaterial is suitable to monitoring targeted delivery of therapeutics in preclinical liver tumor models (33,34). Methods to engineer magnetic nanoparticles for the development of new drug and delivery platforms are under intense investigation (35). Gold nanoparticles have proven low-toxicity profiles, easy functionalization, and unique optical properties (36). Specifically, gold nanoshells offer further advantages over other gold nanoparticles on the basis of the cargo they can deliver actively and passively and the ability to tune the nanoparticles to various sizes and shapes with greater stability (37). In our study, hybrid spiky gold-shelled iron oxide nanoclusters act as catalysts for photothermal ablation. The edge and tips in the multiple branches of the gold nanoparticles allow large local electric field enhancements at the plasmon resonance, resulting in efficient transduction of incident light into heat due to electron excitation and relaxation (25). Strong NIR absorption characteristics at 800 nm for these HNPs are highly valuable for targeted NIR photothermal ablation of tumors. To achieve selective localization, MG-1 antibodies were chosen because binding efficacy study results showed that a significant portion of the antibodies conjugates to the nanomaterial, and the antibodies retain the intact antigen-binding domains.
Results of in vitro assays suggested that the anti-MG1 HNPs selectively recognize CC-531 cells. These findings reinforce the selective nature of antibody-coated HNPs to reach receptor-positive cells, as shown in a recent study (38). Furthermore, cytotoxicity of anti-MG1 HNPs was analogous to the cell viability data of different iron oxide nanoparticles in our previous study (33) or polymer-coated iron oxide nanoparticles (39) and hybrid gold-iron oxide nanoparticles reported in other studies (40). These results also support prior observations on changes in particle size, and the gold shell had minimal effect on the cytotoxicity profiles of HNPs (40). Ligand-coated nanoparticles were known to enter into cells by means of receptor-mediated endocytosis by forming endosomes and eventually lysosomes (41). Consequently, we believe that formation of endosomes exclusively in anti-MG1 HNP-treated CC-531 cells is ligand receptor mediated, and this internalization extends retention of the nanoparticles, a critical factor that determines the success of PTA. Accumulation of anti-MG1 HNPs resulted in a strong reduction in signal intensity on T2-weighted MR images, which is comparable to results of other studies (42). These observations coupled with R2 and R2* maps could be valuable in monitoring nanoparticle delivery, quantifying nanoparticles in the tumor, and potentially allowing for optimization of laser irradiation regimens based on the observed nanoparticle concentration and biodistribution.
NIR-based PTA was confined to surface tumors because of the inadequate penetration of light into biologic tissue (43). Although the biodistribution of anti-MG1 HNPs and HNPs was not significantly different, and the temperatures achieved were similar in the tumor tissues during PTA, these temperatures were measured by using an infrared camera, which monitors primarily surface temperatures. Therefore, we believe that the significant increase in tumor necrosis seen in rats treated with anti-MG1 HNPs and PTA was due to the thermal denaturation and coagulation that occurs deeper in the tissue, which was not captured by the infrared camera. The mean tumor necrosis in anti-MG1 HNP-administered rats was significantly larger, which suggests superior therapeutic efficacy. In both anti-MG1 HNP- and HNP-administered rats, the spleen retained the greatest amount of nanoparticles, as was shown in other studies (44). We believe that the HNPs retained in tissue other than tumors is cleared with time and poses minimal risk to the animals, as was reported in other studies in which iron oxide–based nanoparticles were used (44). We chose to perform PTA 24 hours after HNP infusion to mimic the clinical setting, in which patients can be treated initially with an intra-arterial therapeutic agent followed by ablation the following day. However, further preclinical long-term studies are warranted to determine therapeutic efficacy and longitudinal outcomes.
Although the specific localization of nanoparticle accumulation in tumors that we achieved is comparable to that reported in other studies, enhanced uptake is desirable. The other limitations of our study were that ours was a short-term follow-up protocol, and that MG-1 antibody is specific to rat cells and the kinetics cannot be translated to humans directly.
In conclusion, hybrid nanoparticles permitted efficient anti-MG1 coating, which facilitated the specific interaction with CC-531 cells. The synthesized anti-MG1 HNPs were noncytotoxic and showed intratumoral accumulation in vivo. PTA performed by means of a percutaneous approach showed enhanced tumor necrosis with administration of anti-MG1 HNPs. Our study results validate the proof of concept that anti-MG1 HNPs can serve to catalyze tumor ablation for minimally invasive PTA as measured on the basis of tumor necrosis.
Advances in Knowledge
■ The anti-MG1 hybrid magnetic gold nanoparticles (HNPs) are noncytotoxic and have greater than 20% intratumoral accumulation in vivo in a rat model compared with HNPs alone.
■ Photothermal ablation showed more than twofold (P = .043) enhancement in tumor response to administration of anti-MG1 HNPs.
■ The results of this study validate the proof of concept that anti-MG1 HNPs can serve to catalyze tumor response for minimally invasive photothermal ablation with large necrotic zones.
Implications for Patient Care
■ Use of multifunctional HNPs allows enhancement of current ablative technology to achieve larger necrotic areas in tumors, circumventing the current size limitations; furthermore, antibody-coupled gold nanoparticles enhance targeted accumulation and ablative capabilities, without necessitating additional probes.
Received June 28, 2016; revision requested August 31; revision received March 1, 2017; accepted March 27; final version accepted April 5.
Study supported by National Institutes of Health (R25 CA 132822-03) and the Radiological Society of North America (RSD1342).
See also Science to Practice in this isssue.
Disclosures of Conflicts of Interest: S.B.W. Activities related to the present article: disclosed no relevant relationships. Activities not related to the present article: grants from Guerbet and Siemens; personal fees from Cook, Guerbet, and IO Rad. Other relationships: disclosed no relevant relationships. D.H.K. disclosed no relevant relationships. Y.G. disclosed no relevant relationships. W.L. disclosed no relevant relationships. Y.Y. disclosed no relevant relationships. J.C. Activities related to the present article: disclosed no relevant relationships. Activities not related to the present article: grant/grant pending from the Society of Interventional Radiology. Other relationships: disclosed no relevant relationships.V.R.G. disclosed no relevant relationships. A.C.L. disclosed no relevant relationships.
Abbreviations:
- HNP
- hybrid magnetic gold nanoparticle
- mAb
- monoclonal antibody
- NIR
- near-infrared
- PTA
- photothermal ablation
References
- 1.American Cancer Society . Cancer facts & figures 2015. Atlanta, Ga: American Cancer Society, 2015. [Google Scholar]
- 2.LeGolvan MP, Resnick M. Pathobiology of colorectal cancer hepatic metastases with an emphasis on prognostic factors. J Surg Oncol 2010;102(8):898–908. [DOI] [PubMed] [Google Scholar]
- 3.Viganò L, Russolillo N, Ferrero A, Langella S, Sperti E, Capussotti L. Evolution of long-term outcome of liver resection for colorectal metastases: analysis of actual 5-year survival rates over two decades. Ann Surg Oncol 2012;19(6):2035–2044. [DOI] [PubMed] [Google Scholar]
- 4.Brouquet A, Mortenson MM, Vauthey JN, et al. Surgical strategies for synchronous colorectal liver metastases in 156 consecutive patients: classic, combined or reverse strategy? J Am Coll Surg 2010;210(6):934–941. [DOI] [PubMed] [Google Scholar]
- 5.Gillams A, Goldberg N, Ahmed M, et al. Thermal ablation of colorectal liver metastases: a position paper by an international panel of ablation experts, The Interventional Oncology Sans Frontières meeting 2013. Eur Radiol 2015;25(12):3438–3454. [DOI] [PMC free article] [PubMed] [Google Scholar]
- 6.Patra CR, Bhattacharya R, Mukhopadhyay D, Mukherjee P. Fabrication of gold nanoparticles for targeted therapy in pancreatic cancer. Adv Drug Deliv Rev 2010;62(3):346–361. [DOI] [PMC free article] [PubMed] [Google Scholar]
- 7.Singh M, Harris-Birtill DC, Markar SR, Hanna GB, Elson DS. Application of gold nanoparticles for gastrointestinal cancer theranostics: A systematic review. Nanomedicine (Lond) 2015;11(8):2083–2098. [DOI] [PubMed] [Google Scholar]
- 8.Arvizo R, Bhattacharya R, Mukherjee P. Gold nanoparticles: opportunities and challenges in nanomedicine. Expert Opin Drug Deliv 2010;7(6):753–763. [DOI] [PMC free article] [PubMed] [Google Scholar]
- 9.Lee J, Chatterjee DK, Lee MH, Krishnan S. Gold nanoparticles in breast cancer treatment: promise and potential pitfalls. Cancer Lett 2014;347(1):46–53. [DOI] [PMC free article] [PubMed] [Google Scholar]
- 10.Cho NH, Cheong TC, Min JH, et al. A multifunctional core-shell nanoparticle for dendritic cell-based cancer immunotherapy. Nat Nanotechnol 2011;6(10):675–682. [DOI] [PubMed] [Google Scholar]
- 11.Yang L, Mao H, Cao Z, et al. Molecular imaging of pancreatic cancer in an animal model using targeted multifunctional nanoparticles. Gastroenterology 2009;136(5):1514–1525.e2. [DOI] [PMC free article] [PubMed] [Google Scholar]
- 12.Park JH, von Maltzahn G, Xu MJ, et al. Cooperative nanomaterial system to sensitize, target, and treat tumors. Proc Natl Acad Sci U S A 2010;107(3):981–986. [DOI] [PMC free article] [PubMed] [Google Scholar]
- 13.Patterson AJ, Tang TY, Graves MJ, Müller KH, Gillard JH. In vivo carotid plaque MRI using quantitative T2* measurements with ultrasmall superparamagnetic iron oxide particles: a dose-response study to statin therapy. NMR Biomed 2011;24(1):89–95. [DOI] [PubMed] [Google Scholar]
- 14.Oude Engberink RD, van der Pol SM, Döpp EA, de Vries HE, Blezer EL. Comparison of SPIO and USPIO for in vitro labeling of human monocytes: MR detection and cell function. Radiology 2007;243(2):467–474. [DOI] [PubMed] [Google Scholar]
- 15.Jain PK, Huang X, El-Sayed IH, El-Sayed MA. Noble metals on the nanoscale: optical and photothermal properties and some applications in imaging, sensing, biology, and medicine. Acc Chem Res 2008;41(12):1578–1586. [DOI] [PubMed] [Google Scholar]
- 16.Elliott AM, Shetty AM, Wang J, Hazle JD, Jason Stafford R. Use of gold nanoshells to constrain and enhance laser thermal therapy of metastatic liver tumours. Int J Hyperthermia 2010;26(5):434–440. [DOI] [PubMed] [Google Scholar]
- 17.Germer CT, Roggan A, Ritz JP, et al. Optical properties of native and coagulated human liver tissue and liver metastases in the near infrared range. Lasers Surg Med 1998;23(4):194–203. [DOI] [PubMed] [Google Scholar]
- 18.Ritz JP, Roggan A, Germer CT, Isbert C, Müller G, Buhr HJ. Continuous changes in the optical properties of liver tissue during laser-induced interstitial thermotherapy. Lasers Surg Med 2001;28(4):307–312. [DOI] [PubMed] [Google Scholar]
- 19.Arienti V, Pretolani S, Pacella CM, et al. Complications of laser ablation for hepatocellular carcinoma: a multicenter study. Radiology 2008;246(3):947–955. [DOI] [PubMed] [Google Scholar]
- 20.Enrique MA, Mariana OR, Mirshojaei SF, Ahmadi A. Multifunctional radiolabeled nanoparticles: strategies and novel classification of radiopharmaceuticals for cancer treatment. J Drug Target 2015;23(3):191–201. [DOI] [PubMed] [Google Scholar]
- 21.Hagenaars M, Koelemij R, Ensink NG, et al. The development of novel mouse monoclonal antibodies against the CC531 rat colon adenocarcinoma. Clin Exp Metastasis 2000;18(4):281–289. [DOI] [PubMed] [Google Scholar]
- 22.Kim DH, Guo Y, Zhang Z, et al. Temperature-sensitive magnetic drug carriers for concurrent gemcitabine chemohyperthermia. Adv Healthc Mater 2014;3(5):714–724. [DOI] [PMC free article] [PubMed] [Google Scholar]
- 23.Sanchez-Gaytan BL, Park SJ. Spiky gold nanoshells. Langmuir 2010;26(24):19170–19174. [DOI] [PubMed] [Google Scholar]
- 24.Kim DH, Chen J, Omary RA, Larson AC. MRI visible drug eluting magnetic microspheres for transcatheter intra-arterial delivery to liver tumors. Theranostics 2015;5(5):477–488. [DOI] [PMC free article] [PubMed] [Google Scholar]
- 25.Kim DH, Larson AC. Deoxycholate bile acid directed synthesis of branched Au nanostructures for near infrared photothermal ablation. Biomaterials 2015;56:154–164. [DOI] [PMC free article] [PubMed] [Google Scholar]
- 26.Jiang K, Smith DA, Pinchuk A. Size-dependent photothermal conversion efficiencies of plasmonically heated gold nanoparticles. J Phys Chem C 2013;117(51):27073–27080. [Google Scholar]
- 27.Pattani VP, Tunnell JW. Nanoparticle-mediated photothermal therapy: a comparative study of heating for different particle types. Lasers Surg Med 2012;44(8):675–684. [DOI] [PMC free article] [PubMed] [Google Scholar]
- 28.Zhao K, Cho S, Procissi D, Larson AC, Kim DH. Non-invasive monitoring of branched Au nanoparticle-mediated photothermal ablation. J Biomed Mater Res B Appl Biomater 2016 Aug 13. [Epub ahead of print] [DOI] [PMC free article] [PubMed] [Google Scholar]
- 29.Guo Y, Klein R, Omary RA, Yang GY, Larson AC. Highly malignant intra-hepatic metastatic hepatocellular carcinoma in rats. Am J Transl Res 2010;3(1):114–120. [PMC free article] [PubMed] [Google Scholar]
- 30.Pathak S, Jones R, Tang JM, et al. Ablative therapies for colorectal liver metastases: a systematic review. Colorectal Dis 2011;13(9):e252–e265. [DOI] [PubMed] [Google Scholar]
- 31.Schroeder A, Heller DA, Winslow MM, et al. Treating metastatic cancer with nanotechnology. Nat Rev Cancer 2011;12(1):39–50. [DOI] [PubMed] [Google Scholar]
- 32.Zou L, Wang H, He B, et al. Current approaches of photothermal therapy in treating cancer metastasis with nanotherapeutics. Theranostics 2016;6(6):762–772. [DOI] [PMC free article] [PubMed] [Google Scholar]
- 33.Jeon MJ, Gordon AC, Larson AC, Chung JW, Kim YI, Kim DH. Transcatheter intra-arterial infusion of doxorubicin loaded porous magnetic nano-clusters with iodinated oil for the treatment of liver cancer. Biomaterials 2016;88:25–33. [DOI] [PMC free article] [PubMed] [Google Scholar]
- 34.Yu SS, Scherer RL, Ortega RA, et al. Enzymatic- and temperature-sensitive controlled release of ultrasmall superparamagnetic iron oxides (USPIOs). J Nanobiotechnology 2011;9:7. [DOI] [PMC free article] [PubMed] [Google Scholar]
- 35.Huang J, Zhong X, Wang L, Yang L, Mao H. Improving the magnetic resonance imaging contrast and detection methods with engineered magnetic nanoparticles. Theranostics 2012;2(1):86–102. [DOI] [PMC free article] [PubMed] [Google Scholar]
- 36.Kodiha M, Wang YM, Hutter E, Maysinger D, Stochaj U. Off to the organelles - killing cancer cells with targeted gold nanoparticles. Theranostics 2015;5(4):357–370. [DOI] [PMC free article] [PubMed] [Google Scholar]
- 37.Zhao J, Wallace M, Melancon MP. Cancer theranostics with gold nanoshells. Nanomedicine (Lond) 2014;9(13):2041–2057. [DOI] [PubMed] [Google Scholar]
- 38.Tarin C, Carril M, Martin-Ventura JL, et al. Targeted gold-coated iron oxide nanoparticles for CD163 detection in atherosclerosis by MRI. Sci Rep 2015;5:17135. [DOI] [PMC free article] [PubMed] [Google Scholar]
- 39.Schweiger C, Pietzonka C, Heverhagen J, Kissel T. Novel magnetic iron oxide nanoparticles coated with poly(ethylene imine)-g-poly(ethylene glycol) for potential biomedical application: synthesis, stability, cytotoxicity and MR imaging. Int J Pharm 2011;408(1-2):130–137. [DOI] [PubMed] [Google Scholar]
- 40.Hoskins C, Min Y, Gueorguieva M, et al. Hybrid gold-iron oxide nanoparticles as a multifunctional platform for biomedical application. J Nanobiotechnology 2012;10:27. [DOI] [PMC free article] [PubMed] [Google Scholar]
- 41.Davis ME, Zuckerman JE, Choi CH, et al. Evidence of RNAi in humans from systemically administered siRNA via targeted nanoparticles. Nature 2010;464(7291):1067–1070. [DOI] [PMC free article] [PubMed] [Google Scholar]
- 42.Ahmad T, Bae H, Rhee I, Chang Y, Jin SU, Hong S. Gold-coated iron oxide nanoparticles as a T2 contrast agent in magnetic resonance imaging. J Nanosci Nanotechnol 2012;12(7):5132–5137. [DOI] [PubMed] [Google Scholar]
- 43.Keereweer S, Van Driel PB, Snoeks TJ, et al. Optical image-guided cancer surgery: challenges and limitations. Clin Cancer Res 2013;19(14):3745–3754. [DOI] [PubMed] [Google Scholar]
- 44.Tate JA, Petryk AA, Giustini AJ, Hoopes PJ. In vivo biodistribution of iron oxide nanoparticles: an overview. Proc SPIE Int Soc Opt Eng 2011;7901:790117. [DOI] [PMC free article] [PubMed] [Google Scholar]