Abstract
Background
To identify asthma clinical phenotypes using cluster analysis and improve our understanding of heterogeneity in asthma.
Methods
Clustering approaches were applied to 203 patients who were diagnosed with asthma in XinHua Hospital (January 2012 to December 2015). One hundred and twenty patients underwent multi-slice spiral computed tomography (MSCT) examination and 30 underwent bronchial mucosal biopsy for evaluation of airway remodeling and airway inflammation among the phenotypes.
Results
Four groups were identified. Patients in cluster 1 (n=52) had early onset atopic asthma and patients in cluster 2 (n=65) had small airway obstruction and atopic asthma. Cluster 3 (n=52) was a unique group of patients with late-onset and non-atopic asthma. Patients in cluster 4 (n=34) had severe airflow obstruction and obvious airway remodeling as observed on MSCT (P<0.05). According to the immunohistochemistry of IL-5 and IL-17 (P<0.05), the results of clusters 1 and 2 may be attributable to the Th2 immune response, whereas those of clusters 3 and 4 to the Th17 immune response.
Conclusions
Four distinct clinical phenotypes of asthma were identified by cluster analysis. The results of the MSCT and pathological examinations may suggest specific pathogeneses among the phenotypes.
Keywords: Asthma, cluster analysis, clinical phenotype, multi-slice spiral computed tomography (MSCT), bronchial mucosal biopsy
Introduction
Bronchial asthma is a serious global health problem affecting all age groups, and it imposes an unacceptable burden on medical systems. Asthma is a heterogeneous disease (1-3) characterized by nonspecific airway hyperresponsiveness, airway inflammation, wheezing, shortness of breath, chest tightness, and/or cough, and variable expiratory airflow limitations. In 2009, the Global Initiative for Asthma (GINA) first proposed the concept of asthma phenotype and suggested that the classification of phenotypes would benefit the treatment and prognosis of asthma (4). Recognizable clusters of demographic, clinical, and/or pathophysiological characteristics are called “asthma phenotypes” (5-7). Clinical phenotypes can help identify the severity of asthma and set an individual and specific treatment plan. However, no strong relationship has been found between pathological features and particular clinical patterns or treatment responses (1). More research is needed to understand the clinical utility of phenotypic classification in asthma. Furthermore, the study of asthma phenotypes in China is relatively rare. Thus, this study consisted of two parts: in the first part, we used cluster analysis to identify the clinical phenotypes of moderate-severe asthma; in the second part, we aimed to find the differences in airway remodeling and airway inflammation between phenotypes by multi-slice spiral computed tomography (MSCT) and pathological examination.
Methods
Patients
First, we considered the participants who were hospitalized because of an exacerbation of asthma in XinHua Hospital, which is affiliated to Shanghai Jiao Tong University School of Medicine, from January 2012 to December 2015 (inclusion and exclusion criteria are shown in Table 1). Among them, we selected the participants who met the criteria for moderate to severe asthma according to the Guidelines for Asthma Prevention and Treatment (8) established by the Respiratory Branch of the Chinese Medicine Academy (Table 2).
Table 1. Inclusion and exclusion criteria for participants.
| Inclusion criteria |
| Asthma diagnosed according to GINA (1) |
| Aged 12–80 years |
| Exclusion criteria |
| Patients with severe cardiac, hepatic, renal, or other organ dysfunction |
| Patients with other lung diseases (bronchiolitis obliterans, tracheobronchial foreign body, allergic bronchopulmonary aspergillosis, bronchiectasis, pulmonary embolism, tuberculosis, etc.) |
| Pregnant or lactating women |
| History of taking regular corticosteroids or other immunosuppressive agents for other diseases |
| Patients who cannot provide prior informed consent or delayed informed consent |
GINA, Global Initiative for Asthma.
Table 2. Classification of asthma severity.
| Classification | Clinical characteristics |
|---|---|
| Intermittent state (level 1) | Uncontrolled asthma symptoms < once a week |
| Symptoms appear transiently | |
| Asthma symptoms at night ≤ twice a month | |
| FEV1 ≥80% pred or PEF ≥80% personal best value, PEF or FEV1 variability <20% | |
| Mild persistent (level 2) | Uncontrolled asthma symptoms ≥ once a week, but < once a day |
| Symptoms may affect activity and sleep | |
| Asthma symptoms at night > twice a month, but < once a week | |
| FEV1 ≥80% pred or PEF ≥80% personal best value, PEF or FEV1 variability 20–30% | |
| Moderate persistent (level 3) | Uncontrolled asthma symptoms appear daily |
| Symptoms affect activity and sleep | |
| Asthma symptoms at night ≥ once a week | |
| FEV1 60–79% pred or PEF 60–79% personal best value, PEF or FEV1 variability >30% | |
| Severe persistent (level 4) | Uncontrolled asthma symptoms appear multiple times per day |
| Limited physical activity | |
| Asthma symptoms multiple times per week | |
| FEV1 <60% pred or PEF <60%personal best value, PEF or FEV1 variability >30% |
FEV1, forced expiratory volume in the first second; PEF, peak expiratory flow.
In the end, 203 participants were included in this study. Among those, 120 patients underwent MSCT examination and 30 underwent bronchial mucosal biopsy. The study was approved by the ethics committee of XinHua Hospital and was awarded a registration number from the Chinese Clinical Trial Registry, available on the World Health Organization International Clinical Trial Registration Platform.
Clinical data collection
Clinical data included six parts: general information (name, sex, date of birth, age of onset, family history, smoking history, complications); questionnaires (Asthma Control Test and Asthma Control Questionnaire); laboratory tests (routine blood test, blood eosinophil count, immunoglobulin E (IgE), arterial blood gas, and allergen detection); pulmonary function tests; disease condition in the past year (the frequency of acute exacerbations, health care utilization); and medication use.
MSCT scans and analysis
We measured airway dimensions with MSCT, which was performed using a 64-slice spiral CT scanner (Siemens, Germany) at full inspiration. Images were obtained at 120 kVp and 120 mAs. The exposure time was 1 s, and the matrix size was 512×512 pixels. Images were contiguously reconstructed with a slice thickness of 1 mm and a slice interval of 5 mm. All scanning data were transferred to an advantage workstation for reconstruction and were reviewed at a magnification of 5× with a window width of 1,500 HU and a window level of −500 HU on the workstation monitor. Wall thickness (T, mm), bronchus external diameter (D, mm), bronchus inner diameter (Din, mm), T/D, bronchus inside area (Ai, mm2), bronchus outside area (Ao, mm2), bronchus wall area (WA, mm2), and percentage of wall area (WA%, %) were collected in the apical segmental bronchus of the right upper lobe (RB1) and its subsegmental bronchi (Figure S1).
Figure S1.
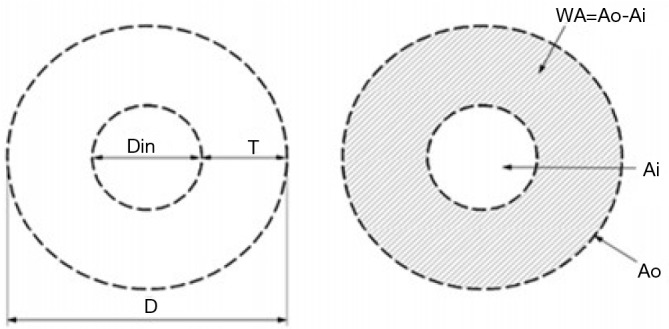
Airway measurement. T, wall thickness; D, bronchus external diameter; Din, bronchus inner diameter; Ai, bronchus inside area; Ao, bronchus outside area; WA, bronchus wall area; WA%, percentage of wall area.
Biopsy and analysis
Fiberoptic bronchoscopy and mucosal biopsy were performed on 30 patients. Between two and four forceps biopsies were acquired from the segmental and subsegmental bronchi of the upper lobe or the middle lobe. Mucosal biopsy tissue was fixed in formalin and sent to the pathology department to perform hematoxylin and eosin (HE) staining and immunohistochemistry of IL-5, IL-17, and TGF-β.
The thickness of the basement membrane (BM) was examined on sections stained with HE, and then assessed by taking measurements at 50-µm intervals along the entire BM length by using Image-Pro Plus 6.0 (IPP 6.0, Media Cybernetics, Silver Spring, MD).
In order to quantify the extent of epithelial injury and perform semi-quantitative analyses, the entire length of the BM and the length of the BM covered by damaged epithelium were also measured with IPP 6.0. The damaged epithelium included partial epithelial shedding and complete epithelial shedding. The results were expressed as a percentage of the length of BM covered by damaged epithelium and the entire length of the BM.
The number of eosinophils infiltrating the mucosa was also examined on sections with HE staining.
For semi-quantitative immunohistochemistry, areas of positive staining and integrated optical density (IOD) were acquired with IPP 6.0, and the results are expressed as the mean density (mean density = IOD/area).To minimize tissue injury during biopsy and staining, all bronchoscopies, types of biopsy forceps, and the methods of staining were performed according to the same protocols.
Statistical analysis
Data preprocessing and variable selection
SPSS was used for statistical analysis. EOS and IgE were found to be highly right-skewed; to normalize them, a base 10 logarithm was applied. The entire clinical dataset provided 112 variables that required reduction in number prior to cluster analysis. Variables were excluded if they were presented in text format. Some variables were considered to be too subjective for use in the clustering model, e.g., questionnaires; therefore, they were also excluded to reduce the bias of cluster analysis. Because of the inherent strong correlation and clinical redundancy between some variables, such as pulmonary function tests, we selected several more important variables to reflect certain physiologic parameters. Finally, 21 variables were chosen (Table S1). These variables were selected to cover a broad range of routine assessments including demographic data, severity of asthma, and important physiologic measures (9-12).
Table S1. Variables used in cluster analysis.
| Demographic data |
|---|
| Sex, age, age at onset, asthma duration, BMI, smoking index, family history |
| Disease severity and risk |
| Respiratory failure, COPD |
| Lab tests |
| IgE, EOS, allergen detection |
| Lung function |
| FVC% pred, FEV1% pred, FEV1/FVC, post FVC% pred, post FEV1% pred, post FEV1/FVC, change in FEV1 |
| Medicine use |
| ICS (high-dose, moderate-dose, low-dose, no use) |
| Health care utilization in the past year |
| Health care utilization in the past year (hospitalization, emergency, outpatient department, no use) |
BMI, body mass index; EOS, eosinophil count; COPD, chronic obstructive pulmonary diseases; FVC% pred, forced vital capacity% predicted; FEV1% pred, forced expiratory volume in the first second% predicted; FEV1/FVC, ratio of forced expiratory volume in the first second to forced vital capacity.
Cluster analysis
A two-step cluster analysis was performed to classify patients. The first step was the formation of pre-clusters to reduce the size of the matrix that contained the distances between all possible pairs of cases. In the second step, the standard hierarchical clustering algorithm was applied to the pre-clusters to explore a range of solutions with different numbers of clusters. At each generation of clusters, samples were merged into larger clusters to minimize the within-cluster sum of squares or to maximize the between cluster sum of squares.
To compare differences between clusters, analysis of variance, the Kruskal-Wallis test, and chi-squared tests were used for parametric continuous, nonparametric continuous and categorical variables, respectively. P<0.05 was considered statistically significant.
Results
Cluster analysis
Data from 203 participants were analyzed. The population was 50.7% male and had a mean (SD) age of 50.1 (17.3) years, a mean age at onset of 35 (21.9) years, and a mean duration of asthma of 15.1 (18.2) years. In total, 61 patients (30%) had a history of smoking, with a mean (SD) index of 191 [443] per year, and 105 patients (51.7%) had positive results for allergens (Table S2).
Table S2. General information of patients.
| Variable | Count (%) or mean [SD] or median [IOR] |
|---|---|
| Sex (male) | 103 (50.7%) |
| Age (years) | 55 [34–63] |
| Age of onset (years) | 36 [12–53] |
| Asthma duration (years) | 6 [1–25] |
| BMI | 24.1 [4.1] |
| Smoking index | 191.0 [443.0] |
| Positive results of allergens | 105 (51.7%) |
| Lg-EOS | 2.0 [0.6] |
| Lg-IgE | 2.3 [0.6] |
| ICS | |
| High-dose | 41 (20.2%) |
| Moderate-dose | 88 (43.3%) |
| Low-dose | 52 (25.6%) |
| No use | 22 (10.8%) |
| Health care utilization in the past year | |
| Hospitalized for asthma | 18 (8.9%) |
| Emergency for asthma | 37 (18.2%) |
| Outpatient | 87 (42.9%) |
| None | 61 (30.0%) |
Data are presented as count (%) or mean (SD) or median (IOR). BMI, body mass index; ICS, inhaled corticosteroids.
Four clusters were identified, and they differed significantly in terms of demographic data, atopy, lung function, medicine use, and other parameters (P<0.001) (Tables S3-S6).
Table S3. Demographic data and characteristics of patients.
| Variables | Cluster 1 | Cluster 2 | Cluster 3 | Cluster 4 | Total | P |
|---|---|---|---|---|---|---|
| Number of patients [%] | 52 [26] | 65 [32] | 52 [26] | 34 [16] | 203 [100] | – |
| Sex (male, %) | 17 (32.7) | 64 (98.5) | 0 (0.0) | 22 (64.7) | 103 (50.7) | <0.001 |
| Age [years] | 39.5 [28–54.5] | 51 [30.5–60.5] | 59.5 [53–65.7] | 60.5 [54–65.2] | 55 [34–63] | <0.001 |
| Age at onset [years] | 15 [6–33.7] | 36 [9.5–53.5] | 55 [41.2–63.7] | 28.5 [13.5–49] | 36 [12–53] | <0.001 |
| Asthma duration [years] | 10.5 [2–31.5] | 4 [1–20] | 2 [1–5] | 30 [10–40] | 6 [1–25] | <0.001 |
| BMI [>28 kg/m2, %] | 10 [19.2] | 8 [12.3] | 13 [25] | 1 [2.9] | 32 [15.8] | <0.05 |
| Family history (%) | 13 (25.0) | 6 (9.2) | 9 (17.3) | 9 (26.5) | 37 (18.2) | <0.001 |
| Smoking history (%) | ||||||
| Non-smoker | 46 (88.5) | 33 (50.8) | 48 (92.3) | 16 (47.1) | 143 (70.4) | <0.05 |
| Smoker | 6 (11.5) | 32 (49.2) | 4 (7.7) | 18 (32.9) | 60 (29.6) | |
| Smoking index | 31.0 (105.0) | 326.0 (521.0) | 29.0 (146.0) | 424.0 (673.0) | 191.0 (443.0) | <0.001 |
| Sinus disease (%) | 36 (69.2) | 28 (43.1) | 17 (32.7) | 9 (26.5) | 9 (44.3) | <0.001 |
Data are presented as count (%) or mean (SD) or median (IOR). P value from one-way ANOVA, chi-squared test, and Nonparametric test (Kruskal-Wallis) among the four clusters. BMI, body mass index.
Table S4. Atopy status of patients.
| Variables | Cluster 1 | Cluster 2 | Cluster 3 | Cluster 4 | Total | P |
|---|---|---|---|---|---|---|
| EOS | 1.9 (0.5) | 2.2 (0.6) | 2.0 (0.6) | 1.8 (0.5) | 2.0 (0.6) | <0.05 |
| IgE | 2.6 (0.5) | 2.4 (0.6) | 2.0 (0.7) | 2.2 (0.6) | 2.3 (0.6) | <0.001 |
| Positive atopy status (%) | 51 (98.1) | 24 (37.0) | 13 (25.0) | 17 (50.0) | 91 (51.7) | <0.001 |
Data are presented as the mean (SD) or count (%). P value from one-way ANOVA and chi-squared test of continuous and categorical variables among the four clusters. Base 10 logarithm was applied to EOS and IgE. EOS, eosinophil count.
Table S5. Pulmonary function tests of patients.
| Variables | Cluster 1 | Cluster 2 | Cluster 3 | Cluster 4 | Total | P |
|---|---|---|---|---|---|---|
| FVC% pred | 81.5 (16.2) | 83.6 (14.7) | 80.9 (18.6) | 62.5 (14.3) | 78.9 (17.6) | <0.001 |
| FEV1% pred | 68.6 (17.9) | 65.6 (17.0) | 71.6 (19.8) | 39.2 (14.3) | 63.5 (20.7) | <0.001 |
| FEV1/FVC | 71.3 (12.0) | 63.5 (11.0) | 73.0 (9.4) | 50.3 (13.6) | 65.7 (13.8) | <0.001 |
| MMEF% pred | 44.8 (22.5) | 39 (18.5) | 45.3 (26.0) | 18.6 (16.1) | 38.8 (23.1) | <0.001 |
| MEF25%% pred | 40.4 (25.5–58.3) | 32.8 (23.4–48.7) | 43.8 (28.4–59.9) | 16.5 (13.4–24.7) | 34.2 (22.9–50.6) | <0.001 |
| MEF50%% pred | 44.6 (22.3) | 39.1 (19.7) | 44.1 (25.0) | 17.9 (17.2) | 38.3 (23.3) | <0.001 |
| MEF75%% pred | 51.5 (21.4) | 44.4 (21.2) | 53.3 (22.2) | 20.6 (16.9) | 44.5 (23.6) | <0.001 |
| RV/TLC | 44.2 (10.7) | 45.2 (9.9) | 49.3 (10.0) | 55.2 (10.0) | 47.7 (10.8) | <0.001 |
| R4-R24 | 0.49 (0.24–1.03) | 0.74 (0.36–1.21) | 0.78 (0.25–1.29) | 1.39 (0.65–1.93) | 0.76 (0.33–1.36) | <0.05 |
| FeNO | 24.2 (14.2–43.1) | 26 (15–67.2) | 18.3 (14–57.1) | 24 (9.6–41) | 23.5 (14–50.7) | 0.545 |
| Post FEV1% pred | 73.8 (17.9) | 74.8 (19.0) | 79.4 (20.2) | 44.0 (14.9) | 70.6 (22.0) | <0.001 |
| Post FVC% pred | 86.0 (16.1) | 90.0 (15.8) | 87.3 (18.4) | 69.7 (14.6) | 84.9 (17.7) | <0.001 |
| Post FEV1/FVC | 72.6 (12.7) | 65.6 (13.8) | 75.4 (8.8) | 48.8 (16.0) | 67.1(15.6) | <0.001 |
| Change in FEV1 (L) | 0.12 (0.04–0.27) | 0.26 (0.08–0.41) | 0.13 (0.04–0.25) | 0.13 (0.05–0.21) | 0.16 (0.06–0.29) | <0.05 |
Data are presented as the mean (SD) or median (IOR). P value from one-way ANOVA and nonparametric test (Kruskal-Wallis) among the four clusters. FVC% pred, forced vital capacity% predicted; FEV1% pred, forced expiratory volume in the first second% predicted; FEV1/FVC, ratio of forced expiratory volume in the first second to forced vital capacity; RV, residual volume; TLC, total lung capacity; MMEF% pred, maximal mid-expiratory flow% predicted; MEF25%, maximal expiratory flow in 25% vital capacity; MEF50%, maximal expiratory flow in 50% vital capacity; MEF75%, maximal expiratory flow in 75% vital capacity; FeNO, fraction of expired nitric oxide.
Table S6. Disease severity of patients.
| Variables (%) | Cluster 1 | Cluster 2 | Cluster 3 | Cluster 4 | Total | P |
|---|---|---|---|---|---|---|
| Respiratory failure | 0 (0.0) | 2 (3.1) | 2 (3.8) | 15 (44.1) | 19 (9.4) | <0.001 |
| ICU | 4 (7.7) | 5 (7.7) | 4 (7.7) | 15 (44.1) | 28 (13.8) | <0.001 |
| Health care utilization in the past year | ||||||
| Hospitalization | 2 (3.8) | 1 (1.5) | 8 (15.4) | 7 (20.6) | 18 (8.9) | <0.001 |
| Emergency | 11 (21.2) | 5 (7.7) | 9 (17.3) | 12 (35.3) | 37 (18.2) | |
| Outpatient | 31 (59.6) | 27 (41.5) | 16 (30.8) | 13 (38.2) | 87 (42.9) | |
| None | 8 (15.4) | 32 (49.2) | 19 (36.5) | 2 (5.9) | 61 (30.0) | |
| ICS | ||||||
| High-dose | 0 (0.0) | 7 (10.7) | 3 (5.8) | 31 (91.2) | 41 (20.2) | <0.001 |
| Moderate-dose | 38 (73.1) | 24 (36.9) | 24 (46.2) | 2 (5.9) | 88 (43.3) | |
| Low-dose | 7 (13.5) | 24 (36.9) | 20 (38.5) | 1 (2.9) | 52 (25.6) | |
| No use | 7 (13.5) | 10 (15.4) | 5 (9.6) | 0 (0.0) | 22 (10.8) | |
| Medication use | ||||||
| No ICS | 7 (13.5) | 10 (15.4) | 5 (9.6) | 0 (0.0) | 22 (10.8) | <0.001 |
| ICS + LABA | 44 (84.6) | 49 (75.4) | 42 (80.8) | 18 (52.9) | 153 (75.4) | |
| ICS + LABA + LAMA | 1 (1.9) | 6 (9.2) | 3 (5.8) | 5 (14.7) | 15 (7.4) | |
| Oral or systemic CS | 0 (0.0) | 0 (0.0) | 2 (3.8) | 11 (32.4) | 13 (6.4) |
Data are presented as count (%). P value from chi-squared test of categorical variables between the four clusters. ICU, intensive care unit; ICS, inhaled corticosteroids; LABA, long-acting β-agonists; CS, corticosteroids; LAMA, long-acting muscarinic antagonist.
Cluster 1: early-onset atopic asthma
In total, 26% of patients (n=52) were grouped into cluster 1. This cluster was characterized by younger age, childhood onset, atopic asthma, and near normal lung function. Positive atopy status and serum IgE level were higher in this phenotype than in the others. Few patients had a need for hospitalization or emergency department visits in the past year. Patients in this cluster were sensitive to corticosteroid therapy, and low-moderate doses of inhaled corticosteroids (ICS) could effectively control the disease.
Cluster 2: moderate atopic asthma
Cluster 2 was the most populous (n=65; 32% of patients). Positive atopy status and serum IgE level were slightly elevated but were not as high as those observed in cluster 1. According to the pulmonary function tests, the patients in this group had small airway obstruction. Patients in this cluster were also sensitive to corticosteroid therapy; only a small number of patients (9%) needed a high dose of ICS.
Cluster 3: late-onset and non-atopic asthma
A total of 26% of patients (n=52) were grouped into cluster 3. This cluster was markedly different from the other clusters and consisted mainly of older women (mean age, 58.2 years) with a high body mass index (BMI) (25% with BMI >28 kg/m2) and late-onset asthma (mean age of onset, 52.4 years), who were less likely to have atopic asthma. Patients in cluster 3 had poor control of the disease in the past year and had a poor response to corticosteroid therapy.
Cluster 4: asthma with fixed airflow limitation
Cluster 4 was the least populous (n=34; 16% of patients). It was characterized by a long duration of disease (mean duration age, 29.4 years) and fixed airflow limitation according to the pulmonary function tests. A total of 91.2% of patients needed to inhale high doses of corticosteroids, and 32.4% of patients required treatment with oral corticosteroid bursts.
MSCT
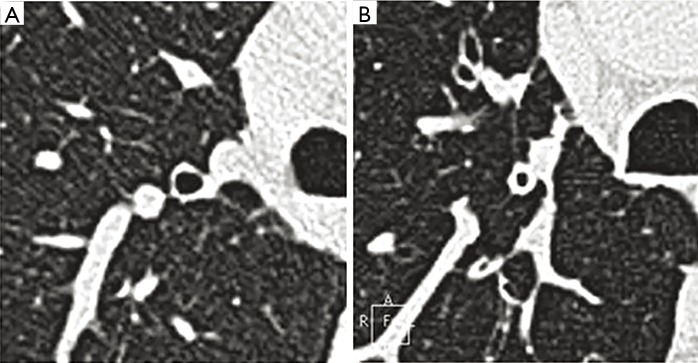
In total, 120 patients underwent MSCT; 38 cases were in cluster 1, 43 cases in cluster 2, 27 cases in cluster 3, and 12 cases in cluster 4. We found that wall thickness (T), bronchial wall thickness/bronchial wall diameter (T/D), bronchial wall area percentage (WA%), and bronchial inner diameter (Din) showed significant differences among the four clusters (P<0.05) (Table 3). Cluster 1 had the lightest degree of airway remodeling and cluster 4 had the heaviest degree, whereas clusters 2 and 3 were similar in airway remodeling. Airway wall thickening and a decrease in ventilation area were the main features of airway remodeling (Figure 1).
Table 3. Airway measurement of RB1 and its subsegmental bronchi.
| Variables | Mean (SD)/median (IQR) | P | |||||
|---|---|---|---|---|---|---|---|
| Cluster 1 (n=38) | Cluster 2 (n=43) | Cluster 3 (n=27) | Cluster 4 (n=12) | Total (n=120) | |||
| RB1 | D (mm) | 7.1 (1.2) | 7.2 (1.0) | 6.8 (0.8) | 6.8 (1.2) | 7.1 (1.1) | 0.297 |
| Din (mm) | 4 (0.9) | 4 (0.9) | 3.9 (0.7) | 3.3 (0.8) | 3.9 (0.9) | 0.083 | |
| T (mm) | 1.6 (0.3) | 1.6 (0.3) | 1.4 (0.3) | 1.7 (0.3) | 1.6 (0.3) | <0.05 | |
| T/D | 0.219 (0.0) | 0.224 (0.0) | 0.211 (0.0) | 0.258 (0.0) | 0.223 (0.0) | <0.05 | |
| WA (mm2) | 30.3 (8.1) | 31.4 (7.6) | 27.5 (6.5) | 30.2 (11.8) | 30.1 (8.1) | 0.259 | |
| WA% | 0.7 (0.1) | 0.7 (0.1) | 0.7 (0.1) | 0.8 (0.1) | 0.7 (0.1) | <0.05 | |
| Subsegmental bronchi of RB1 | D (mm) | 5.3 (1.0) | 5.6 (0.7) | 5.2 (0.7) | 5.1 (0.9) | 5.3 (0.8) | 0.149 |
| Din (mm) | 2.7 (0.7) | 2.7 (0.8) | 2.6 (0.6) | 2.1 (0.5) | 2.6 (0.7) | <0.05 | |
| T (mm) | 1.3 (0.2) | 1.5 (0.2) | 1.3 (0.2) | 1.5 (0.4) | 1.4 (0.3) | <0.05 | |
| T/D | 0.247 (0.0) | 0.265 (0.0) | 0.253 (0.0) | 0.295 (0.0) | 0.26 (0.0) | <0.05 | |
| WA (mm2£© | 18.0 (14.9–20.9) | 20.7 (18.4–22.4) | 18.6 (15.8–20.8) | 16.5 (14.1–25.8) | 19 (15.8–22.2) | <0.05 | |
| WA% | 0.78 (0.74–0.84) | 0.79 (0.74–0.87) | 0.78 (0.74–0.82) | 0.85 (0.79–0.89) | 0.79 (0.74–0.85) | <0.05 | |
Data are presented as the mean (SD) or median (IOR). P value from one-way ANOVA and Kruskal-Wallis among the four clusters. RB1, the apical segmental bronchus of the right upper lobe; T, wall thickness; D, bronchus external diameter; Din, bronchus inner diameter; WA, bronchus wall area; WA%, percentage of wall area.
Figure 1.
Theapical segmental bronchus of the right upper lobe. (A) The apical segmental bronchus of the right upper lobe of cluster 1; (B) the apical segmental bronchus of the right upper lobe of cluster 4.
Biopsy findings
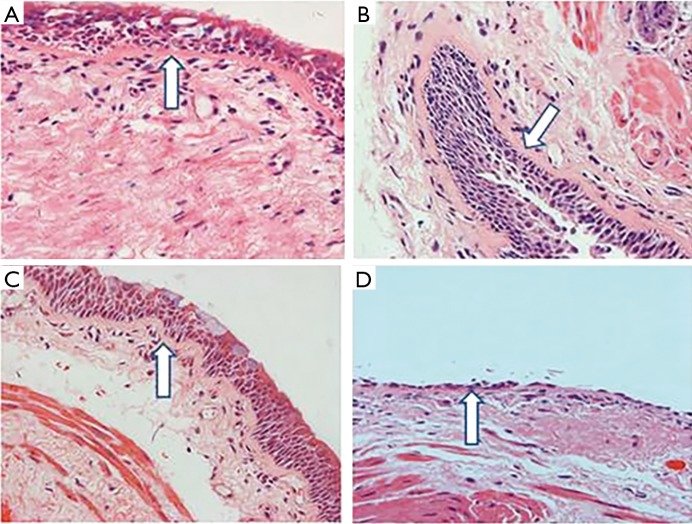
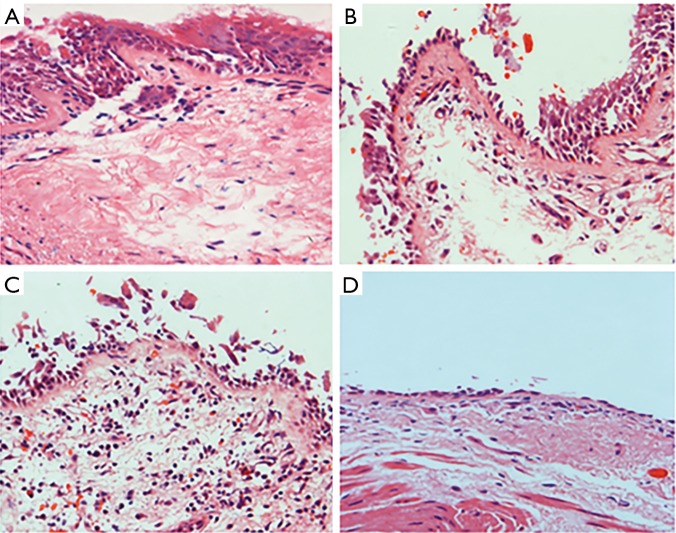
A total of 30 patients underwent fiberoptic bronchoscopy; 9 patients were in cluster 1, 17 patients in cluster 2, 3 patients in cluster 3, and 1 patient in cluster 4. A significant difference in BM was found (P<0.05). BM in the patients of cluster 4 was thicker than that in the other clusters, while cluster 1 had the smallest degree of BM thickening. These results were similar to those of the MSCT examination (Figure 2). The extent of epithelial injury among the four clusters was also significantly different (P<0.05). The percentages of epithelial injury in each cluster were 18.00%±17.40%, 29.00%±31.17%, 33.9%±17.79%, and 100.00%±0.00%, respectively. Nearly complete respiratory epithelium could be found in cluster 1, while partial epithelium was shed in clusters 2 and 3. In cluster 4, complete epithelium was shed and BM was denuded (Figure 3). The infiltration of eosinophils in the mucosa could always be found in clusters 1 and 2, but it was relatively rare in the other clusters (Figure 4).
Figure 2.
Basement membrane measurements (HE, × 400) (arrow: BM). (A) BM in cluster 1; (B) BM in cluster 2; (C) BM in cluster 3; (D) BM in cluster 4. BM, basement membrane.
Figure 3.
The extent of epithelial injury (HE, × 400). (A) Normal respiratory epithelium in cluster 1; (B) partial epithelial shedding in cluster 2; (C) epithelial shedding in cluster 3; (D) complete epithelial shedding and denuded baseline membrane in cluster 4.
Figure 4.
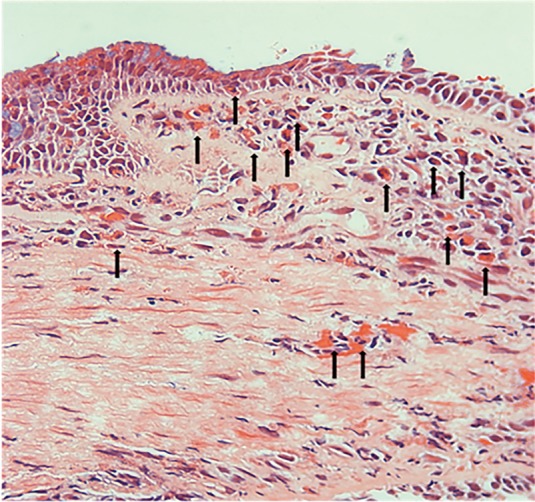
The infiltration of eosinophils in the mucosa (HE, × 400) (arrow).
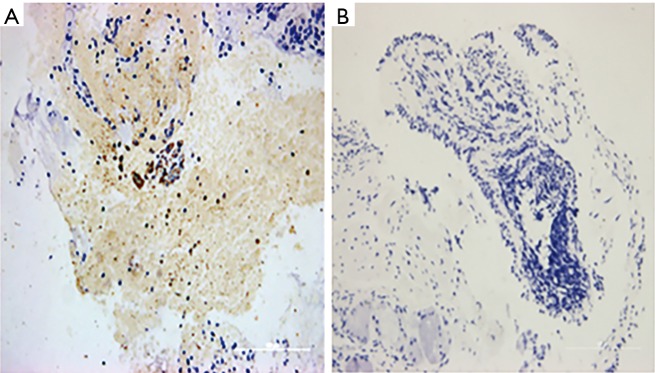
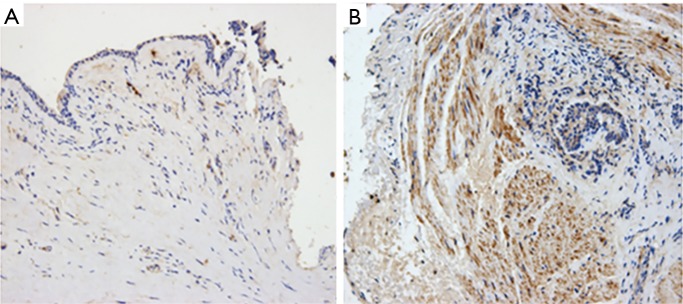
The mean density of IL-5 in the four clusters was 0.0575, 0.0180, 0.0072, and 0.0089, respectively (Figure 5). The mean density of IL-17 was 0.0710±0.02, 0.1242±0.06, 0.1527±0.29, and 0.2351±0.00, respectively (Figure 6). There was a significant difference in the expression of IL-5 and IL-17 (P<0.05), but there was no difference in the expression of TGF-β in the mucosa among the four clusters (P=0.674) (Table 4).
Figure 5.
Immunohistochemistry of IL-5 (× 200). (A) Expression of IL-5 in cluster 2; (B) expression of IL-5 in cluster 4.
Figure 6.
Immunohistochemistry of IL-17 (× 200). (A) Expression of IL-17 in cluster 1; (B) expression of IL-17 in cluster 4.
Table 4. HE staining and immunohistochemistry of bronchial mucosa biopsy.
| Variables | Mean (SD)/median (IQR) | P | |||
|---|---|---|---|---|---|
| Cluster 1 (n=9) | Cluster 2 (n=17) | Cluster 3 (n=3) | Cluster 4 (n=1) | ||
| Basement membrane (px) | 30.9340 (5.28) | 38.8064 (7.41) | 37.8583 (4.42) | 61.2640 (0.00) | <0.05 |
| Epithelial injury (%) | 18.00 (17.40) | 29.00 (31.17) | 33.90 (17.79) | 100 (0.00) | <0.05 |
| IL-17 | 0.0710 (0.02) | 0.1242 (0.06) | 0.1528 (0.29) | 0.2351 (0.00) | <0.05 |
| IL-5 | 0.0575 (0.0202–0.1586) | 0.0180 (0.0133–0.0261) | 0.0072 (0.0049–0.0083) | 0.0089 (0.0089–0.0089) | <0.05 |
| TGF-β | 0.0558 (0.0182–0.1264) | 0.0317 (0.0255–0.0678) | 0.0483 (0.0419–0.0680) | 0.0413 (0.0413–0.0413) | 0.674 |
Data are presented as the mean (SD) or median (IQR). P value from one-way ANOVA and Kruskal-Wallis among the four clusters.
Discussion
Bronchial asthma is a heterogeneous disease (4,5,12-14). In the past, doctors always evaluated patients’ severity and disease condition by their symptoms, mental state, and blood gas tests during an exacerbation. An individual with asthma may always be assigned a severity degree, despite potential disease heterogeneity. Thus, investigators have focused on asthma phenotypes to comprehensively describe the demographic, clinical, and pathophysiological characteristics.
The studies of asthma phenotypes mainly focus on two types: inflammatory and clinical phenotypes. The inflammatory phenotype is based on types of inflammatory cells in induced sputum. The airway inflammatory process in asthma has long been recognized as a heterogeneous condition, and it is determined by the types of infiltrated inflammatory cells (15,16). Our study is retrospective and lacks data on induced sputum. This is the main limitation of our experiment.
Clinical phenotyping of asthma is an approach for clustering patients by using several clinical variables, including age, sex, age at onset, BMI, symptoms, atopic status, and lung function tests, rather than induced sputum only. Because of the various variables used in clustering, clinical phenotypes are more comprehensive in assessing the condition of patients with asthma. GINA (1) has listed some of the most common phenotypes: allergic asthma, non-allergic asthma, late-onset asthma, asthma with fixed airflow limitation, and asthma with obesity. The Severe Asthma Research Program (SARP) (6) has also listed five asthma phenotypes: early-onset atopic asthma, moderate early-onset atopic asthma, late-onset non-atopic asthma, severe early-onset asthma, and late-onset non-atopic asthma with severe reduction in lung function. Cluster analysis (9-12) is considered a new direction in the phenotyping of asthma (17).
Given the similarities in the study population, our study is more similar to the SARP (6) than to GINA (1) classification; the phenotypes proposed by SARP were identified among patients with asthma who were aged 12 or older, and some met the criteria of severe asthma, whereas the phenotypes proposed by GINA were classified among all types of patients with asthma, including children, adults, and patients in primary care.
We identified four phenotypes; compared to the five clinical clusters identified by SARP (6), the phenotypes that we identified are similar to the SARP clusters in terms of patients’ atopy status, response to ICS treatment, etc. Thus, the clinical phenotypes in our study can also represent the clinical manifestations, disease severity, and treatment response of patients with asthma.
The SARP found that late-onset and non-atopic asthma, as well as obesity asthma, have decreased baseline pulmonary function (6) compared to atopic asthma. However, the results of our study showed that clusters 1 and 3 had no significant difference in pulmonary function. This might be explained by the following two points: patients who had variables with missing data were immediately excluded, and the patients of this study were all from Xinhua Hospital. Our study therefore could not represent all patients with asthma, which affected our identification of clinical phenotypes.
Each pathogenesis may encompass several phenotypes, just as a certain clinical phenotype may be present in more than one pathogenesis. More research is needed to validate the clinical utility of phenotypic classification by cluster analysis in asthma. We, therefore, tried to explore the airway remodeling and airway inflammation between clusters through the methods of MSCT and pathological examination.
MSCT is the most commonly used examination to characterize structural changes and offers imaging parameters of lungs, including a more accurate quantification of airway dimensions. Several previous studies have found that airway dimensions of the segmental bronchus of the right upper lobe are a good surrogate for the dimensions of small airways measured by histological methods (18-21). This is why the apical bronchus of the right upper lobe was chosen as our target measuring site. We found that MSCT could reflect the difference in airway remodeling among phenotypes from the perspective of imaging. Cluster 4, which had the greatest disease severity and the poorest pulmonary function, had the most obvious airway remodeling and reconstruction, which was manifested as airway wall thickening and decreased ventilation area. Thus, we consider that airway remodeling may be one of the causes of recurrent symptoms, more severe small airway obstruction, and corticosteroid resistance in patients with asthma.
In asthma, the small airways are the major site of airflow obstruction. Bronchial remodeling, particularly BMT, has relevant clinical implications (22-25). Thus, BMT has been the objective of numerous studies in patients with asthma and a well-recognized feature of airway remodeling. The uniqueness of our research is that we combined BMT measurement with asthma clinical phenotypes, and we successfully found the difference in BMT between the four clusters. The extent of BMT was correlated with the severity of the disease, effectiveness of corticosteroid treatment, and small airway obstruction, and this result was similar to the findings of the MSCT examination.
As bronchial epithelial cells in patients with asthma are always exposed to some allergic and stimulative factors, such as infectious agents, inflammatory mediators, allergens and so on, it has been reported that abnormal regeneration of epithelium, such as epithelial loss, may often occur (26,27). In patients with asthma, epithelial destruction has been extensively studied before, and epithelial injury in airways has been found in post-mortem examinations and bronchial biopsies of fiberoptic bronchoscopies in asthma; therefore, it is considered to be a specific and common characteristic of asthma (28). In our study, we found similar results, and we further indicated the difference in epithelial injury among phenotypes. Therefore, we suggest that the abnormalities we found in epithelial cells and the BM may lead to airway hyperresponsiveness and increase of epithelium sensitivity to allergens, and may finally cause acute asthma exacerbations. This process may also explain the reason of disease recurrence in clusters 3 and 4.
The imbalance of Th1/Th2 cytokines has long been recognized as a basic cause of asthma onset. In recent years, studies have found that the imbalance of Th17/Treg cells may play an important role in steroid-resistant, severe, and neutrophilic asthma (29-31). To study the correlation between phenotypes and immunologic mechanisms, we chose two representative cytokines, IL-5 and IL-17. Our study found that clusters 1 and 2 had high IL-5 and low IL-17 expression, which suggested that those clusters may be affected by the Th2 immune response. In contrast, clusters 3 and 4, with low IL-5 and high IL-17 expression, may involve the Th17 immune response, such that observed in steroid-resistant, severe, or neutrophilic asthma. Thus, we suggest that the different phenotypes may present with different airway inflammation patterns and diverse pathogeneses.
TGF-β is one of the most important inflammatory factors involved in airway remodeling. However, we found no difference in the expression of TGF-β in the mucosa among the four clusters. This may be due to the small number of biopsy specimens.
The small number of samples limited the results of our study. However, MSCT examination and biopsy findings can adequately reflect the pathological and immunological mechanisms of asthma in terms of airway remolding and airway inflammation, and may suggest that there are diverse pathogeneses among the phenotypes. Anderson (32) proposed the “endotype” to define asthma subtypes. The endotype represents a specific function or pathophysiological mechanism of a subtype, but this is currently only conjecture. In the future, more research is needed to validate whether clinical phenotypes can accurately diagnose asthma and find more effective individualized therapies to ultimately benefit more patients with asthma.
Conclusions
Four distinct clinical phenotypes of asthma were identified by cluster analysis, which could successfully represent the clinical manifestations, disease severity, and treatment response of patients with asthma. Furthermore, the results of MSCT and pathological examination may suggest the presence of diverse pathogeneses among those phenotypes.
Acknowledgements
None.
Ethical Statement: The study was approved by the ethics committee of XinHua Hospital (No. XHEC-C-2015-031).
Footnotes
Conflicts of Interest: The authors have no conflicts of interest to declare.
References
- 1.Global Initiative for Asthma. Global Strategy for Asthma Management and Prevention (GINA). 2015. Available online: http://ginasthma.org/wp-content/uploads/2016/01/GINA_Report_2015_Aug11-1.pdf
- 2.Gibson PG, Simpson JL, Saltos N. Heterogeneity of airway inflammation in persistent asthma: evidence of neutrophilic inflammation and increased sputum interleukin-8. Chest 2001;119:1329-36. 10.1378/chest.119.5.1329 [DOI] [PubMed] [Google Scholar]
- 3.Haldar P, Pavord ID, Shaw DE, et al. Cluster analysis and clinical asthma phenotypes. Am J Respir Crit Care Med 2008;178:218-24. 10.1164/rccm.200711-1754OC [DOI] [PMC free article] [PubMed] [Google Scholar]
- 4.Global Initiative for Asthma. Global Strategy for Asthma Management and Prevention (GINA). 2009. Available online: http://www.ginasthma.org
- 5.Bel EH. Clinical phenotypes of asthma. Curr Opin Pulm Med 2004;10:44-50. 10.1097/00063198-200401000-00008 [DOI] [PubMed] [Google Scholar]
- 6.Moore WC, Meyers DA, Wenzel SE, et al. Identification of asthma phenotypes using cluster analysis in the Severe Asthma Research Program. Am J Respir Crit Care Med 2010;181:315-23. 10.1164/rccm.200906-0896OC [DOI] [PMC free article] [PubMed] [Google Scholar]
- 7.Wenzel SE. Asthma phenotypes: the evolution from clinical to molecular approaches. Nat Med 2012;18:716-25. 10.1038/nm.2678 [DOI] [PubMed] [Google Scholar]
- 8.Respiratoy Branch of Chinese Medicine Academy Guidelines for Asthma Prevention and Treatment. Chin J Tuberc Respir Dis 2008;31:177-85. [Google Scholar]
- 9.Siroux V, Garcia-Aymerich J. The investigation of asthma phenotypes. Curr Opin Allergy Clin Immunol 2011;11:393-9. 10.1097/ACI.0b013e32834a955a [DOI] [PubMed] [Google Scholar]
- 10.Fitzpatrick AM, Teague WG, Meyers DA, et al. Heterogeneity of severe asthma in childhood: confirmation by cluster analysis of children in the National Institutes of Health/National Heart, Lung, and Blood Institute Severe Asthma Research Program. J Allergy Clin Immunol 2011;127:382-9.e1-13. [DOI] [PMC free article] [PubMed]
- 11.Just J, Gouvis-Echraghi R, Couderc R, et al. Novel severe wheezy young children phenotypes: boys atopic multiple-trigger and girls nonatopic uncontrolled wheeze. J Allergy Clin Immunol 2012;130:103-10.e8. 10.1016/j.jaci.2012.02.041 [DOI] [PubMed] [Google Scholar]
- 12.Gouvis-Echraghi R, Saint-Pierre P, Besharaty AA, et al. Exhaled nitric oxide measurement confirms 2 severe wheeze phenotypes in young children from the Trousseau Asthma Program. J Allergy Clin Immunol 2012;130:1005-7.e1. 10.1016/j.jaci.2012.07.007 [DOI] [PubMed] [Google Scholar]
- 13.Henderson J, Granell R, Sterne J. The search for new asthma phenotypes. Arch Dis Child 2009;94:333-6. 10.1136/adc.2008.143636 [DOI] [PubMed] [Google Scholar]
- 14.Wu AC, Tantisira K, Li L, et al. Predictors of symptoms are different from predictors of severe exacerbations from asthma in children. Chest 2011;140:100-7. 10.1378/chest.10-2794 [DOI] [PMC free article] [PubMed] [Google Scholar]
- 15.Gibson PG. Inflammatory phenotypes in adult asthma: clinical applications. Clin Respir J 2009;3:198-206. 10.1111/j.1752-699X.2009.00162.x [DOI] [PubMed] [Google Scholar]
- 16.Simpson JL, Scott R, Boyle MJ, et al. Inflammatory subtypes in asthma: assessment and identification using induced sputum. Respirology 2006;11:54-61. 10.1111/j.1440-1843.2006.00784.x [DOI] [PubMed] [Google Scholar]
- 17.Fahy JV. Identifying clinical phenotypes of asthma: steps in the right direction. Am J Respir Crit Care Med 2010;181:296-7. 10.1164/rccm.200911-1702ED [DOI] [PubMed] [Google Scholar]
- 18.Niimi A, Matsumoto H, Amitani R, et al. Airway wall thickness in asthma assessed by computed tomography. Relation to clinical indices. Am J Respir Crit Care Med 2000;162:1518-23. 10.1164/ajrccm.162.4.9909044 [DOI] [PubMed] [Google Scholar]
- 19.Nakano Y, Wong JC, de Jong PA, et al. The prediction of small airway dimensions using computed tomography. Am J Respir Crit Care Med 2005;171:142-6. 10.1164/rccm.200407-874OC [DOI] [PubMed] [Google Scholar]
- 20.Montaudon M, Lederlin M, Reich S, et al. Bronchial measurements in patients with asthma: comparison of quantitative thin-section CT findings with those in healthy subjects and correlation with pathologic findings. Radiology 2009;253:844-53. 10.1148/radiol.2533090303 [DOI] [PubMed] [Google Scholar]
- 21.Awadh N, Müller NL, Park CS, et al. Airway wall thickness in patients with near fatal asthma and control groups: assessment with high resolution computed tomographic scanning. Thorax 1998;53:248-53. 10.1136/thx.53.4.248 [DOI] [PMC free article] [PubMed] [Google Scholar]
- 22.Ollerenshaw SL, Woolcock AJ. Characteristics of the inflammation in biopsies from large airways of subjects with asthma and subjects with chronic airflow limitation. Am Rev Respir Dis 1992;145:922-7. 10.1164/ajrccm/145.4_Pt_1.922 [DOI] [PubMed] [Google Scholar]
- 23.Jeffery PK, Godfrey RW, Adelroth E, et al. Effects of treatment on airway inflammation and thickening of basement membrane reticular collagen in asthma. A quantitative light and electron microscopic study. Am Rev Respir Dis 1992;145:890-9. 10.1164/ajrccm/145.4_Pt_1.890 [DOI] [PubMed] [Google Scholar]
- 24.Trigg CJ, Manolitsas ND, Wang J, et al. Placebo-controlled immunopathologic study of four months of inhaled corticosteroids in asthma. Am J Respir Crit Care Med 1994;150:17-22. 10.1164/ajrccm.150.1.8025745 [DOI] [PubMed] [Google Scholar]
- 25.Kasahara K, Shiba K, Ozawa T, et al. Correlation between the bronchial subepithelial layer and whole airway wall thickness in patients with asthma. Thorax 2002;57:242-6. 10.1136/thorax.57.3.242 [DOI] [PMC free article] [PubMed] [Google Scholar]
- 26.Kosciuch J, Krenke R, Gorska K, et al. Comparison of airway wall remodeling in asthma and COPD: biopsy findings. Respir Care 2012;57:557-64. [DOI] [PubMed] [Google Scholar]
- 27.Holgate ST, Davies DE, Lackie PM, et al. Epithelial-mesenchymal interactions in the pathogenesis of asthma. J Allergy Clin Immunol 2000;105:193-204. 10.1016/S0091-6749(00)90066-6 [DOI] [PubMed] [Google Scholar]
- 28.Jeffery PK, Wardlaw AJ, Nelson FC, et al. Bronchial biopsies in asthma. An ultrastructural, quantitative study and correlation with hyperreactivity. Am Rev Respir Dis 1989;140:1745-53. 10.1164/ajrccm/140.6.1745 [DOI] [PubMed] [Google Scholar]
- 29.Curotto de Lafaille MA, Kutchukhidze N, Shen S, et al. Adaptive Foxp3+ regulatory T cell-dependent and -independent control of allergic inflammation. Immunity 2008;29:114-26. 10.1016/j.immuni.2008.05.010 [DOI] [PubMed] [Google Scholar]
- 30.Zhou L, Lopes JE, Chong MM, et al. TGF-beta-induced Foxp3 inhibits T(H)17 cell differentiation by antagonizing RORgammat function. Nature 2008;453:236-40. 10.1038/nature06878 [DOI] [PMC free article] [PubMed] [Google Scholar]
- 31.Bettelli E, Carrier Y, Gao W, et al. Reciprocal developmental pathways for the generation of pathogenic effector TH17 and regulatory T cells. Nature 2006;441:235-8. 10.1038/nature04753 [DOI] [PubMed] [Google Scholar]
- 32.Anderson GP. Endotyping asthma: new insights into key pathogenic mechanisms in a complex, heterogeneous disease. Lancet 2008;372:1107-19. 10.1016/S0140-6736(08)61452-X [DOI] [PubMed] [Google Scholar]


