

Abstract
Background
The cerebellum plays important roles in both sensorimotor and supramodal cognitive functions. Cellular, volumetric, and functional abnormalities of the cerebellum have been found in autism spectrum disorders (ASD), but no comprehensive investigation of cerebro-cerebellar connectivity in ASD is available.
Methods
We used resting-state functional connectivity MRI in 56 children and adolescents (28 ASD, 28 typically developing [TD]) aged 8–17 years. Partial and total correlation analyses were performed for unilateral regions of interest (ROIs), distinguished in two broad domains as sensorimotor (premotor/primary motor, somatosensory, superior temporal, occipital) and supramodal (prefrontal, posterior parietal, and inferior and middle temporal).
Results
There were three main findings: (i) Total correlation analyses showed predominant cerebro-cerebellar functional overconnectivity in the ASD group; (ii) partial correlation analyses that emphasized domain-specificity (sensorimotor vs. supramodal) indicated a pattern of robustly increased connectivity in the ASD group (compared to the TD group) for sensorimotor ROIs, but predominantly reduced connectivity for supramodal ROIs; (iii) this atypical pattern of connectivity was supported by significantly increased non-canonical connections (between sensorimotor cerebral and supramodal cerebellar ROIs, and vice versa) in the ASD group.
Conclusions
Our findings indicate that sensorimotor intrinsic functional connectivity is atypically increased in ASD, at the expense of connectivity supporting cerebellar participation in supramodal cognition.
Keywords: Autism spectrum disorder, cerebrum, cerebellum, functional connectivity, MRI, sensorimotor, supramodal
Introduction
While originally considered a sensorimotor structure (1), the cerebellum has come to be recognized more recently for its role in complex cognition, including social and emotional functions (2–5). In autism spectrum disorder (ASD), a neurodevelopmental disorder diagnosed based on sociocommunicative impairments and restricted and repetitive behaviors, cerebellar anomalies have been reported for decades (e.g., 6,7). A recent „consensus paper’ emphasized the strong evidence of anatomical abnormalities in the cerebellum, accompanied by findings of neuroinflammation and oxidative stress, as well as motor and cognitive impairments indicating cerebellar involvement in ASD (8). Postmortem studies have revealed abnormalities in Purkinje cells, including reduced cell size (9) and count (10,11). This appears consistent with reports of reduced cerebellar blood flow (12), and with MR spectroscopy findings of decreased cerebellar levels of N-acetyl-asparate in ASD, indicating decreased neuronal density and function (see meta-analysis (13)). A number of studies have further indicated gross abnormalities of cerebellar morphology (14–17). Specific findings include early cerebellar overgrowth (18,19) and hypoplasia of vermis lobules VI–VII (7,20,21), and possibly lobules VIII and IX (22) in ASD (but see (23)). A cerebellar role in ASD is furthermore supported by comorbidity with ASD in disorders associated with cerebellar defects (such as Joubert syndrome) (24) and the high incidence of autistic signs in prematurely born children with cerebellar injury (25).
Evidence implicating cerebro-cerebellar connectivity in ASD remains limited. Several diffusion tensor imaging (DTI) studies observed white matter compromise in the superior and middle cerebellar peduncles (26–28). Functional connectivity MRI (fcMRI) studies have reported reduced connectivity within cerebro-cerebellar motor networks during finger sequence tapping (29) and reduced cerebro-cerebellar connectivity related to verb generation (30) in children with ASD. However, there has been no comprehensive investigation of cerebro-cerebellar connectivity in ASD to date.
Resting state (rs) fcMRI detects spontaneous fluctuations of the blood oxygen level dependent (BOLD) signal (31). Network-specific synchronized fluctuations are specifically detected at low frequencies (c. 0.01<f<0.1Hz) (32). Findings from rs-fcMRI have been found to largely correspond to anatomical connectivity (33,34) and networks known from activation fMRI (35,36). Although rs-fcMRI data have been used for the study of the default mode network (37), other functional cognitive and sensorimotor networks can be equally detected (36,38). The cerebellum can be broadly partitioned into sensorimotor and supramodal zones (predominantly in anterior and inferior vs. lateral cerebellar regions, respectively) (5,39). Using rs-fcMRI in healthy adults, O’Reilly et al. (40) identified such sensorimotor and supramodal zones within the cerebellum (referred to as “domains” in the present study) that were in agreement with evidence from activation studies (41).
The present study examined cerebro-cerebellar resting state functional connectivity in children and adolescents with ASD and matched typically developing (TD) participants for a comprehensive investigation of sensorimotor and supramodal connectivity, including seeds in prefrontal, motor, somatosensory, temporal, parietal, and occipital regions. In view of evidence from other techniques implicating the cerebellum, we expected reduced connectivity for regions both in sensorimotor and supramodal ‘cognitive’ domains.
Materials and Methods
Participants
Sixty-five participants (33 ASD and 32 TD) were scanned for this study. Nine participants (6 ASD, 3 TD) were excluded from analyses due to excessive head motion (see details below). The final analysis therefore included 56 participants (28 per group) aged 8.0 to 17.7 years, with groups matched for handedness, IQ, age, and motion (Table 1).
Table 1.
Participant Characteristics
| ASD | TD | ||
|---|---|---|---|
| n =28 (3 female) | n =28 (5 female) | p | |
| Mean ± SD (range) | Mean ± SD (range) | ||
| Age (years) | 14.27±2.51 (9.2–17.7) | 13.3±2.56 (8.0–16.8) | .92 |
| Non–verbal IQ | 104±20.00 (52–129) | 111±10 (90–137) | .19 |
| Verbal IQ | 105±18.73 (72–147) | 108±10 (87–127) | .52 |
| Full–scale IQ | 108±17.5 (73–141) | 111±9.5 (93–130) | .51 |
| Handedness | 4 left | 4 left | – |
| RMSD | .125±.12 (.02–.48) | .133±.12 (.30–.57) | .86 |
| ADOS–Total | 10.38±3.79 (7–19) | – | – |
| ADOS–Soc | 6.94±3.17 (3–13) | – | – |
| ADOS–Comm | 3.44±2.19 (0–8) | – | – |
| ADOS–Rep | 1.94±1.29 (0–4) | – | – |
| ADI–R Soc | 16.80±5.50 (10–23) | – | – |
| ADI–R Comm | 12.47±5.82 (8–22) | – | – |
| ADI–R Rep | 5.73±2.22 (3–11) | – | – |
| SRS_Mot | 73.94±12.31 (56–92) | 44.64± 6.77 (37–59) | .00 |
| SRS_Comm | 78.56± 7.59 (67–90) | 41.50± 4.27 (36–48) | .00 |
| SRS_Aware | 70.33± 10.18 (46–88) | 45.59± 8.88 (36–65) | .00 |
| SRS_Cog | 75± 10.28 (57–94) | 42.77± 5.91 (36–56) | .00 |
| SRS_Am | 86.61± 13.47 (74–114) | 42.96± 4.28 (40–55) | .00 |
| SRS_Total | 81.83± 7.95 (73–94) | 44.23± 11.86 (35–92) | .00 |
| SCQ | 18.89± 6.09 (3–29) | 2.86± 4.49 (0–21) | .00 |
Significance value, p, from two-sample independent t-tests. SD, standard deviation; RMSD, root mean square displacement.
Diagnostic decision in the ASD group was made by a clinical expert (co-author AJL), based on DSM-IV (42), Autism Diagnostic Interview-Revised (ADI-R) (43), and Autism Diagnostic Observation Schedule (ADOS) (44). No participants with comorbid medical diagnoses (e.g., Fragile-X, epilepsy, tuberous sclerosis) were included. Nine ASD participants were taking psychotropic medications at the time of study (Supplementary Table S1). No TD participants with any family history of ASD or personal history of any other neurological or psychiatric condition were included. Hand preference was determined using the Edinburgh handedness inventory (45). General intelligence was assessed using the Wechsler Abbreviated Scale of Intelligence (46). For an additional measure of sociocommunicative abilities, we administered the Social Responsiveness Scale (SRS) (47).
MRI Data Acquisition
Imaging data were acquired on a 3 Tesla GE MR750 Scanner with an 8-channel head coil, including high-resolution T1-weighted structural images (TR: 11.08ms; TE: 4.3ms; flip angle: 45°; FOV: 256mm; 256 × 256 matrix; 180 slices; 1mm3 resolution). Resting state T2*-weighted images were acquired for 6:10 minutes (185 whole-brain volumes) with an Array Spatial Sensitivity Encoding Technique (ASSET), using a single-shot gradient-recalled, echo-planar pulse sequence (TR: 2000ms; TE: 30ms; slice thickness: 3.4mm; in-plane resolution: 3.4mm2). Heart rate was monitored with a pulse oximeter and respiration with a pressure sensitive belt. Physiological data were only available for 42 of the 56 participants (21 per group) due to equipment malfunction. Participants were instructed to relax and remain still in the scanner, and to fixate a white crosshair at the center of a black projection screen.
Data Preprocessing
Imaging data were preprocessed and analyzed using AFNI (48). Preprocessing included field map, slice-time, and motion correction, isolation of low frequency fluctuations through temporal bandpass filtering (.01<f<.1Hz), normalization to Talairach space, and spatial smoothing to a Gaussian full-width at half-maximum of 6mm3. Nuisance regressors included 6 rigid-body motion parameters (3 rotational and 3 translational directions), heart rate and respiration (if available), and time series extracted from ventricular and white matter compartments. Global signal regression (GSR) was not performed, given tight group matching for motion-related noise (see below) and availability of physiological regressors for most participants. While global signal regression has been argued to powerfully remove noise in FC analyses (49), it has also been found that GSR removes true (functionally relevant) BOLD signal (50) and has the potential to distort group differences in FC (51,52).
Head Motion
In view of the known impact of head motion on BOLD correlations (53,54), several steps beyond conventional motion correction and the use of six motion nuisance regressors were taken to reduce the effect of head motion. Time points with excessive motion (≥1.5mm displacement), as well as their immediate neighbors, were censored (“scrubbed”). Participants with <80% retained time points were excluded. Groups did not differ on motion as measured by root mean square of displacement (p=.86). We also tested for group differences in type of motion using a two-way ANOVA with factors group and motion type (3 translations, 3 rotations), which yielded no group by motion type interaction (p=.76).
Regions of Interest
Cortical masks were obtained using the Jülich-Histological Atlas available in FSLView Toolbox. In total, 14 cortical regions of interest (ROIs) were used (7 per hemisphere; Figure 1). Ten of these corresponded to those used by O’Reilly et al. (40): prefrontal cortex (PFC), somatosensory (S1), superior temporal cortex (STC), premotor and primary motor cortices (PMC), and posterior parietal cortex (PPC). Whereas O’Reilly et al. (40) used a visual ROI that was limited to MT/V5, we included an ROI covering the entire occipital lobe (OCC) in each hemisphere. Two additional ROIs (IMT, one per hemisphere) combined inferior and middle temporal gyri. The cerebellar mask was obtained from the Cerebellar MNI FLIRT Maxprob thr25-2mm mask also available in FSLView Toolbox and was separated by hemisphere. The cerebellar mask excluded white matter areas and was transformed into Talairach space.
Figure 1.
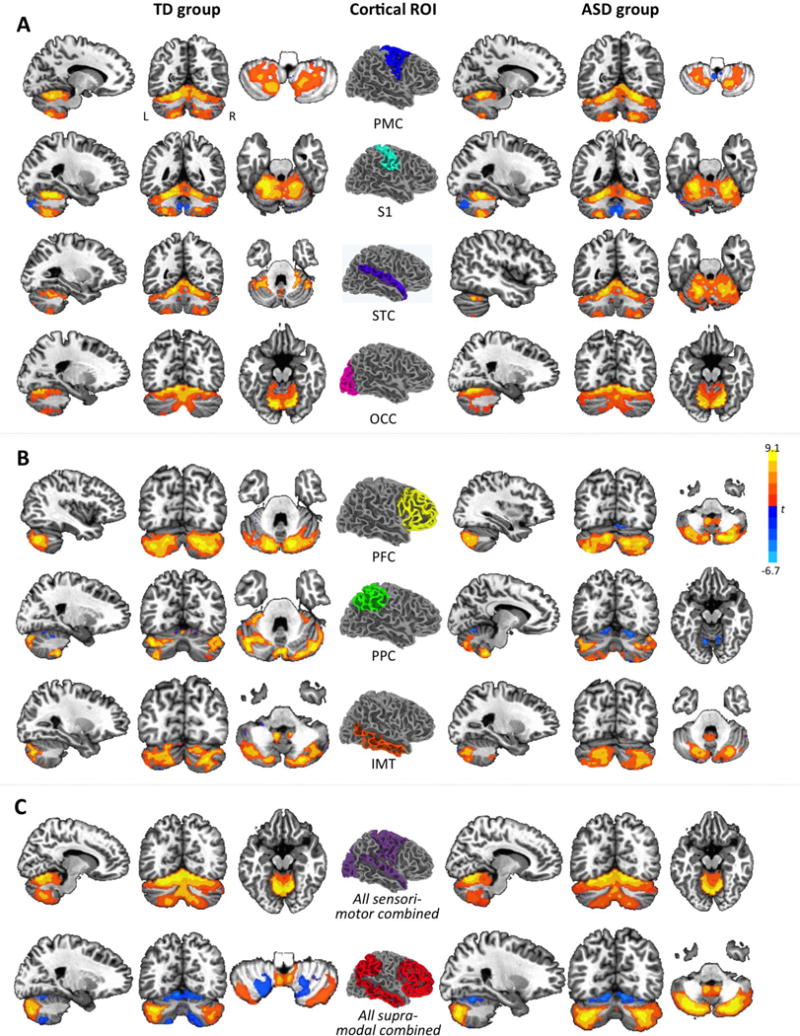
Cerebro-cerebellar intrinsic functional connectivity maps from partial correlation analyses by cortical seed and group (p<.05, corr.). Cortical seeds in the center are shown in right hemisphere overlay only. For each unilateral cortical seed, only effects in contralateral cerebellum are shown. For example, effects for left PMC are depicted in right cerebellum, those for right PMC are depicted in left cerebellum, and both overlays are merged in each panel. Effects are shown for sensorimotor ROIs in (A), for supramodal ROIs in (B), and for ROIs combined by type in (C). PMC, premotor and primary motor cortices; S1, somatosensory cortex; STC, superior temporal cortex; OCC, occipital lobe; PFC, prefrontal cortex; PPC, posterior parietal cortex; IMT, inferior and middle temporal gyri.
Correlation analyses
Following O’Reilly et al. (40), ROIs were divided into two domains. The sensorimotor domain included PMC, S1, STC, and OCC, the supramodal domain included PFC, PPC, and IMT. An average time series was extracted from each unilateral ROI in each participant. Partial correlation analyses were performed between ROI-specific time series and each voxel in the contralateral cerebellum (given the crossed connectivity between cerebrum and cerebellum). For each supramodal ROI, four time series from ipsilateral sensorimotor ROIs were partialled out. Likewise, for each sensorimotor ROI, three time series from ipsilateral supramodal ROIs were partialled out. Analyses were performed using a general linear model (AFNI’s 3dDeconvolve), with nuisance regressors as described above. Correlation coefficients were normalized using Fisher’s r-to-z’ conversion.
While partial correlations highlight the domain-specificity of functional connectivity (FC), possible general group differences (such as overall underconnectivity in ASD) may remain undetected. We therefore also performed corresponding analyses using total correlations. For both partial and total correlation, one sample t-tests were performed for within-group and two sample t-tests for between-group effects, using a random-effects approach. Statistical maps for partial and total correlation were thresholded (using AFNI’s 3dclustsim) at a voxel-wise significance of p<.001 with a minimum cluster size of 15 voxels in within-group tests, and at p<.01 with a cluster size of ≥25 voxels in between-group tests, both for a corrected significance at p<.05 (55). These parameters were adapted to the different magnitude of effects (greater for within-than for between-group comparisons) and optimized for the detection of regionally specific effects (56).
To further examine the overall sensorimotor vs. supramodal cerebro-cerebellar connectivity, all sensorimotor ROIs (PMC, S1, STC, OCC) were combined into a single sensorimotor mask (SM) per hemisphere, and all supramodal ROIs (PFC, PPC, IMT) were combined into one supramodal mask (SU) per hemisphere. Analogous partial and total correlation analyses were then performed for these seeds.
We also tested for group differences in connectivity type. We distinguished canonical connectivity (i.e., connectivity expected from the TD literature between cerebral and cerebellar ROIs of the same type [SM, SU]) from non-canonical connectivity (SU-SM, SM-SU), using data from partial correlation analyses (as these highlight the domain-specificity of connections) and expecting to find the latter to be increased in ASD. Based on Stoodley and colleagues (39,41), the sensorimotor cerebellar zone included lobules I–V, VIIIA and B, and IX, and supramodal cerebellar zone included lobules VI, and VIIA and B (crus I and II; see Supplementary Figure S1). Lobule VI was classified as supramodal, given its connectivity with prefrontal and parietal association areas (57) and involvement in working memory and verb generation (58). Lobule IX was classified as SM, based on evidence of its involvement in tactile perception (59), balance, and gait (60). No effects were detected in lobule X. Cortical and cerebellar ROIs were coded as either SU or SM, and a group (TD, ASD) by connection type (canonical, non-canonical) ANOVA was performed. Further, we examined whether there were differential effects of age on cerebro-cerebellar connectivity for ASD and TD groups by adding age as a covariate.
Finally, Pearson correlations were computed to explore the relationship between cerebro-cerebellar FC (mean z’ extracted from clusters of significant between-group effects) and scores for symptom severity (ADOS total, SRS total) and general level of functioning (VIQ, NVIQ) in the ASD group. In order to limit the number of comparisons, these were only performed for combined sets of ROIs (SM, SU).
Results
Single ROIs
Partial correlation analyses revealed connectivity between cerebral sensorimotor ROIs (STC, S1, PMC, OCC) in anterior (Lobule I–V), superior (lobule IV–VI), and inferior (lobule VIII) cerebellum in both groups (Figure 1A). Connectivity with supramodal ROIs (PFC, PPC, IMT) was detected predominantly in posterolateral neocerebellum (primarily lobule VII, crus I and II) (Figure 1B). Our findings for TD children and adolescents were thus largely consistent with those from O’Reilly et al. (40) for TD adults. Between-group comparisons showed increased connectivity in the ASD compared to the TD group for all four sensorimotor ROIs, primarily in lobules VI and VII (crus I), except for a small cluster for the right PMC seed showing an inverse effect (TD>ASD) that peaked in lobule VIIb. Conversely, we found reduced connectivity for supramodal ROIs (bilateral PFC and PPC), detected in lobules VI and VII (predominantly crus I) (Figure 2B; Supplementary Table S2). The pattern for IMT was mixed, with underconnectivity in the ASD group in left crus I, but overconnectivity in inferior cerebellum and vermis.
Figure 2.
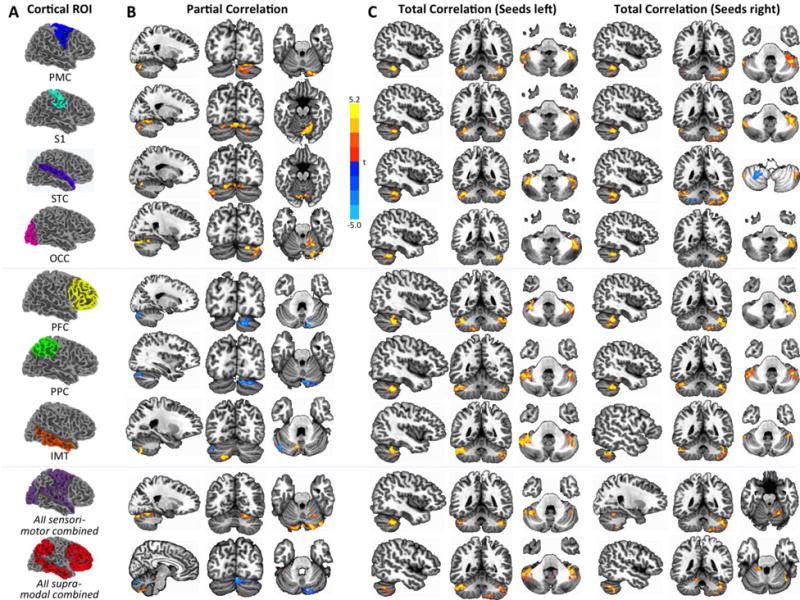
Between-group effects by cortical seed and group (p<.05, corr.). Seeds are shown in (A). In (B), effects for partial correlation are shown analogous to Figure 1. Effects for total correlation (C) are shown separately for left and right hemispheric seeds. On these maps, effects for unilateral cortical seeds are shown in bilateral cerebellum (as explained in main text). Positive t-scores (warm colors) indicate greater FC in the ASD group, negative t-scores (cool colors) indicate greater FC in the TD group.
Group comparisons were also performed for total correlations between each unilateral cortical ROI and bilateral cerebellum, in order to test for (i) general effects of under- or overconnectivity in ASD across ROIs that may have remained undetected in partial correlations, and (ii) potential differences in the primarily crossed connectivity between cerebral and cerebellar hemispheres. The pattern of results (Figure 2C) differed from those for partial correlations. First, whereas only a few small underconnectivity clusters were detected for STC bilaterally, left OCC, and right PPC and IMT, we found extensive overconnectivity effects for every single seed (Supplementary Table S3). Second, the regions of overconnectivity within the cerebellum were similar across different cerebral seeds, occurring predominantly in Lobule VI, crus I–II, and lobules VIIIA-B.
Combined sensorimotor and supramodal ROIs
For both left and right SM ROIs, exclusive overconnectivity (ASD>TD) was seen for partial and total connectivity analyses (Figure 2B–C; Supplementary Tables S4–S5) in lobules VI, VII, and VIII. Overconnectivity (in lobules VI–IX) was also detected for right SU, whereas effects for left SU were mixed, with overconnectivity in similar regions accompanied by underconnectivity clusters (TD>ASD) extending from lobule VI to IX. In total correlation analyses, overconnectivity effects for left hemisphere seeds occurred in bilateral cerebellum, but those for right hemisphere seeds predominated in the ipsilateral (right) cerebellar hemisphere (Figure 2C).
Analyses for connectivity type
There was a main effect of both group (ASD, TD), F(1, 55)=4.434, p=.035, and connectivity type (canonical, non-canonical), F(1, 55)=45.91, p<.001. Additionally, we found a significant group by connection type interaction, F(2,54)=7.08, p=.008. Post hoc analyses using Bonferroni correction indicated that canonical mean cerebro-cerebellar connectivity was similar in both groups, whereas non-canonical connectivity was significantly greater in the ASD than in the TD group (Figure 3). There was also a significant effect of the age covariate, F(1, 55) = 12.48, p<.001 (see Supplementary Figure S2).
Figure 3.
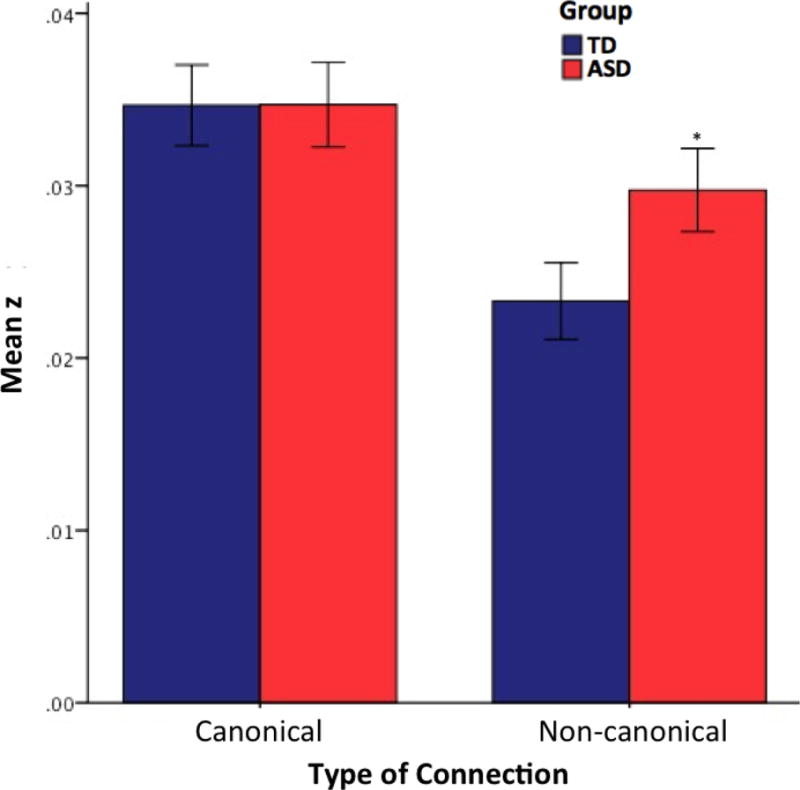
FCMRI effects by connectivity type. While both groups show similarly high levels of canonical connectivity, the ASD group shows significantly greater non-canonical connectivity than the TD group (*, p<.05). Error bars display standard error of the mean.
Diagnostic and Neuropsychological Correlations
For cerebro-cerebellar functional connectivity of SM or SU ROIs, there were no correlations with ADOS total severity scores. However, correlations were found for SRS total scores and left (but not the right) cerebral ROIs. For left SM, correlation with SRS total scores was negative (r(26) = −.583, p <.002), whereas for left SU it was positive (r(26) =.415, p <.035). Cerebellar connectivity with the right SM ROI was further negatively correlated with nonverbal IQ (r(26) = −.513, p <.009). Note that these correlational analyses were exploratory and no correction for multiple comparisons was performed.
Discussion
This is the first comprehensive investigation of cerebro-cerebellar functional connectivity in ASD. Results were consistent with the known functional topography of the cerebellum (40,41) and its role in both sensorimotor and supramodal cognitive domains (2,39,61,62). Our partial correlation findings for TD children and adolescents (Figure 1) were overall in agreement with those from Oֹ’Reilly and colleagues (40) for adults, with few differences (e.g., slightly stronger inferior cerebellar connectivity with sensorimotor ROIs in our the study), which may relate to slight differences in cortical ROIs and the younger age of our participants. Note that O’Reilly et al. (40) reported few effects in medial cerebellum, whereas we used unilateral cerebellar target masks all the way up to the midline and expectedly found strong effects in the vermis.
Atypical cerebro-cerebellar FC in ASD can be summarized by three main findings. Total correlation analyses, which were more sensitive to global connectivity differences, showed that functional connectivity was overall atypically increased in the ASD group. Partial correlation analyses, which highlighted the domain-specificity of connections, showed that non-canonical connections (between cortical regions of one domain [supramodal or sensorimotor] and cerebellar regions of the other) were increased in ASD. Finally, partial correlation analyses also showed that cerebro-cerebellar overconnectivity in sensorimotor networks was accompanied by underconnectivity in supramodal networks.
General cerebro-cerebellar functional overconnectivity
Total correlation analyses showed that intrinsic FC between cerebrum and cerebellum was overall significantly increased in the ASD group for each of the seven cortical seeds. While a few small clusters of inverse effects (TD > ASD) were detected for some of these seeds, large overconnectivity clusters predominated. This overall finding may appear unexpected, both generally in the context of the ASD connectivity literature and more specifically with respect to cerebro-cerebellar connectivity. One fcMRI study (29) reported reduced cerebellar activation during finger tapping and reduced FC within a motor circuit (primary motor cortex, SMA, thalamus, and anterior cerebellum). Although we also detected a small underconnectivity cluster in left anterior cerebellum for the PMC seed, we found much larger inverse effects of overconnectitviy for the ASD group in lateral and inferior cerebellar regions, i.e., outside the cerebellar ROI used by Mostofsky and colleagues. Other methodological differences include the focus on task-driven BOLD correlations by Mostofsky et al. (29), contrary to our use of intrinsic FC. This difference between co-activation and intrinsic fcMRI may heavily impact between-group findings (63,64). A growing number of recent intrinsic fcMRI studies has, in fact, reported overconnectivity in ASD (65–67). Synchronized intrinsic low-frequency fluctuations are considered to reflect functional network organization as an outcome of Hebbian synaptic plasticity (68,69). Thus cerebral and cerebellar regions, for which intrinsic overconnectivity was detected in our study, are likely to be linked by a history of concurrent activation. Whether such overconnectivity may be beneficial or detrimental to efficient network function will be discussed below.
Our overconnectivity finding may also appear at odds with the currently very limited DTI evidence for cerebellar connectivity. Findings showed reduced fractional anisotropy (FA) for the bilateral middle cerebellar peduncle in children with ASD (70), and reduced FA in adults with Asperger’s syndrome in the right superior cerebellar peduncle and in short fibers within the right cerebellum (28). However, lowered FA indicates reduced coherence of fiber orientation, but not necessarily reduced numbers of fibers. DTI and fcMRI are fundamentally different connectivity measures (one detecting BOLD signal correlations in gray matter, the other water diffusion in white matter) and are therefore sensitive to different features of aberrant connectivity in ASD – as also supported by a recent combined fcMRI and DTI study on thalamocortical connectivity (71). Furthermore, fcMRI signal correlations do not rely on monosynaptic connectivity, i.e., a direct fiber tract that would be detected in DTI tractography.
Non-canonical connectivity and preponderance of sensorimotor connectivity in ASD
Additional results highlighted more specific patterns underlying the general cerebro-cerebellar functional overconnectivity in ASD. First, we found a group difference in the general pattern of connectivity, with significantly greater non-canonical connectivity in the ASD than the TD group. This implies that overconnectivity in ASD was in part driven by atypically strong FC between cerebral regions of one type (sensorimotor, supramodal) and cerebellar regions of the other.
Secondly, partial correlation analyses showed a distinct pattern of exclusive overconnectivity for all four sensorimotor ROIs (with a minimal exception for right PMC), but exclusive underconnectivity for the supramodal ROIs (except for IMT; Figure 2B). This indicates specificity of aberrant cerebro-cerebellar connectivity in ASD. Given that sensorimotor connectivity overall matures earlier than supramodal connectivity, the pattern of findings may relate to early white matter overgrowth in children with ASD, as observed in anatomical MRI (72) and DTI studies (73,74). Overgrowth occurring in early childhood, at a time when basic sensorimotor functions are already in place, but supramodal cognition has yet to emerge, may bias cerebro-cerebellar connectivity in ASD towards sensorimotor circuits, at the expense of circuits supporting higher cognitive functions. This interpretation is compatible with models of enhanced perceptual functioning (75) in the context of impaired integrative cognition (76) in ASD. However, cerebellar connectivity has not been previously given much consideration in these models, adding to the significance of our findings.
The observed pattern of atypically increased sensorimotor and decreased supramodal connectivity is compatible with recently reported fronto-cerebellar underconnectivity related to verb generation in language-impaired adolescents with ASD (77). It also appears analogous to earlier cerebral fMRI findings in adults with ASD showing an expansion of simple motor processing into prefrontal and parietal association cortices (78). However, the supramodal underconnectivity effects, as accentuated by partial correlations (Figure 2B), must be understood in the general context of predominant cerebro-cerebellar overconnectivity in ASD (as discussed above), which was highlighted by total correlation results (Figure 2C).
Limitations and unresolved questions
While our study showed significant differences in FC between ASD and TD groups, connectivity measures were not broadly related to diagnostic and sociocommunicative measures. This suggests that aberrant cerebro-cerebellar connectivity – while associated with the disorder itself – accounts only moderately for variability along the autistic spectrum. This is not unexpected, given many other obvious factors of variability (e.g., treatment history), which were probably enhanced by the relatively wide age range studied here. It is indeed likely that maturational changes from childhood into adolescence may affect observed group differences between ASD and TD samples (79). Note also that fcMRI requires high levels of cooperation, limiting samples to the higher functioning end of the spectrum and thus reducing the ability to detect correlates of symptom severity. Further, 9 of the 28 ASD participants were taking psychotropic medications, which may have some effect on the BOLD signal.
Our findings can also not directly speak to the developmental timeline of disturbances in cerebro-cerebellar connectivity. While links with early white matter overgrowth, as described above, appear reasonable, it cannot be ruled out that overconnectivity observed here may reflect secondary and potentially compensatory effects related to experiential plasticity. As also noted above, fcMRI does not uniquely reflect monosynaptic connectivity, which needs to be considered in the context of the complex anatomical circuitry connecting cerebrum and cerebellum, involving basal ganglia, midbrain structures, and thalamus.
The broader picture: The role of the cerebellum in ASD
Our study adds novel evidence to previous observations of anatomical, functional, and biochemical abnormalities of the cerebellum in ASD (8). However, the question remains as to whether these are selective and may play a pivotal role in the developmental emergence of the disorder. A recent study in young adults with ASD showed atypical microglial activation (indicating inflammation), not only in several cerebral regions, but most robustly in left cerebellum (80), possibly suggesting some selectivity. Some of the present findings might indicate a specific cerebellar role in autistic pathology. First, the evidence of predominant overconnectivity differs from many fcMRI findings of predominant underconnectivity within the cerebrum (81). Second, our findings stand in marked contrast with thalamo-cortical underconnectivity we recently reported for a partly overlapping cohort of children and adolescents with ASD (71), suggesting that aberrant connectivity patterns in ASD differ between cerebellum and thalamus. Third, the pattern of exclusive overconnectivity for sensorimotor seeds contrasting with partial underconnectivity for supramodal (‘cognitive’) seeds appears different from fcMRI findings for other parts of the brain. While both over- and underconnectivity have been reported for cerebral connectivity, findings have not followed the same pattern, with reports of underconnectivity for sensory (82) and motor (29) circuits, but overconnectivity for some supramodal cortical seeds (66,83–85). These consideration may indicate a potentially special role of the cerebellum in ASD.
Supplementary Material
Acknowledgments
This study was supported by the National Institutes of Health (R01-MH081023), with additional funding from Autism Speaks Dennis Weatherstone Predoctoral Fellowship #7850 (author AN) and for MRI scanning in 16 participants from the Congressionally Directed Medical Research Programs (CDMRP AR093335, PI: J. Pineda). Special thanks to the children and families who participated and to Brandon Keehn for technical assistance.
Footnotes
Publisher's Disclaimer: This is a PDF file of an unedited manuscript that has been accepted for publication. As a service to our customers we are providing this early version of the manuscript. The manuscript will undergo copyediting, typesetting, and review of the resulting proof before it is published in its final citable form. Please note that during the production process errors may be discovered which could affect the content, and all legal disclaimers that apply to the journal pertain.
All authors report no biomedical financial interests or potential conflicts of interest.
References
- 1.Holmes G. The cerebellum of man. Brain. 1939;62:21–30. [Google Scholar]
- 2.Leiner HC, Leiner AL, Dow RS. Cognitive and language functions of the human cerebellum. Trends in Neuroscience. 1993;16:444–454. doi: 10.1016/0166-2236(93)90072-t. [DOI] [PubMed] [Google Scholar]
- 3.Schmahmann JD. An emerging concept: the cerebellar contribution to higher function. Arch Neurol. 1991;48:1178–1187. doi: 10.1001/archneur.1991.00530230086029. [DOI] [PubMed] [Google Scholar]
- 4.Bostan AC, Dum RP, Strick PL. Cerebellar networks with the cerebral cortex and basal ganglia. Trends Cogn Sci. 2013;17:241–254. doi: 10.1016/j.tics.2013.03.003. [DOI] [PMC free article] [PubMed] [Google Scholar]
- 5.Habas C, Kamdar N, Nguyen D, Prater K, Beckmann CF, Menon V, et al. Distinct cerebellar contributions to intrinsic connectivity networks. J Neurosci. 2009;29:8586–8594. doi: 10.1523/JNEUROSCI.1868-09.2009. [DOI] [PMC free article] [PubMed] [Google Scholar]
- 6.Bauman ML, Kemper TL. Developmental cerebellar abnormalities: a consistent finding in early infantile autism. Neurology. 1986;36:190. [Google Scholar]
- 7.Courchesne E, Yeung-Courchesne R, Press GA, Hesselink JR, Jernigan TL. Hypoplasia of cerebellar vermal lobules VI and VII in autism. N Engl J Med. 1988;318:1349–1354. doi: 10.1056/NEJM198805263182102. [DOI] [PubMed] [Google Scholar]
- 8.Fatemi SH, Aldinger KA, Ashwood P, Bauman ML, Blaha CD, Blatt GJ, et al. Consensus paper: pathological role of the cerebellum in autism. Cerebellum. 2012;11:777–807. doi: 10.1007/s12311-012-0355-9. [DOI] [PMC free article] [PubMed] [Google Scholar]
- 9.Fatemi SH, Halt AR, Realmuto G, Earle J, Kist DA, Thuras P, et al. Purkinje cell size is reduced in cerebellum of patients with autism. Cell Mol Neurobiol. 2002;22:171–175. doi: 10.1023/A:1019861721160. [DOI] [PMC free article] [PubMed] [Google Scholar]
- 10.Bauman ML, Kemper TL. Neuroanatomic observations of the brain in autism: A review and future directions. International Journal of Developmental Neuroscience. 2005;23:183–187. doi: 10.1016/j.ijdevneu.2004.09.006. [DOI] [PubMed] [Google Scholar]
- 11.Ritvo ER, Freeman BJ, Scheibel AB, Duong T, Robinson H, Guthrie D, et al. Lower Purkinje cell counts in the cerebella of four autistic subjects: initial findings of the UCLA-NSAC autopsy research report. AJ Psychiatry. 1986;143:862–866. doi: 10.1176/ajp.143.7.862. [DOI] [PubMed] [Google Scholar]
- 12.Ryu YH, Lee JD, Yoon PH, Kim DI, Lee HB, Shin YJ. Perfusion impairments in infantile autism on technetium-99m ethyl cysteinate dimer brain single-photon emission tomography: comparison with findings on magnetic resonance imaging. Eur J Nucl Med. 1999;26:253–259. doi: 10.1007/s002590050385. [DOI] [PubMed] [Google Scholar]
- 13.Ipser JC, Syal S, Bentley J, Adnams CM, Steyn B, Stein DJ. 1H-MRS in autism spectrum disorders: a systematic meta-analysis. Metab Brain Dis. 2012;27:275–287. doi: 10.1007/s11011-012-9293-y. [DOI] [PubMed] [Google Scholar]
- 14.Hardan AY, Minshew NJ, Harenski K, Keshavan MS. Posterior fossa magnetic resonance imaging in autism. J Am Acad Child Adolesc Psychiatry. 2001;40:666–672. doi: 10.1097/00004583-200106000-00011. [DOI] [PubMed] [Google Scholar]
- 15.Craig MC, Zaman SH, Daly EM, Cutter WJ, Robertson DMW, Hallahan B, et al. Women with autistic-spectrum disorder: Magnetic resonance imaging study of brain anatomy. The British Journal of Psychiatry. 2007;191:224–228. doi: 10.1192/bjp.bp.106.034603. [DOI] [PubMed] [Google Scholar]
- 16.Ke X, Hong S, Tang T, Zou B, Li H, Hang Y, et al. Voxel-based morphometry study on brain structure in children with high-functioning autism. Neuro Report: For Rapid Communication of Neuroscience Research. 2008;19:921–925. doi: 10.1097/WNR.0b013e328300edf3. [DOI] [PubMed] [Google Scholar]
- 17.McAlonan GM, Cheung V, Cheung C, Suckling J, Lam GY, Tai KS, et al. Mapping the brain in autism. A voxel-based MRI study of volumetric differences and intercorrelations in autism. Brain: A Journal of Neurology. 2005;128:268–276. doi: 10.1093/brain/awh332. [DOI] [PubMed] [Google Scholar]
- 18.Courchesne E, Karns CM, Davis HR, Ziccardi R, Carper RA, Tigue ZD, et al. Unusual brain growth patterns in early life in patients with autistic disorder: An MRI study. Neurology. 2001;57:245–254. doi: 10.1212/wnl.57.2.245. [DOI] [PubMed] [Google Scholar]
- 19.Sparks BF, Friedman SD, Shaw DW, Aylward EH, Echelard D, Artru AA, et al. Brain structural abnormalities in young children with autism spectrum disorder. Neurology. 2002;59:184–192. doi: 10.1212/wnl.59.2.184. [DOI] [PubMed] [Google Scholar]
- 20.Hashimoto T, Tayama M, Murakawa K, Yoshimoto T. Development of the brainstem and cerebellum in autistic patients. Journal of Autism and Developmental Disorders. 1995;25:1–18. doi: 10.1007/BF02178163. [DOI] [PubMed] [Google Scholar]
- 21.Webb SJ, Sparks B-F, Friedman SD, Shaw DWW, Giedd J, Dawson G, et al. Cerebellar vermal volumes and behavioral correlates in children with autism spectrum disorder. Psychiatry Research: Neuroimaging. 2009;172:61–67. doi: 10.1016/j.pscychresns.2008.06.001. [DOI] [PMC free article] [PubMed] [Google Scholar]
- 22.Riva D, Annunziata S, Contarino V, Erbetta A, Aquino D, Bulgheroni S. Gray Matter Reduction in the Vermis and CRUS-II Is Associated with Social and Interaction Deficits in Low-Functioning Children with Autistic Spectrum Disorders: a VBM-DARTEL Study. Cerebellum. 2013 doi: 10.1007/s12311-013-0469-8. [DOI] [PubMed] [Google Scholar]
- 23.Piven J, Saliba K, Bailey J, Arndt S. An MRI study of autism: the cerebellum revisited. Neurology. 1997;49:546–551. doi: 10.1212/wnl.49.2.546. [DOI] [PubMed] [Google Scholar]
- 24.Becker EB, Stoodley CJ. Autism spectrum disorder and the cerebellum. Int Rev Neurobiol. 2013;113:1–34. doi: 10.1016/B978-0-12-418700-9.00001-0. [DOI] [PubMed] [Google Scholar]
- 25.Limperopoulos C, Chilingaryan G, Sullivan N, Guizard N, Robertson RL, du Plessis AJ. Injury to the Premature Cerebellum: Outcome is Related to Remote Cortical Development. Cereb Cortex. 2012 doi: 10.1093/cercor/bhs354. [DOI] [PMC free article] [PubMed] [Google Scholar]
- 26.Sivaswamy L, Kumar A, Rajan D, Behen M, Muzik O, Chugani D, et al. A diffusion tensor imaging study of the cerebellar pathways in children with autism spectrum disorder. J Child Neurol. 2010;25:1223–1231. doi: 10.1177/0883073809358765. [DOI] [PubMed] [Google Scholar]
- 27.Shukla DK, Keehn B, Lincoln AJ, Müller R-A. White matter compromise of callosal and subcortical fiber tracts in children with autism spectrum disorder: A diffusion tensor imaging study. Journal of the American Academy of Child & Adolescent Psychiatry. 2010;49:1269–1278. doi: 10.1016/j.jaac.2010.08.018. [DOI] [PMC free article] [PubMed] [Google Scholar]
- 28.Catani M, Jones DK, Daly E, Embiricos N, Deeley Q, Pugliese L, et al. Altered cerebellar feedback projections in Asperger syndrome. Neuroimage. 2008;41:1184–1191. doi: 10.1016/j.neuroimage.2008.03.041. [DOI] [PubMed] [Google Scholar]
- 29.Mostofsky SH, Powell SK, Simmonds DJ, Goldberg MC, Caffo B, Pekar JJ. Decreased connectivity and cerebellar activity in autism during motor task performance. Brain. 2009;132:2413–2425. doi: 10.1093/brain/awp088. [DOI] [PMC free article] [PubMed] [Google Scholar]
- 30.Verly M, Verhoeven J, Zink I, Mantini D, Oudenhove LV, Lagae L, et al. Structural and functional underconnectivity as a negative predictor for language in autism. Hum Brain Mapp. 2013 doi: 10.1002/hbm.22424. [DOI] [PMC free article] [PubMed] [Google Scholar]
- 31.Biswal B, Yetkin FZ, Haughton VM, Hyde JS. Functional connectivity in the motor cortex of resting human brain using echo-planar MRI. Magn Reson Med. 1995;34:537–541. doi: 10.1002/mrm.1910340409. [DOI] [PubMed] [Google Scholar]
- 32.Cordes D, Haughton VM, Arfanakis K, Carew JD, Turski PA, Moritz CH, et al. Frequencies contributing to functional connectivity in the cerebral cortex in “resting-state” data. AJNR Am J Neuroradiol. 2001;22:1326–1333. [PMC free article] [PubMed] [Google Scholar]
- 33.Bullmore E, Sporns O. Complex brain networks: graph theoretical analysis of structural and functional systems. Nature reviews Neuroscience. 2009;10:186–198. doi: 10.1038/nrn2575. [DOI] [PubMed] [Google Scholar]
- 34.Honey CJ, Sporns O, Cammoun L, Gigandet X, Thiran JP, Meuli R, et al. Predicting human resting-state functional connectivity from structural connectivity. Proc Natl Acad Sci U S A. 2009;106:2035–2040. doi: 10.1073/pnas.0811168106. [DOI] [PMC free article] [PubMed] [Google Scholar]
- 35.Greicius MD, Supekar K, Menon V, Dougherty RF. Resting-state functional connectivity reflects structural connectivity in the default mode network. Cerebral Cortex. 2009;19:72–78. doi: 10.1093/cercor/bhn059. [DOI] [PMC free article] [PubMed] [Google Scholar]
- 36.Smith SM, Fox PT, Miller KL, Glahn DC, Fox PM, Mackay CE, et al. Correspondence of the brain’s functional architecture during activation and rest. Proc Natl Acad Sci U S A. 2009;106:13040–13045. doi: 10.1073/pnas.0905267106. [DOI] [PMC free article] [PubMed] [Google Scholar]
- 37.Greicius MD, Krasnow B, Reiss AL, Menon V. Functional connectivity in the resting brain: a network analysis of the default mode hypothesis. Proc Natl Acad Sci U S A. 2003;100:253–258. doi: 10.1073/pnas.0135058100. [DOI] [PMC free article] [PubMed] [Google Scholar]
- 38.Beckmann CF, DeLuca M, Devlin JT, Smith SM. Investigations into resting-state connectivity using independent component analysis. Philos Trans R Soc Lond B Biol Sci. 2005;360:1001–1013. doi: 10.1098/rstb.2005.1634. [DOI] [PMC free article] [PubMed] [Google Scholar]
- 39.Stoodley CJ, Desmond JE, Schmahmann JD. Functional topography of the cerebellum revealed by functional neuroimaging studies. In: Manto MU, Gruol DL, Schmahmann JD, Koibuchi N, Rossi D, editors. Handbook of the Cerebellum and Cerebellar Disorders. Springer; 2012. [Google Scholar]
- 40.O’Reilly JX, Beckmann CF, Tomassini V, Ramnani N, Johansen-Berg H. Distinct and overlapping functional zones in the cerebellum defined by resting state functional connectivity. Cereb Cortex. 2010;20:953–965. doi: 10.1093/cercor/bhp157. [DOI] [PMC free article] [PubMed] [Google Scholar]
- 41.Stoodley CJ. The Cerebellum and Cognition: Evidence from Functional Imaging Studies. Cerebellum. 2011 doi: 10.1007/s12311-011-0260-7. [DOI] [PubMed] [Google Scholar]
- 42.American Psychiatric Association. Diagnostic and Statistical Manual of Mental Disorders - IV - TR. 4th. Washington, DC: American Psychiatric Association; 2000. [Google Scholar]
- 43.Lord C, Rutter M, Le Couteur A. Autism diagnostic interview-revised: a revised version of a diagnostic interview for caregivers of individuals with possible pervasive developmental disorders. J Autism Dev Disord. 1994;24:659–685. doi: 10.1007/BF02172145. [DOI] [PubMed] [Google Scholar]
- 44.Lord C, Rutter M, DiLavore P, Risi S. Autism Diagnostic Observation Schedule. Los Angeles: Western Psychological Services; 2001. [Google Scholar]
- 45.Oldfield RC. The assessment and analysis of handedness: the Edinburgh inventory. Neuropsychologia. 1971;9:97–113. doi: 10.1016/0028-3932(71)90067-4. [DOI] [PubMed] [Google Scholar]
- 46.Wechsler D. Wechsler Abbreviated Scale of Intelligence (WASI) San Antonio, Texas: Psychological Corporation; 1999. [Google Scholar]
- 47.Constantino JN, Gruber CP. Social Responsiveness Scale. Los Angeles, CA: Western Psychological Services; 2005. [Google Scholar]
- 48.Cox RW. AFNI: Software for analysis and visualization of functional magnetic resonance neuroimages. Comput Biomed Res. 1996;29:162–173. doi: 10.1006/cbmr.1996.0014. [DOI] [PubMed] [Google Scholar]
- 49.Power JD, Mitra A, Laumann TO, Snyder AZ, Schlaggar BL, Petersen SE. Methods to detect, characterize, and remove motion artifact in resting state fMRI. Neuroimage. 2014;84:320–341. doi: 10.1016/j.neuroimage.2013.08.048. [DOI] [PMC free article] [PubMed] [Google Scholar]
- 50.Schölvinck ML, Maier A, Ye FQ, Duyn JH, Leopold DA. Neural basis of global resting-state fMRI activity. Proc Natl Acad Sci U S A. 2010;107:10238–10243. doi: 10.1073/pnas.0913110107. [DOI] [PMC free article] [PubMed] [Google Scholar]
- 51.Gotts SJ, Saad ZS, Jo HJ, Wallace GL, Cox RW, Martin A. The perils of global signal regression for group comparisons: a case study of Autism Spectrum Disorders. Frontiers in Human Neuroscience. 2013;7:356. doi: 10.3389/fnhum.2013.00356. [DOI] [PMC free article] [PubMed] [Google Scholar]
- 52.Saad ZS, Gotts SJ, Murphy K, Chen G, Jo HJ, Martin A, et al. Trouble at rest: how correlation patterns and group differences become distorted after global signal regression. Brain Connectivity. 2012;2:25–32. doi: 10.1089/brain.2012.0080. [DOI] [PMC free article] [PubMed] [Google Scholar]
- 53.Power JD, Barnes KA, Snyder AZ, Schlaggar BL, Petersen SE. Spurious but systematic correlations in functional connectivity MRI networks arise from subject motion. NeuroImage. 2012;59:2142–2154. doi: 10.1016/j.neuroimage.2011.10.018. [DOI] [PMC free article] [PubMed] [Google Scholar]
- 54.Satterthwaite TD, Elliott MA, Gerraty RT, Ruparel K, Loughead J, Calkins ME, et al. An improved framework for confound regression and filtering for control of motion artifact in the preprocessing of resting-state functional connectivity data. Neuroimage. 2013;64:240–256. doi: 10.1016/j.neuroimage.2012.08.052. [DOI] [PMC free article] [PubMed] [Google Scholar]
- 55.Forman SD, Cohen JD, Fitzgerald M, Eddy WF, Mintun MA, Noll DC. Improved assessment of significant activation in functional magnetic resonance imaging (fMRI): use of a cluster-size threshold. Magn Reson Med. 1995;33:636–647. doi: 10.1002/mrm.1910330508. [DOI] [PubMed] [Google Scholar]
- 56.Woo CW, Krishnan A, Wager TD. Cluster-extent based thresholding in fMRI analyses: pitfalls and recommendations. Neuroimage. 2014;91:412–419. doi: 10.1016/j.neuroimage.2013.12.058. [DOI] [PMC free article] [PubMed] [Google Scholar]
- 57.Buckner RL, Krienen FM, Castellanos A, Diaz JC, Yeo BT. The organization of the human cerebellum estimated by intrinsic functional connectivity. J Neurophysiol. 2011;106:2322–2345. doi: 10.1152/jn.00339.2011. [DOI] [PMC free article] [PubMed] [Google Scholar]
- 58.Stoodley CJ, Valera EM, Schmahmann JD. Functional topography of the cerebellum for motor and cognitive tasks: An fMRI study. Neuroimage. 2012;59:1560–1570. doi: 10.1016/j.neuroimage.2011.08.065. [DOI] [PMC free article] [PubMed] [Google Scholar]
- 59.Bushara KO, Wheat JM, Khan A, Mock BJ, Turski PA, Sorenson J, et al. Multiple tactile maps in the human cerebellum. Neuroreport. 2001;12:2483–2486. doi: 10.1097/00001756-200108080-00039. [DOI] [PubMed] [Google Scholar]
- 60.Ilg W, Giese MA, Gizewski ER, Schoch B, Timmann D. The influence of focal cerebellar lesions on the control and adaptation of gait. Brain. 2008;131:2913–2927. doi: 10.1093/brain/awn246. [DOI] [PubMed] [Google Scholar]
- 61.Ramnani N. The primate cortico-cerebellar system: anatomy and function. Nature reviews Neuroscience. 2006;7:511–522. doi: 10.1038/nrn1953. [DOI] [PubMed] [Google Scholar]
- 62.Schmahmann JD. The Cerebellum and Cognition. San Diego: Academic Press; 1997. [Google Scholar]
- 63.Müller R-A, Shih P, Keehn B, Deyoe JR, Leyden KM, Shukla DK. Underconnected, but how? A survey of functional connectivity MRI studies in autism spectrum disorders. Cereb Cortex. 2011;21:2233–2243. doi: 10.1093/cercor/bhq296. [DOI] [PMC free article] [PubMed] [Google Scholar]
- 64.Nair A, Keown CL, Datko M, Shih P, Keehn B, Müller RA. Impact of methodological variables on functional connectivity findings in autism spectrum disorders. Hum Brain Mapp. 2014;35:4035–4048. doi: 10.1002/hbm.22456. [DOI] [PMC free article] [PubMed] [Google Scholar]
- 65.Di Martino A, Kelly C, Grzadzinski R, Zuo XN, Mennes M, Mairena MA, et al. Aberrant striatal functional connectivity in children with autism. Biol Psychiatry. 2011;69:847–856. doi: 10.1016/j.biopsych.2010.10.029. [DOI] [PMC free article] [PubMed] [Google Scholar]
- 66.Shih P, Keehn B, Oram JK, Leyden KM, Keown CL, Müller R-A. Functional differentiation of posterior superior temporal sulcus in autism: A functional connectivity magnetic resonance imaging study. Biol Psychiatry. 2011;70:270–277. doi: 10.1016/j.biopsych.2011.03.040. [DOI] [PMC free article] [PubMed] [Google Scholar]
- 67.Supekar K, Uddin LQ, Khouzam A, Phillips J, Gaillard WD, Kenworthy LE, et al. Brain hyperconnectivity in children with autism and its links with social deficits. Cell Reports. 2013;5 doi: 10.1016/j.celrep.2013.10.001. [DOI] [PMC free article] [PubMed] [Google Scholar]
- 68.Fair DA, Cohen AL, Dosenbach NU, Church JA, Miezin FM, Barch DM, et al. The maturing architecture of the brain’s default network. Proc Natl Acad Sci U S A. 2008;105:4028–4032. doi: 10.1073/pnas.0800376105. [DOI] [PMC free article] [PubMed] [Google Scholar]
- 69.Lewis CM, Baldassarre A, Committeri G, Romani GL, Corbetta M. Learning sculpts the spontaneous activity of the resting human brain. Proc Natl Acad Sci U S A. 2009;106:17558–17563. doi: 10.1073/pnas.0902455106. [DOI] [PMC free article] [PubMed] [Google Scholar]
- 70.Shukla DK, Keehn B, Lincoln AJ, Müller R-A. White matter compromise of callosal and subcortical fiber tracts in children with autism spectrum disorder: a diffusion tensor imaging study. J Am Acad Child Adolesc Psychiatry. 2010;49:1269–1278. 1278 e1261–1262. doi: 10.1016/j.jaac.2010.08.018. [DOI] [PMC free article] [PubMed] [Google Scholar]
- 71.Nair A, Treiber JM, Shukla DK, Shih P, Müller R-A. Thalamocortical connectivity in autism spectrum disorder: A study of functional and anatomical connectivity. Brain. 2013;136:1942–1955. doi: 10.1093/brain/awt079. [DOI] [PMC free article] [PubMed] [Google Scholar]
- 72.Courchesne E, Campbell K, Solso S. Brain growth across the life span in autism: age-specific changes in anatomical pathology. Brain Res. 2011;1380:138–145. doi: 10.1016/j.brainres.2010.09.101. [DOI] [PMC free article] [PubMed] [Google Scholar]
- 73.Weinstein M, Ben-Sira L, Levy Y, Zachor DA, Ben Itzhak E, Artzi M, et al. Abnormal white matter integrity in young children with autism. Hum Brain Mapp. 2011;32:534–543. doi: 10.1002/hbm.21042. [DOI] [PMC free article] [PubMed] [Google Scholar]
- 74.Wolff JJ, Gu H, Gerig G, Elison JT, Styner M, Gouttard S, et al. Differences in white matter fiber tract development present from 6 to 24 months in infants with autism. A J Psychiatry. 2012;169:589–600. doi: 10.1176/appi.ajp.2011.11091447. [DOI] [PMC free article] [PubMed] [Google Scholar]
- 75.Mottron L, Dawson M, Soulieres I, Hubert B, Burack J. Enhanced perceptual functioning in autism: an update, and eight principles of autistic perception. J Autism Dev Disord. 2006;36:27–43. doi: 10.1007/s10803-005-0040-7. [DOI] [PubMed] [Google Scholar]
- 76.Minshew NJ, Sweeney J, Luna B. Autism as a selective disorder of complex information processing and underdevelopment of neocortical systems. Mol Psychiatry. 2002;7(Suppl 2):S14–15. doi: 10.1038/sj.mp.4001166. [DOI] [PubMed] [Google Scholar]
- 77.Verly M, Verhoeven J, Zink I, Mantini D, Peeters R, Deprez S, et al. Altered functional connectivity of the language network in ASD: Role of classical language areas and cerebellum. NeuroImage Clinical. 2014;4:374–382. doi: 10.1016/j.nicl.2014.01.008. [DOI] [PMC free article] [PubMed] [Google Scholar]
- 78.Müller R-A, Kleinhans N, Kemmotsu N, Pierce K, Courchesne E. Abnormal variability and distribution of functional maps in autism: an FMRI study of visuomotor learning. A J Psychiatry. 2003;160:1847–1862. doi: 10.1176/appi.ajp.160.10.1847. [DOI] [PubMed] [Google Scholar]
- 79.Uddin LQ, Supekar K, Menon V. Reconceptualizing functional brain connectivity in autism from a developmental perspective. Frontiers in Human Neuroscience. 2013;7:458. doi: 10.3389/fnhum.2013.00458. [DOI] [PMC free article] [PubMed] [Google Scholar]
- 80.Suzuki K, Sugihara G, Ouchi Y, Nakamura K, Futatsubashi M, Takebayashi K, et al. Microglial activation in young adults with autism spectrum disorder. JAMA Psychiatry. 2013;70:49–58. doi: 10.1001/jamapsychiatry.2013.272. [DOI] [PubMed] [Google Scholar]
- 81.Vissers ME, Cohen MX, Geurts HM. Brain connectivity and high functioning autism: A promising path of research that needs refined models, methodological convergence, and stronger behavioral links. Neurosci Biobehav Rev. 2012;36:604–625. doi: 10.1016/j.neubiorev.2011.09.003. [DOI] [PubMed] [Google Scholar]
- 82.Villalobos ME, Mizuno A, Dahl BC, Kemmotsu N, Müller R-A. Reduced functional connectivity between V1 and inferior frontal cortex associated with visuomotor performance in autism. Neuroimage. 2005;25:916–925. doi: 10.1016/j.neuroimage.2004.12.022. [DOI] [PMC free article] [PubMed] [Google Scholar]
- 83.Lynch CJ, Uddin LQ, Supekar K, Khouzam A, Phillips J, Menon V. Default Mode Network in Childhood Autism: Posteromedial Cortex Heterogeneity and Relationship with Social Deficits. Biol Psychiatry. 2013 doi: 10.1016/j.biopsych.2012.12.013. [DOI] [PMC free article] [PubMed] [Google Scholar]
- 84.Shen MD, Shih P, Ottl B, Keehn B, Leyden KM, Gaffrey MS, et al. Atypical lexicosemantic function of extrastriate cortex in autism spectrum disorder: Evidence from functional and effective connectivity. Neuroimage. 2012;62:1780–1791. doi: 10.1016/j.neuroimage.2012.06.008. [DOI] [PMC free article] [PubMed] [Google Scholar]
- 85.Fishman I, Keown CL, Lincoln AJ, Pineda JA, Müller R-A. Atypical Cross Talk Between Mentalizing and Mirror Neuron Networks in Autism Spectrum Disorder. JAMA Psychiatry. 2014;71 doi: 10.1001/jamapsychiatry.2014.83. [DOI] [PMC free article] [PubMed] [Google Scholar]
Associated Data
This section collects any data citations, data availability statements, or supplementary materials included in this article.