

Abstract
Liver fibrosis is a hallmark of chronic liver disease characterized by the excessive accumulation of extracellular matrix proteins. Although liver biopsy is the reference standard for diagnosis and staging of liver fibrosis, it has some limitations, including potential pain, sampling variability, and low patient acceptance. Hence, there has been an effort to develop noninvasive imaging techniques for diagnosis, staging, and monitoring of liver fibrosis. Many quantitative techniques have been implemented on magnetic resonance imaging (MRI) for this indication. The most widely validated technique is magnetic resonance elastography, which aims to measure viscoelastic properties of the liver and relate them to fibrosis stage. Several additional MRI methods have been developed or adapted to liver fibrosis quantification. Diffusion-weighted imaging measures the Brownian motion of water molecules which is restricted by collagen fibers. Texture analysis assesses the changes in the texture of liver parenchyma associated with fibrosis. Perfusion imaging relies on signal intensity and pharmacokinetic models to extract quantitative perfusion parameters. Hepatocellular function, which decreases with increasing fibrosis stage, can be estimated by the uptake of hepatobiliary contrast agents. Strain imaging measures liver deformation in response to physiological motion such as cardiac contraction. T1ρ quantification is an investigational technique, which measures the spin-lattice relaxation time in the rotating frame. This article will review the MRI techniques used in liver fibrosis staging, their advantages and limitations, and diagnostic performance. We will briefly discuss future directions, such as longitudinal monitoring of disease, prediction of portal hypertension, and risk stratification of hepatocellular carcinoma.
Keywords: elastography, liver fibrosis, magnetic resonance, review article
Liver fibrosis is a hallmark of chronic liver disease, characterized by the excessive accumulation of extracellular matrix proteins. If the underlying cause of chronic liver disease is untreated, liver fibrosis may progress to cirrhosis which constitutes the most important risk factor for hepatocellular carcinoma (HCC).1 Liver fibrosis must be diagnosed and staged accurately as it informs treatment decision and prioritization of intervention by clinicians. Some treatments have shown to slow down or reverse the progression of fibrosis in its early stages.2
Although liver biopsy is the reference standard for the diagnosis and staging of liver fibrosis, it is associated with pitfalls such as its invasiveness, high sampling variability, and low patient acceptance.3,4 Hence, there is a need for noninvasive techniques to assess liver fibrosis, especially in its early stages before the advent of complications. Several imaging techniques, implemented on ultrasound, computed tomography, and magnetic resonance imaging (MRI), have been proposed in recent years for quantitative assessment of liver fibrosis. Worldwide, ultrasound-based elastography techniques are arguably the most widely used. For the purpose of this review, we will focus on MRI-based techniques for liver fibrosis quantification.
This article will briefly review the clinical background of liver fibrosis. MRI-based techniques will be discussed, including magnetic resonance elastography (MRE), diffusion-weighted imaging, texture analysis, perfusion imaging, hepatocellular function assessment, strain imaging, and T1ρ imaging. For each technique, we will provide a general description of the physical concept, discuss their advantages and limitations, and summarize their diagnostic performance.
LIVER FIBROSIS: BIOLOGICAL BACKGROUND
Pathophysiology
Liver fibrosis is a wound healing response to acute or chronic liver diseases.5 Liver injury induces inflammation, which transforms hepatic stellate cells from their quiescent state to proliferative, fibrogenic, and contractile myofibroblasts.6 These activated hepatic stellate cells produce extracellular matrix proteins (such as collagen, laminin, elastin, and fibronectin) which lead to fibrosis deposition.7 Liver fibrosis is characterized by an excessive accumulation of these proteins (fibrogenesis) not balanced by matrix degradation by enzymes over time.
Liver fibrosis may progress to cirrhosis, the end stage, which constitutes the most important risk factor for developing HCC.8 Liver cirrhosis is associated with additional complications such as portal hypertension, bleeding of esophageal varices, ascites, hepatic encephalopathy, and thrombosis in the portal venous system. Early detection and treatment of the underlying cause of liver disease is critical because liver transplantation constitutes the only curative therapy for decompensated liver cirrhosis.
Epidemiology
Worldwide, chronic liver disease and cirrhosis accounted for 1.3 million deaths in 2015.9 In the United States, chronic liver disease and cirrhosis are listed as the 10th leading cause of death, accounting for 25,000 annual deaths.10 All causes of chronic liver disease may lead to liver fibrosis, including chronic viral hepatitis (caused by hepatitis B, C, and D), alcoholic liver disease, nonalcoholic fatty liver disease (NAFLD), hemochromatosis, alpha-1 antitrypsin deficiency, Wilson disease, primary biliary cirrhosis, primary sclerosing cholangitis, and autoimmune hepatitis.
The arrival of new effective antiviral therapy for hepatitis C,11 systematic screening of hepatitis B and C viruses in blood products, and vaccination campaigns may reduce the incidence and prevalence of liver fibrosis associated with viral hepatitis. However, the incidence of liver fibrosis associated to NAFLD is expected to rise in parallel to the high prevalence of type 2 diabetes and obesity observed worldwide.12–14
Liver Biopsy and Staging
Liver biopsy is the reference standard for diagnosis and staging of liver fibrosis.4 The amount and distribution of fibrous tissue in the hepatic lobule are assessed visually on histopathology slides. Different liver fibrosis staging systems are used depending on the cause of underlying chronic liver disease. Some of the most frequently used staging systems include the METAVIR,15 Ishak,16,17 and Laennec systems18 for hepatitis B and C, and Brunt system for NAFLD and nonalcoholic steatohepatitis.19 The Laennec system is a modification of the METAVIR system that refines the classification of cirrhosis into 3 groups based on the thickness of the fibrous septa and the size of nodules. Unlike the METAVIR and Brunt systems, which assign scores from 0 to 4, the Ishak system assigns scores from 0 to 6, and the Laennec from 0 to 4 with further subdivisions (4A, 4B, and 4C) for cirrhosis.
In the radiology literature, as in several histological scoring systems for fibrosis, it is a common practice to report (or when necessary convert) the liver fibrosis stage on a scale from 0 to 4, where F0 indicates the absence of fibrosis; F1, minimal fibrosis distributed in the perisinusoidal or periportal areas; F2, significant fibrosis with portal fibrosis and a few bridges between portal areas or hepatic veins; F3, severe bridging fibrosis with architectural distorsion; and F4, liver cirrhosis with fibrosis delineating regenerative nodules16–19 (Fig. 1).
FIGURE 1.
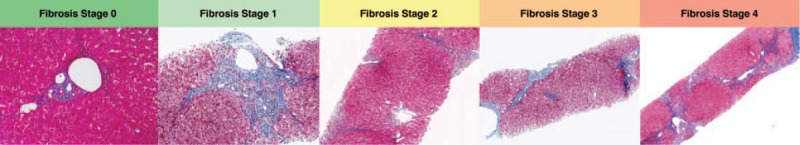
Examples of biopsy samples from patients with hepatitis C and fibrosis stages 0 to 4 according to the METAVIR staging system based on Masson's trichrome stain (2.5× to 10× magnification). Fibrosis stage 0: no fibrosis; fibrosis stage 1: mild portal and periportal fibrosis; fibrosis stage 2: portal fibrosis with few septa; fibrosis stage 3: more severe bridging fibrosis; and F4: cirrhosis. Figure 1 can be viewed online in color at www.topicsinmri.com.
Advantages of liver biopsy include direct assessment of liver fibrosis stage on tissue specimen, ability to assess histopathological features other than liver fibrosis, such as liver inflammation, steatosis, iron deposition, biliary disease, and overlap syndromes.20,21 Limitations of liver biopsy include sampling variability due to disease inhomogeneity,22 invasiveness of the procedure,23 possible complications such as pain and bleeding,23,24 reluctance from patients and physicians,25,26 cost of procedure, and limited ability to perform longitudinal monitoring of disease. These potential limitations of liver biopsy underscore the clinical need for noninvasive imaging techniques for diagnosis, staging, and monitoring of liver fibrosis.
MAGNETIC RESONANCE IMAGING TECHNIQUES FOR FIBROSIS QUANTIFICATION
We provide a description of the physical concepts of each MRI technique for fibrosis quantification and discuss their advantages and limitations below. We also report their diagnostic performance, which is summarized in Table 1.
TABLE 1.
Diagnostic Performance of MRI Techniques for Liver Fibrosis Quantification
| Fibrosis Stage ≥1 | Fibrosis Stage ≥2 | Fibrosis Stage ≥3 | Fibrosis Stage 4 | ||||||||||
| Technique | Study | Sensitivity | Specificity | AUC | Sensitivity | Specificity | AUC | Sensitivity | Specificity | AUC | Sensitivity | Specificity | AUC |
| Magnetic resonance elastography | Wang et al, 201227 | 0.83 | 0.99 | 0.95 | 0.94 | 0.95 | 0.98 | 0.92 | 0.96 | 0.98 | 0.99 | 0.94 | 0.99 |
| Singh et al, 201528 | 0.73 | 0.79 | 0.84 | 0.79 | 0.81 | 0.88 | 0.85 | 0.85 | 0.93 | 0.91 | 0.81 | 0.92 | |
| Guo et al, 201529 | 0.87 | 0.93 | 0.94 | 0.87 | 0.94 | 0.97 | 0.87 | 0.92 | 0.96 | 0.93 | 0.91 | 0.97 | |
| Diffusion-weighted imaging | Wang et al, 201227 | 0.81 | 0.82 | 0.86 | 0.77 | 0.78 | 0.83 | 0.72 | 0.84 | 0.86 | — | — | — |
| Jiang et al, 201630 | 0.78 | 0.78 | 0.86 | 0.81 | 0.8 | 0.88 | 0.71 | 0.84 | 0.88 | 0.8 | 0.77 | 0.86 | |
| Texture | |||||||||||||
| Unenhanced | House et al, 201531 | — | — | 0.78–0.87 | — | — | — | — | — | — | — | — | — |
| Kato et al, 200732 | — | — | 0.53–0.60 | — | — | — | — | — | — | — | — | — | |
| Double enhanced | Aguirre et al, 200633 | — | — | — | — | — | — | — | — | 0.82–0.89 | — | — | — |
| Bahl et al, 201234 | — | — | — | — | — | — | 0.919 | 0.839 | — | — | — | — | |
| Yokoo et al, 201535 | 0.659 | 0.8 | 0.814 | 0.895 | 0.778 | 0.889 | 0.778 | 0.784 | 0.862 | 1 | 0.93 | 0.976 | |
| Gd enhanced | Kato et al, 200732 | — | — | 0.62–0.80 | — | — | — | — | — | — | — | — | — |
| Superparamagnetic iron oxide enhanced | Aguirre et al, 200633 | — | — | — | — | — | — | — | — | 0.40–0.84 | — | — | — |
| Perfusion imaging | Hagiwara et al, 200836 | — | — | — | — | — | — | 0.31–0.92 | 0.64–1.00 | 0.61–0.82 | — | — | — |
| Ou et al, 201337 | 0.78 | 0.84 | 0.83 | 0.90 | 0.77 | 0.85 | 0.81 | 0.85 | 0.88 | 0.80 | 0.89 | 0.92 | |
| Patel et al, 201038 | — | — | — | — | — | — | — | — | — | 0.50–1.00 | 0.50–1.00 | 0.57–0.95 | |
| Hepatocellular function imaging | Choi et al, 201339 | 0.46 | 0.85 | — | 0.46 | 0.82 | — | 0.63 | 0.68 | — | 0.76 | 0.65 | — |
| Feier et al, 201340 | 0.70 | 0.85 | 0.81 | 0.75 | 0.77 | 0.82 | 0.73 | 0.87 | 0.85 | 0.83 | 0.80 | 0.83 | |
| Goshima et al, 201241 | 1.00 | 0.73 | 0.91 | 1.00 | 0.87 | 0.96 | 0.74 | 0.98 | 0.93 | 0.91 | 1.00 | 0.97 | |
| Motosugi et al, 201142 | 0.87 | 0.75 | 0.82 | 0.75 | 0.56 | 0.68 | 0.75 | 0.50 | 0.63 | 0.82 | 0.49 | 0.62 | |
| T1ρ | Allkemper et al, 201443 | — | — | — | — | — | — | — | — | — | 1.00 | 0.84 | 0.97 |
Adapted from Petitclerc et al.44.
AUC indicates area under the receiver operating characteristic curve.
MAGNETIC RESONANCE ELASTOGRAPHY
Description
MRE is a technique used to measure the mechanical properties of tissues (such as stiffness, elasticity, and viscosity) by acquiring images of the propagation of a shear wave created by an external source of motion. MRE requires several components to generate mechanical waves, acquire MR images of wave motion, and produce quantitative maps of liver stiffness. Briefly, an external driver is necessary to create the mechanical waves, a phase-contrast pulse sequence with motion-encoding gradients to encode tissue motion, postprocessing to track wave length and amplitude, and inversion algorithms to create quantitative maps of tissue stiffness (also known as elastograms) (Fig. 2).
FIGURE 2.
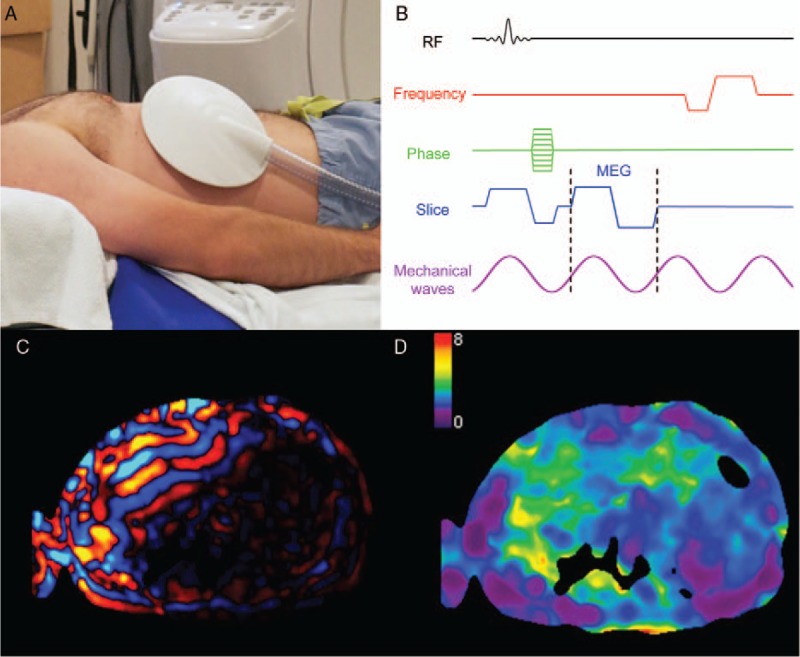
Illustration of the steps involved in magnetic resonance elastography. A, The passive driver (shown) is positioned over the patient's liver and secured with an elastic band under a phased-array torso coil (not shown). B, The induced vibrations create shear waves which are phase encoded with bipolar motion encoding gradients (MEG) shown on this MRE pulse sequence diagram. C, A shear wave image is shown, with positive amplitude values represented in red and negative values in blue. D, Elastograms are calculated by solving an inverse problem and represent the liver stiffness (illustrated on a scale from 0 to 8 kPa in this example). Figure 2 can be viewed online in color at www.topicsinmri.com.
Driver
The driver is the hardware component which induces periodical shear waves into the liver tissue. While many driver designs are possible,45 the most widely used implementation relies on an acoustic design commercialized by Resoundant (Rochester, MN) and standardized across major MRI manufacturers. In this design, an active driver is located outside the examination room, in the equipment room. It creates air compression waves which are transmitted through a plastic tube to the passive driver place on the patient's abdomen. The compression waves are then converted to shear waves by a process known as mode conversion.46 Other designs may induce shear waves directly. Some of these involve a driver inside the examination room, far enough from the bore to reduce electromagnetic interference. The movement is transmitted mechanically to the patient using a rod or arm made of an MR-safe material. There are also drivers which are placed directly on the patient inside the bore, such a piezoelectric drivers. The vibrations used are either mono- or multifrequency.46 The most frequently used commercial implementation relies on a single 60 Hz frequency.47
Phase-contrast Pulse Sequence
The pulse sequence encodes the shear wave motion by using bipolar gradients with alternating polarity, typically at the wave frequency. These motion encoding gradients encode wave amplitudes in the order of tens of microns into the phase of the signal.48 Both sinusoidal and trapezoidal gradient shapes have been used for this purpose.49 The phase of the magnetization is proportional to the amplitude of the mechanical wave propagated in tissue.48 Many pulse sequences have been applied successfully to MRE: balanced steady-state free precession,50 spin-echo,51 gradient-recalled echo,52 and echo-planar imaging.53 Phase images are used to calculate the tissue displacements and magnitude images as anatomical reference. Acquisitions are repeated with different phase offsets between the mechanical waves and motion encoding gradients to create cine wave images that reveal amplitude, wavelength, and direction of shear-wave propagation.
Postprocessing
A curl operator is used to remove the compression wave component and retain shear waves only. Subsequently, an inversion algorithm is applied to shear wave images to compute a stiffness map known as an elastogram that represents the magnitude of the complex shear modulus |G|.48,54 In a research setting, some have reported separate quantitative maps for the storage modulus and loss modulus (G′ and G′′) components of the shear complex modulus. Of note, these mechanical properties are independent of magnetic field strength; hence, results and diagnostic thresholds are comparable at 1.5 and 3.0 T.55
Measurement
From these mechanical properties maps, a single value needs to be extracted for the purpose of fibrosis staging. This is done by averaging the mechanical properties over a region of interest (ROI), carefully drawn to avoid the liver capsule and vessels. Research on algorithms for artifact correction and liver tissue segmentation may soon automate this process.56 Higher liver stiffness is associated with higher fibrosis stages, as fibrosis tends to render the tissue stiffer as the stage increases. Shear stiffness thresholds have been proposed for liver fibrosis staging, but these thresholds vary between studies depending on the underlying cause of chronic liver disease and technique used (eg, gradient-recalled echo vs echo planar imaging, 2D vs 3D acquisition, 40 vs 60 Hz MRE) (Table 2).
TABLE 2.
Summary of Proposed Liver Stiffness Thresholds (kPa) as Measured by MRE for Fibrosis Staging
| Liver Fibrosis Stage | ||||||
| Population | Study | Technique | ≥1 | ≥2 | ≥3 | 4 |
| Chronic liver disease and volunteers | Yin et al, 200747 | 2D GRE at 60 Hz | 2.93 | 4.89 | 6.47 | |
| Choi et al, 201357 | 2D GRE at 60 Hz | 2.9 | 3.0 | 3.4 | 4.0 | |
| Ichikawa et al, 201458 | 2D GRE at 60 Hz | 2.60 | 2.80 | 3.60 | 4.00 | |
| All liver MRI patients | Yoshimitsu et al, 201659 | 2D SE-EPI at 60 Hz | 3.13 | 3.85 | 4.28 | 5.38 |
| Chronic hepatitis B | Venkatesh et al, 201460 | 2D GRE at 60 Hz | 2.74 | 3.20 | 3.70 | 4.33 |
| Chang et al, 201661 | 2D GRE at 60 Hz | 2.56 | 2.57 | 2.92 | 3.67 | |
| Lee et al, 201462 | 2D GRE at 60 Hz | 2.45 | 2.69 | 3.04 | 3.94 | |
| Hennedige et al, 201663 | Modified GRE sequence | — | 3.2 | 3.7 | 4.33 | |
| Ichikawa et al, 201264 | 2D GRE at 60 Hz | 2.30 | 3.20 | 4.00 | 4.60 | |
| Chronic hepatitis B or C | Shi et al, 201665 | 2D GRE at 60 Hz | 3.08 | 3.13 | 3.74 | 4.18 |
| 3D SE-EPI at 60 Hz | 2.45 | 2.79 | 3.28 | 3.57 | ||
| NAFLD and NASH | Chen et al, 201166 | 2D GRE at 60 Hz | <2.74 (Steatosis) | >2.74 (NASH) | ||
| Kim et al, 201367 | 2D GRE at 60 Hz | — | >4.15 | |||
| Loomba et al, 201468 | 2D GRE at 60 Hz | 3.02 | 3.58 | 3.64 | 4.67 | |
| Singh et al, 201669 | Pooled analysis from 9 MRE studies at 60–62.5 Hz | 2.88 | 3.54 | 3.77 | 4.09 | |
| Imajo et al, 201670 | 2D GRE at 60 Hz | 2.5 | 3.4 | 4.8 | 6.7 | |
| Loomba et al, 201671 | 2D GRE at 60 Hz | — | — | 3.80 | — | |
| 3D GRE at 60 Hz | — | — | 3.40 | — | ||
| 3D GRE at 40 Hz | — | — | 2.43 | — | ||
| Alpha-1 antitrypsin deficiency | Kim et al, 201672 | 2D GRE at 60 Hz | 3.0 | — | — | — |
| Autoimmune hepatitis | Wang et al, 201773 | 2D GRE at 60 Hz | — | — | 4.1 | 4.5 |
| Severe to morbid obesity | Chen et al, 201774 | 2D GRE at 60 Hz | 2.60 | 3.50 | 3.60 | 4.52 |
EPI indicates echo planar imaging; GRE, gradient-recalled echo; NAFLD, nonalcoholic fatty liver disease; NASH, nonalcoholic steatohepatitis.
Advantages and Limitations
MRE has been standardized and shows repeatable results across sites.75,76 It has also shown higher diagnostic performance than ultrasound elastography methods in head-to-head comparisons and than any other method described in this review. MRE also has the advantage of being technically feasible in larger patients or those with ascites.77
However, MRE is associated with several biological confounders such as concomitant liver steatosis, inflammation, cholestasis, hepatic venous congestion, postprandial state, and right heart failure.78 Except for liver steatosis, most of these confounders elevate liver stiffness, which may lead to overestimation of fibrosis stage. MRE may be affected by moderate to severe iron deposition in the liver, which leads to low signal-to-noise ratio and sometimes inconclusive measurements. This effect is accentuated by larger field strengths and when using gradient-echo–based sequences.79 Finally, MRE requires additional hardware.80
Diagnostic Performance
According to four meta-analyses27,69,81,82 that include a total of 19 studies and 1441 patients, MRE shows high diagnostic performance for staging liver fibrosis. The area under the receiving characteristic curves (AUCs) are in the range of (0.84–0.95), (0.88–0.98), (0.93–0.98), and (0.92–0.99) for classification of liver fibrosis stage ≥1, ≥2, ≥3, and 4, respectively. MRE has been shown to offer greater diagnostic performance than US elastography techniques in general as well as in head-to-head comparisons.83,84
DIFFUSION-WEIGHTED IMAGING
Description
Diffusion-weighted imaging (DWI) measures the Brownian motion of water molecules. This is accomplished by applying bipolar gradients with equal positive and negative surface areas or, equivalently and most frequently, by using a spin-echo sequence with identical gradients on both side of the refocussing pulse. This results in dephasing, followed by complete rephasing of the magnetization of stationary spins. Moving spins, however, do not recover full magnetization as they accumulate phase offsets. When the many dephased spins in the voxel are combined, the result is phase dispersion which reduces the magnitude of the signal. The tissue signal is plotted as a function of the b value, which is a factor that defines the gradient strength and duration. Each data point is acquired with a different b value. There are several types of analyses, but most are not typically used for liver imaging.
Two approaches are most frequently used for the assessment of liver fibrosis. First, the apparent diffusion coefficient (ADC) values are extracted using a monoexponential model (Fig. 3). This can be done with as few as 2 data points, generally 1 without motion-encoding gradients (b = 0 s/mm2) and 1 with high diffusion weighting (b ≥ 200 s/mm2). ADC is obtained from the slope of a linear regression of the semi-log data.85
FIGURE 3.
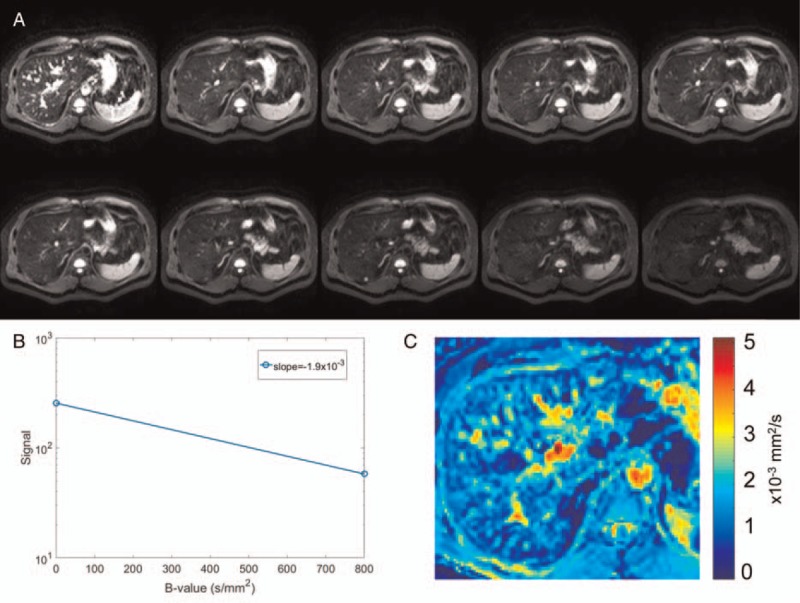
Diffusion-weighted images acquired (A) with diffusion weighting (b = 0, 10, 20, 30, 40, 50, 100, 200, 400, and 800 s/mm2). B, The signal from the 2 extreme b values is plotted semilogarithmically as a function of their b value and a linear regression is used to extract the apparent diffusion coefficient ADC (mm2/s) for a given pixel. C, A color parametric map of ADC values is computed for each pixel of the image. Figure 3 can be viewed online in color at www.topicsinmri.com.
Alternatively, intravoxel incoherent motion analysis is performed with several b-values, in particular with low b values (<200 s/mm2). This type of data is analyzed using a biexponential model which results in 3 parameters: D, or the diffusion coefficient, D∗, or the perfusion or pseudodiffusion coefficient, and f, the perfusion fraction.86
The relationship between ADC and fibrosis stage has been explored by several studies, with conflicting results. Some have found a decrease in ADC with increasing fibrosis stage.85,87–90 However, a study91 observed this effect only in living rats, but not in dead rats, which suggests that perfusion rather than diffusion is being affected by fibrosis stage. The rationale for the decrease in ADC is that the presence of collagen fibers restricts diffusion of water. This hypothesis has been further tested in intravoxel incoherent motion studies, which have found that the parameter which was most affected by fibrosis stage was D∗, suggesting that small-vessel perfusion rather than diffusion is hindered.38,86,92–94 The activation of stellate cells and deposition of collagen may be responsible for decreased perfusion and portal hypertension.95
Advantages and Limitations
DWI is available on most MRI scanners and does not require additional hardware. It is also a relatively fast method. However, it is sensitive to image noise and highly sensitive to motion by nature, making measurements unreliable, especially in the left liver lobe which is affected by cardiac motion. DWI for the staging of fibrosis also suffers from a lack of standardization. From 1 center to another, different b-values and analysis techniques are utilized, making results unrepeatable as it has been shown that ADC varies depending on the b values used to calculate it.96,97 Finally, DWI results are also affected by confounders such as incomplete fat saturation and iron deposition.98
Diagnostic Performance
From a meta-analysis of 10 studies including 613 patients,27 AUCs of 0.86 for staging fibrosis stage ≥1, 0.83 for fibrosis stage ≥2, and 0.86 for fibrosis stage ≥3 were found.
TEXTURE ANALYSIS
Description
Texture analysis aims to quantify texture features from images of the liver tissue. These images can be acquired with a variety of sequences. Noncontrast-enhanced studies have been used for this purpose, including T1-weighted,99 T2-weighted,31 and proton density–weighted imaging.100 Other studies have used contrast-enhanced or even double contrast-enhanced images, which have the advantage of resulting in more conspicuous texture features.33,101–103 Several texture features can be extracted from an ROI within the image of the tissue, using different types of analyses. Examples include first order or gradient-based histogram features and autoregressive model features.101 These features may be combined to provide a more complete assessment of tissue texture. Staging fibrosis using these features is made possible by the coarser texture of the tissue in fibrosis or cirrhosis, providing higher standard deviation and entropy with increasingly higher fibrosis stages (Fig. 4).
FIGURE 4.
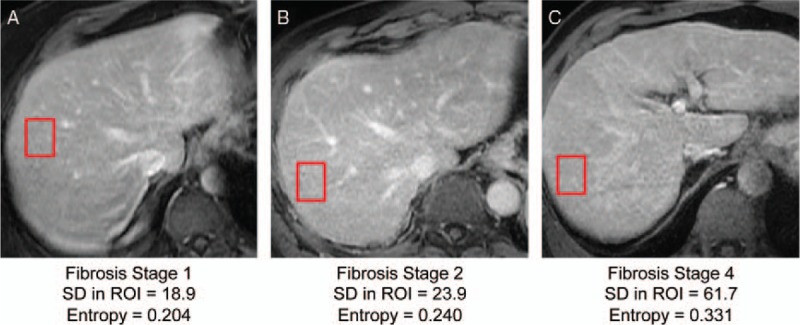
Examples of contrast-enhanced images in 3 different patients with chronic liver disease and fibrosis stages (A) 1, (B) 2, and (C) 4 documented by liver biopsy. Note the coarser texture (visually assessed) of the liver, higher standard deviation (SD), and higher entropy in regions of interest (red rectangles) associated with higher fibrosis stages. Figure 4 can be viewed online in color at www.topicsinmri.com.
Advantages and Limitations
Texture analysis can be performed on any type of image, including other modalities than MRI (such as ultrasound and computed tomography). However, results of texture analysis depend on image quality and the placement of the ROI. The greatest limitation of texture analysis as a staging method for fibrosis is its lack of standardization. Different features and combinations of features are reported in the literature, and thus making comparisons between sites and studies challenging. Another limitation is the requirement for specialized texture analysis software.
Diagnostic Performance
Because of the lack of standardization, there is a high variability in the diagnostic performance of texture analysis for staging liver fibrosis. Of the many studies assessing diagnostic performance of this technique, the AUCs varied from as low as 0.40 for the detection of fibrosis stage ≥3, and as high as 1.00 for the staging of cirrhosis.
PERFUSION IMAGING
Description
Perfusion imaging measures quantitative or semiquantitative perfusion parameters of the liver through the use of contrast agents. Gadolinium-based contrast agents are most frequently used. Signal enhancement in the liver tissue and vessels (abdominal aorta or hepatic artery and portal vein) following the injection of one of these contrast agents is measured at different time points104 (Fig. 5). The most basic perfusion examination acquires images in the arterial phase (∼20 seconds after injection), the portal venous phase (∼70 seconds), and the delayed or late phase (3 minutes).37 From these images, the arterial and portal fractions can be determined.37,105 The arterial fraction increases,37,105 whereas the portal fraction decreases with higher fibrosis stages.38,106 With a set of closely timed dynamic images, one can extract model-free semiquantitative parameters (such as upslope, time to peak, or peak enhancement), or use a compartmental model to calculate parameters such as arterial and portal blood flow as well as mean transit time.107 In the liver, the dual-input single-compartment model is most frequently used, as it takes into account the dual blood supply of the liver from the hepatic artery and the portal vein.
FIGURE 5.
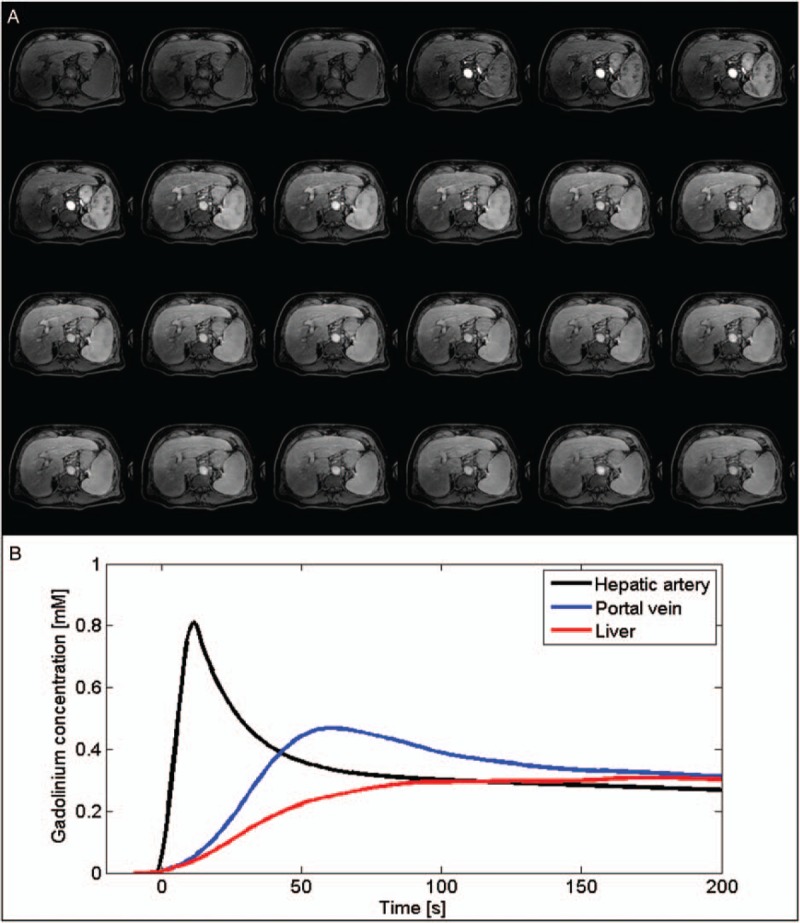
Illustration of a high temporal resolution dynamic contrast-enhanced (DCE) acquisition. A, Twenty-four dynamic phases acquired using a T1-weighted gradient-echo sequence before, during, and after the injection of a gadolinium-based contrast agent. B, Estimated time courses of the gadolinium concentration for the hepatic artery, the portal vein, and the liver parenchyma. Figure 5 can be viewed online in color at www.topicsinmri.com.
Advantages and Limitations
Perfusion imaging can be carried out on any imaging modality (MRI, US, and computed tomography) and shows potential for prognostic significance. Thus, perfusion constants could be used to predict treatment outcome in fibrosis patients. However, perfusion imaging has some limitations. It is more invasive than other MRI-based liver fibrosis quantification techniques as it requires injection of a contrast agent. It also requires full patient cooperation and several breath holds to achieve good results, especially for proper timing of image acquisition to record the arterial and portal venous peaks. The imaging technique and analysis are also not fully standardized and some significant postprocessing is required for quantitative parameter analysis.
Diagnostic Performance
One study37 has used arterial enhancement fraction thresholds to stage fibrosis. This resulted in AUCs of 0.83 for fibrosis stage ≥1, 0.85 for fibrosis stage ≥2, 0.88 for fibrosis stage ≥3, and 0.92 for fibrosis stage 4.
HEPATOCELLULAR FUNCTION IMAGING
Description
Liver fibrosis is associated with a decrease in hepatobiliary function, which can be imaged using liver-specific contrast agents. There are 2 liver-specific agents currently on the market: gadoxetate disodium and gadobenate dimeglumine. The uptake of these agents by the liver tissue relates to hepatocyte function,108 and therefore can reflect the stage of liver fibrosis. For the analysis of hepatobiliary function, at least 2 images are needed: before the injection of contrast, and 20 minutes after contrast injection (for gadoxetate disodium), when the uptake reaches the hepatobiliary phase. This allows the calculation of the relative enhancement of the tissue compared to precontrast signal41,109–111 or relative enhancement compared to other organs (eg, the muscles or spinal cord).112,113 Both of these measures of hepatocyte function have been shown to decrease in the presence of fibrosis. Another approach aims to calculate the hepatocyte fraction, which can be extracted from pre- and post-contrast T1 maps of the liver. These are then converted to a ΔR1 map, which can be used to calculate the hepatocyte fraction for every pixel.114,115 An example of this procedure is shown in Fig. 6. Hepatocyte fraction decreases with an increasing fibrosis stage.
FIGURE 6.
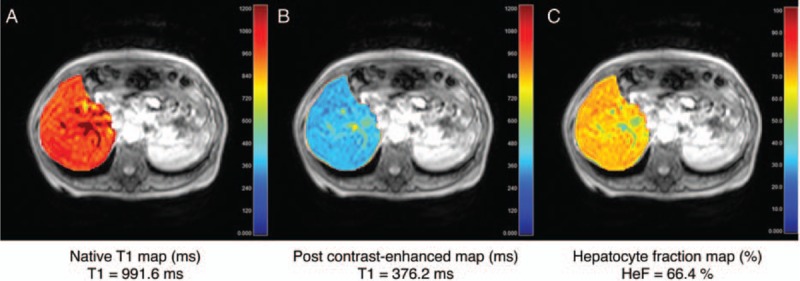
T1 map of the liver (A) before and (B) after administration of gadoxetate disodium imaged in hepatobiliary phase. C, The hepatocyte fraction map can then be calculated from the ΔR1 maps of the liver. These 3 images were acquired in a patient with liver fibrosis stage 4 (cirrhosis). Image courtesy of Tomoyuki Okuaki (Philips Healthcare, Tokyo, Japan). Figure 6 can be viewed online in color at www.topicsinmri.com.
Advantages and Limitations
Hepatobiliary function can be performed on any MRI scanner, and involves fast post-processing. However, it is logistically more demanding as it requires image acquisition at least 20 minutes after the injection of gadoxetate disodium for hepatobiliary phase imaging, which can lengthen the examination.
Diagnostic Performance
The diagnostic performance of this technique is variable and has only been assessed by a few studies. Also, data have only been published for assessing fibrosis stage ≥3. AUCs range from 0.6342 to 0.93.41 More studies are needed to assess the staging accuracy of this method for all fibrosis stages.
STRAIN IMAGING
Description
In liver imaging, respiratory and cardiac motion are often sources of unwanted artifacts which decrease the diagnostic value of the images. Strain imaging, on the other hand, aims to use this physiological motion to measure the liver deformation.116 Tissue strain is higher in a normal liver (more prone to deformation) than in a fibrotic or cirrhotic liver (stiffer). Cine-tagging, a technique originally developed for cardiac imaging, has shown some promise in imaging liver strain. Its principle rests on the use of specific MR pulses which create a sinusoidal magnetization grid (or tags) which modulates the underlying image signal (Fig. 7). Several images are acquired over the cardiac cycle, and as the tissue becomes deformed by the stress caused by heart motion, the magnetization grid also deforms. The harmonic phase images resulting from this acquisition reflect the position of the tags and allow tracking of every point in the image over time.117,118 By knowing the displacement of these points, it is then possible to calculate strain. It is also possible to encode strain directly into the image signal. This technique uses a similar principle as cine-tagging, also using magnetization tags, but requiring less lengthy postprocessing.
FIGURE 7.
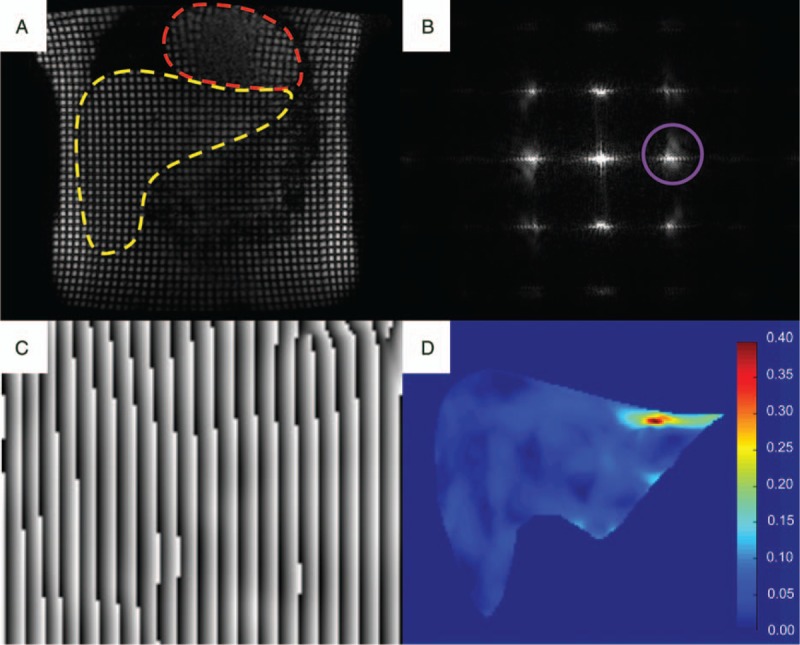
Illustration of the steps involved in cine-tagging strain imaging. A, First, a series of. tagged images are acquired throughout the cardiac cycle: coronal image showing the heart (red hatched line) and liver (yellow hatched line). B, In the frequency domain, the modulation of the images by the sinusoidal grid creates harmonic peaks at the spatial frequency of the tags. By isolating one of these peaks (purple circle) in the x and y directions, (C) phase images allow the reconstruction of the positions of the tags which can be tracked to measure (D) the strain map (unitless). Figure 7 can be viewed online in color at www.topicsinmri.com.
Advantages and Limitations
MRI cine-tagging and strain-encoded imaging may be performed on most scanners and require no additional hardware. They also present the key advantage of imaging the left liver lobe, which is not assessed as reliably with other techniques such as MRE or DWI. As fibrosis is known to be a heterogeneous process, the use a technique such as MRI cine-tagging may complement other techniques that tend to sample the right liver lobe. A limitation of this technique is that postprocessing is required with cine-tagging to obtain strain maps and for ROI placement to isolate a strain value, which does require additional software to be added to the analysis pipeline.
Diagnostic Performance
Diagnostic performance of these techniques has not yet been established, as only proofs of concepts for differentiation of normal from cirrhotic livers119,120 have been published. Further research is required to assess the diagnostic performance of MRI cine-tagging for staging of liver fibrosis.
T1ρ
Description
T1ρ, or the spin-lattice relaxation time in the rotating frame, has been used in many applications before being explored for assessment of liver fibrosis. Its principle is that once the spin magnetization is tipped into the transverse plane, and a pulse is applied, the magnetization enters a spin-lock state, and rotates at the frequency of the pulse. The following monoexponential decay of magnetization is sampled by imaging at different spin-lock times.121,122 The relaxation constant associated with this decay is known as T1ρ (Fig. 8).123 This method is sensitive to the presence of macromolecules, which undergo static processes and slow movements. T1ρ is therefore related to macromolecular content such as collagen that accumulates in liver fibrosis.123 This therefore may be the cause of the observed T1ρ increase in fibrosis, but the exact relationship between T1ρ and fibrosis is still unknown.124–126
FIGURE 8.
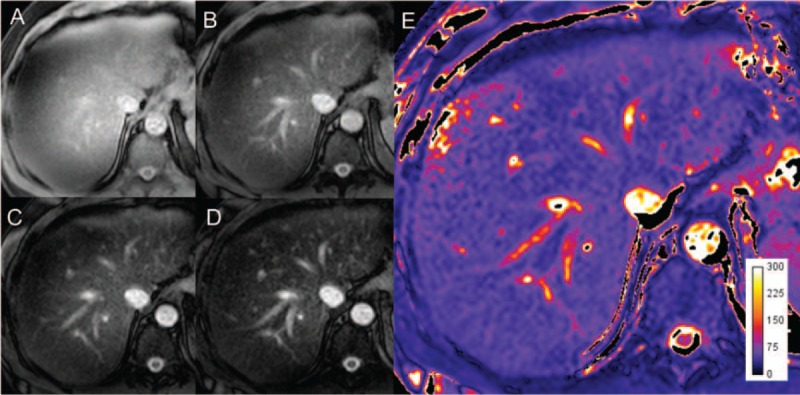
Following the application of an RF pulse, images acquired at 4 different spin-lock times, (A) 1 ms, (B) 20 ms, (C) 40 ms, (D) 60 ms allow the calculation of (E) the T1ρ map by fitting the signal to an exponential function. The map units are in milliseconds. Figure 8 can be viewed online in color at www.topicsinmri.com.
Advantages and Limitations
T1ρ quantification requires no additional hardware to be added to the MR system and has been implemented on most scanners as a research tool. Unlike MRE, it is unaffected by biological confounders such as postprandial state, steatosis, or iron load.124,127 This technique is, however, sensitive to B0 and B1 field inhomogeneities and is associated with high specific absorption rate, which can be problematic at higher field strength.
Diagnostic Performance
Two studies124,128 have shown that T1ρ can differentiate normal from cirrhotic livers. For staging fibrosis, this recent technique has seen conflicting results. One study129 has found correlation between T1ρ and fibrosis stage, while another found none.130 Additional research is warranted to validate this technique and assess its diagnostic performance in staging liver fibrosis.
FUTURE DIRECTIONS
This review article has focused on MRI techniques for cross-sectional assessment of liver fibrosis. Some of these quantitative MRI techniques may, however, also be used for additional indications related to liver fibrosis such as prognostic assessment of portal hypertension, risk prediction of HCC, longitudinal monitoring of liver fibrosis, and alternative to liver biopsy.
One of the potential complications of liver cirrhosis is portal hypertension, which is most often caused by increased resistance to blood flow due to perisinudoidal fibrosis. The current reference standard for assessing the portal pressure is the measurement of the hepatic venous pressure gradient, an invasive technique which requires wedging a catheter in a hepatic vein. The level of this gradient is associated with the risk of formation of esophageal varices, variceal bleeding, and mortality. Measurement of spleen stiffness by MRE has been proposed as a noninvasive alternative to evaluate portal hypertension and stratify the risk of esophageal varices in patients with cirrhosis.131,132 Combinations of MRI techniques such as measurement of T1 relaxation time, liver and spleen perfusion by arterial spin labeling, and assessment of portal blood flow by phase-contrast MRI have been proposed for assessment of hepatic vein pressure gradient.133,134
Liver cirrhosis regardless of the cause of chronic liver disease constitutes the most important risk factor for development of HCC. Patients with chronic viral hepatitis C and liver fibrosis stage 3 are also at increased risk of developing HCC. A study has found that MRE-determined liver stiffness constitutes an independent risk factor for HCC in patients with chronic liver disease.135 If validated, liver stiffness measured by MRE may be taken into consideration for stratifying the risk of HCC development in chronic liver disease.
For reasons discussed previously, liver biopsy is not a viable option for monitoring the progression of liver fibrosis. Therefore, there is a need for noninvasive techniques to follow fibrosis severity over time. Clinical trials studying the effect of antifibrotic treatments would benefit from these techniques.136 In some scenarios, such post-transplant hepatitis C, earlier detection of liver fibrosis recurrence using MRI techniques may prove essential.137
Multiparametric imaging, combining 2 or more quantitative MRI techniques for assessment of liver disease, would allow comprehensive assessment of liver fibrosis, along with biomarkers of liver fat,138 iron, biliary disease, and inflammation. Such protocols would provide a noninvasive multiparametric alternative, especially in clinical scenarios in which liver biopsy is impractical.
CONCLUSIONS
Several MRI-based techniques have been developed for quantitative assessment of liver fibrosis. These techniques include MRE, DWI, texture analysis, perfusion imaging, hepatocellular function imaging, strain imaging, and T1ρ quantification. Of the many suggested techniques, MRE stands out as the most standardized and the one that has been most widely adopted in clinical practice. It also has the highest diagnostic performance compared to other MRI-based techniques and other popular methods such as ultrasound elastography. By combining quantitative techniques into multiparametric examinations, MRI offers the unique opportunity to assess the concomitant pathological changes that occur in chronic liver disease, such as fat, iron, biliary disease, and inflammation. Once validated and integrated into a comprehensive examination, these quantitative techniques may reduce the need for liver biopsy in clinical practice and in the setting of clinical trials.
Footnotes
An Tang research activities on ultrasound elastography and MR elastography are supported by the Canadian Institutes of Health Research—Institute of Nutrition, Metabolism and Diabetes (CIHR-IMND 273738 and 301520); a New Researcher Startup Grant from the Centre de Recherche du Centre Hospitalier de l’Université de Montréal (CRCHUM); and a Career Award from the Fonds de Recherche du Québec en Santé and Association des Radiologistes du Québec (FRQS-ARQ 26993). Guillaume Gilbert is an employee of Philips Healthcare.
The authors report no conflicts of interest.
REFERENCES
- 1.Forner A, Llovet JM, Bruix J. Hepatocellular carcinoma. Lancet 2012; 379:1245–1255. [DOI] [PubMed] [Google Scholar]
- 2.Brancatelli G, Federle MP, Ambrosini R, et al. Cirrhosis: CT and MR imaging evaluation. Eur J Radiol 2007; 61:57–69. [DOI] [PubMed] [Google Scholar]
- 3.Rockey DC, Caldwell SH, Goodman ZD, et al. Liver biopsy. Hepatology 2009; 49:1017–1044. [DOI] [PubMed] [Google Scholar]
- 4.Bedossa P, Carrat F. Liver biopsy: the best, not the gold standard. J Hepatol 2009; 50:1–3. [DOI] [PubMed] [Google Scholar]
- 5.Sebastiani G, Gkouvatsos K, Pantopoulos K. Chronic hepatitis C and liver fibrosis. World J Gastroenterol 2014; 20:11033–11053. [DOI] [PMC free article] [PubMed] [Google Scholar]
- 6.Friedman SL. Liver fibrosis—from bench to bedside. J Hepatol 2003; 38:S38–S53. [DOI] [PubMed] [Google Scholar]
- 7.Lee UE, Friedman SL. Mechanisms of hepatic fibrogenesis. Best Pract Res Clin Gastroenterol 2011; 25:195–206. [DOI] [PMC free article] [PubMed] [Google Scholar]
- 8.El-Serag HB. Hepatocellular carcinoma. N Engl J Med 2011; 365:1118–1127. [DOI] [PubMed] [Google Scholar]
- 9.Wang H, Naghavi M, Allen C, et al. Global, regional, and national life expectancy, all-cause mortality, and cause-specific mortality for 249 causes of death, 1980–2015: a systematic analysis for the Global Burden of Disease Study 2015. Lancet 2016; 388:1459–1544. [DOI] [PMC free article] [PubMed] [Google Scholar]
- 10.Kim WR, Brown RS, Terrault NA, et al. Burden of liver disease in the United States: summary of a workshop. Hepatology 2002; 36:227–242. [DOI] [PubMed] [Google Scholar]
- 11.Ponziani FR, Mangiola F, Binda C, et al. Future of liver disease in the era of direct acting antivirals for the treatment of hepatitis C. World J Hepatol 2017; 9:352–367. [DOI] [PMC free article] [PubMed] [Google Scholar]
- 12.Charlton MR, Burns JM, Pedersen RA, et al. Frequency and outcomes of liver transplantation for nonalcoholic steatohepatitis in the United States. Gastroenterology 2011; 141:1249–1253. [DOI] [PubMed] [Google Scholar]
- 13.Wong RJ, Aguilar M, Cheung R, et al. Nonalcoholic steatohepatitis is the second leading etiology of liver disease among adults awaiting liver transplantation in the United States. Gastroenterology 2015; 148:547–555. [DOI] [PubMed] [Google Scholar]
- 14.Younossi ZM, Koenig AB, Abdelatif D, et al. Global epidemiology of non-alcoholic fatty liver disease–meta-analytic assessment of prevalence, incidence and outcomes. Hepatology 2016; 64:73–84. [DOI] [PubMed] [Google Scholar]
- 15.Bedossa P, Bioulac-Sage P, Callard P, et al. Intraobserver and interobserver variations in liver biopsy interpretation in patients with chronic hepatitis C. Hepatology 1994; 20:15–20. [PubMed] [Google Scholar]
- 16.Knodell RG, Ishak KG, Black WC, et al. Formulation and application of a numerical scoring system for assessing histological activity in asymptomatic chronic active hepatitis. Hepatology 1981; 1:431–435. [DOI] [PubMed] [Google Scholar]
- 17.Ishak KG. Chronic hepatitis: morphology and nomenclature. Mod Pathol 1994; 7:690–713. [PubMed] [Google Scholar]
- 18.Kim SU, Oh HJ, Wanless IR, et al. The Laennec staging system for histological sub-classification of cirrhosis is useful for stratification of prognosis in patients with liver cirrhosis. J Hepatol 2012; 57:556–563. [DOI] [PubMed] [Google Scholar]
- 19.Brunt EM, Janney CG, Di Bisceglie AM, et al. Nonalcoholic steatohepatitis: a proposal for grading and staging the histological lesions. Am J Gastroenterol 1999; 94:2467–2474. [DOI] [PubMed] [Google Scholar]
- 20.Reeder SB, Cruite I, Hamilton G, et al. Quantitative assessment of liver fat with magnetic resonance imaging and spectroscopy. J Magn Reson Imaging 2011; 34:729–749. [DOI] [PMC free article] [PubMed] [Google Scholar]
- 21.Hernando D, Levin YS, Sirlin CB, et al. Quantification of liver iron with MRI: state of the art and remaining challenges. J Magn Reson Imaging 2014; 40:1003–1021. [DOI] [PMC free article] [PubMed] [Google Scholar]
- 22.Regev A, Berho M, Jeffers LJ, et al. Sampling error and intraobserver variation in liver biopsy in patients with chronic HCV infection. Am J Gastroenterol 2002; 97:2614–2618. [DOI] [PubMed] [Google Scholar]
- 23.Eisenberg E, Konopniki M, Veitsman E, et al. Prevalence and characteristics of pain induced by percutaneous liver biopsy. Anesth Analg 2003; 96:1392–1396. [DOI] [PubMed] [Google Scholar]
- 24.Rockey DC, Caldwell SH, Goodman ZD, et al. Liver biopsy. Hepatology 2009; 49:1017–1044. [DOI] [PubMed] [Google Scholar]
- 25.Fernandez-Salazar L, Velayos B, Aller RO, et al. Percutaneous liver biopsy: patients’ point of view. Scand J Gastroenterol 2011; 5521:1–5. [DOI] [PubMed] [Google Scholar]
- 26.Bonny C, Rayssiguier R, Ughetto S, et al. Medical practices and expectations of general practitioners in relation to hepatitis C virus infection in the Auvergne region. Gastroenterol Clin Biol 2003; 27:1021–1025. [PubMed] [Google Scholar]
- 27.Wang QB, Zhu H, Liu HL, et al. Performance of magnetic resonance elastography and diffusion-weighted imaging for the staging of hepatic fibrosis: a meta-analysis. Hepatology 2012; 56:239–247. [DOI] [PubMed] [Google Scholar]
- 28.Singh S, Allen AM, Wang Z, et al. Fibrosis progression in nonalcoholic fatty liver vs nonalcoholic steatohepatitis: a systematic review and meta-analysis of paired-biopsy studies. Clin Gastroenterol Hepatol 2015; 13:643–654. [DOI] [PMC free article] [PubMed] [Google Scholar]
- 29.Guo Y, Parthasarathy S, Goyal P, et al. Magnetic resonance elastography and acoustic radiation force impulse for staging hepatic fibrosis: a meta-analysis. Abdom Imaging 2015; 40:818–834. [DOI] [PubMed] [Google Scholar]
- 30.Jiang H, Chen J, Gao R, et al. Liver fibrosis staging with diffusion-weighted imaging: a systematic review and meta-analysis. Abdom Radiol (NY) 2017; 42:490–501. [DOI] [PubMed] [Google Scholar]
- 31.House MJ, Bangma SJ, Thomas M, et al. Texture-based classification of liver fibrosis using MRI. J Magn Reson Imaging 2015; 41:322–328. [DOI] [PubMed] [Google Scholar]
- 32.Kato H, Kanematsu M, Zhang X, et al. Computer-aided diagnosis of hepatic fibrosis: preliminary evaluation of MRI texture analysis using the finite difference method and an artificial neural network. Am J Roentgenol 2007; 189:117–122. [DOI] [PubMed] [Google Scholar]
- 33.Aguirre DA, Behling CA, Alpert E, et al. Liver fibrosis: noninvasive diagnosis with double contrast material-enhanced MR imaging. Radiology 2006; 239:425–437. [DOI] [PubMed] [Google Scholar]
- 34.Bahl G, Cruite I, Wolfson T, et al. Noninvasive classification of hepatic fibrosis based on texture parameters from double contrast-enhanced magnetic resonance images. J Magn Reson Imaging 2012; 36:1154–1161. [DOI] [PMC free article] [PubMed] [Google Scholar]
- 35.Yokoo T, Wolfson T, Iwaisako K, et al. Evaluation of liver fibrosis using texture analysis on combined-contrast-enhanced magnetic resonance images at 3.0 T. Biomed Res Int 2015; 2015:387653. [DOI] [PMC free article] [PubMed] [Google Scholar]
- 36.Hagiwara M, Rusinek H, Lee VS, et al. Advanced liver fibrosis: diagnosis with 3D whole liver. Radiology 2008; 246:926–934. [DOI] [PubMed] [Google Scholar]
- 37.Ou HY, Bonekamp S, Bonekamp D, et al. MRI arterial enhancement fraction in hepatic fibrosis and cirrhosis. Am J Roentgenol 2013; 201:596–602. [DOI] [PubMed] [Google Scholar]
- 38.Patel J, Sigmund EE, Rusinek H, et al. Diagnosis of cirrhosis with intravoxel incoherent motion diffusion MRI and dynamic contrast-enhanced MRI alone and in combination: preliminary experience. J Magn Reson Imaging 2010; 31:589–600. [DOI] [PMC free article] [PubMed] [Google Scholar]
- 39.Choi YR, Min Lee J, Yoon JH, et al. Comparison of magnetic resonance elastography and gadoxetate disodium-enhanced magnetic resonance imaging for the evaluation of hepatic fibrosis. Invest Radiol 2013; 48:607–613. [DOI] [PubMed] [Google Scholar]
- 40.Feier D, Balassy C, Bastati N, et al. Liver fibrosis: histopathologic and biochemical influences on diagnostic efficacy of hepatobiliary contrast-enhanced MR imaging in staging. Radiology 2013; 269:460–468. [DOI] [PubMed] [Google Scholar]
- 41.Goshima S, Kanematsu M, Watanabe H, et al. Gd-EOB-DTPA-enhanced MR imaging: prediction of hepatic fibrosis stages using liver contrast enhancement index and liver-to-spleen volumetric ratio. J Magn Reson Imaging 2012; 36:1148–1153. [DOI] [PubMed] [Google Scholar]
- 42.Motosugi U, Ichikawa T, Oguri M, et al. Staging liver fibrosis by using liver-enhancement ratio of gadoxetic acid-enhanced MR imaging: comparison with aspartate aminotransferase-to-platelet ratio index. Magn Reson Imaging 2011; 29:1047–1052. [DOI] [PubMed] [Google Scholar]
- 43.Allkemper T, Sagmeister F, Cicinnati V, et al. Evaluation of fibrotic liver disease with whole-liver T1ρ MR imaging: a feasibility study at 1.5 T. Radiology 2014; 271:408–415. [DOI] [PubMed] [Google Scholar]
- 44.Petitclerc L, Sebastiani G, Gilbert G, et al. Liver fibrosis: review of current imaging and MRI quantification techniques. J Magn Reson Imaging 2017; 45:1276–1295. [DOI] [PubMed] [Google Scholar]
- 45.Tse ZTH, Janssen H, Hamed A, et al. Magnetic resonance elastography hardware design: a survey. J Eng Med 2009; 223:497–514. [DOI] [PubMed] [Google Scholar]
- 46.Asbach P, Klatt D, Hamhaber U, et al. Assessment of liver viscoelasticity using multifrequency MR elastography. Magn Reson Med 2008; 379:373–379. [DOI] [PubMed] [Google Scholar]
- 47.Yin M, Talwalkar JA, Glaser KJ, et al. Assessment of hepatic fibrosis with magnetic resonance elastography. Clin Gastroenterol Hepatol 2007; 5:1207–1213. [DOI] [PMC free article] [PubMed] [Google Scholar]
- 48.Kwon OI, Park C, Nam HS, et al. Shear modulus decomposition algorithm in magnetic resonance elastography. IEEE Trans Med Imaging 2009; 28:1526–1533. [DOI] [PMC free article] [PubMed] [Google Scholar]
- 49.Dunn T, Majumdar S. Comparison of motion encoding waveforms for magnetic resonance elastography at 3T. Conf Proc IEEE Eng Med Biol Soc 2005; 7:7405–7408. [DOI] [PubMed] [Google Scholar]
- 50.Klatt D, Asbach P, Rump J, et al. In vivo determination of hepatic stiffness using steady-state free precession magnetic resonance elastography. Invest Radiol 2006; 41:841–848. [DOI] [PubMed] [Google Scholar]
- 51.Sinkus R, Tanter M, Catheline S, et al. Imaging anisotropic and viscous properties of breast tissue by magnetic resonance-elastography. Magn Reson Med 2005; 53:372–387. [DOI] [PubMed] [Google Scholar]
- 52.Muthupillai R, Lomas DJ, Rossman PJ, et al. Magnetic resonance elastography by direct visualization of propagating acoustic strain waves. Science 1995; 269:1854–1857. [DOI] [PubMed] [Google Scholar]
- 53.Asbach P, Klatt D, Schlosser B, et al. Viscoelasticity-based staging of hepatic fibrosis with multifrequency MR elastography. Radiology 2010; 257:80–86. [DOI] [PubMed] [Google Scholar]
- 54.Manduca A, Oliphant TE, Dresner MA, et al. Magnetic resonance elastography: non-invasive mapping of tissue elasticity. Med Image Anal 2001; 5:237–254. [DOI] [PubMed] [Google Scholar]
- 55.Venkatesh SK, Ehman RL. Magnetic resonance elastography of liver. Magn Reson Imaging Clin N Am 2014; 22:433–446. [DOI] [PMC free article] [PubMed] [Google Scholar]
- 56.Dzyubak B, Venkatesh SK, Manduca A, et al. Automated liver elasticity calculation for MR elastography. J Magn Reson Imaging 2016; 43:1055–1063. [DOI] [PMC free article] [PubMed] [Google Scholar]
- 57.Choi YR, Lee JM, Yoon JH, et al. Comparison of magnetic resonance elastography and gadoxetate disodium-enhanced magnetic resonance imaging for the evaluation of hepatic fibrosis. Invest Radiol 2013; 48:607–613. [DOI] [PubMed] [Google Scholar]
- 58.Ichikawa S, Motosugi U, Morisaka H, et al. MRI-based staging of hepatic fibrosis: comparison of intravoxel incoherent motion diffusion-weighted imaging with magnetic resonance elastography. J Magn Reson Imaging 2014; 42:204–210. [DOI] [PubMed] [Google Scholar]
- 59.Yoshimitsu K, Mitsufuji T, Shinagawa Y, et al. MR elastography of the liver at 3.0 T in diagnosing liver fibrosis grades; preliminary clinical experience. Eur Radiol 2016; 26:656–663. [DOI] [PubMed] [Google Scholar]
- 60.Venkatesh SK, Wang G, Lim SG, et al. Magnetic resonance elastography for the detection and staging of liver fibrosis in chronic hepatitis B. Eur Radiol 2014; 24:70–78. [DOI] [PubMed] [Google Scholar]
- 61.Chang W, Lee JM, Yoon JH, et al. Liver fibrosis staging with MR elastography: comparison of diagnostic performance between patients with chronic hepatitis B and those with other etiologic causes. Radiology 2016; 280:88–97. [DOI] [PubMed] [Google Scholar]
- 62.Lee JE, Lee JM, Lee KB, et al. Noninvasive assessment of hepatic fibrosis in patients with chronic hepatitis B viral infection using magnetic resonance elastography. Korean J Radiol 2014; 15:210–217. [DOI] [PMC free article] [PubMed] [Google Scholar]
- 63.Hennedige TP, Wang G, Leung FP, et al. Magnetic resonance elastography and diffusion weighted imaging in the evaluation of hepatic fibrosis in chronic hepatitis B. Gut Liver 2016; 11:401–408. [DOI] [PMC free article] [PubMed] [Google Scholar]
- 64.Ichikawa S, Motosugi U, Ichikawa T, et al. Magnetic resonance elastography for staging liver fibrosis in chronic hepatitis C. Magn Reson Med Sci 2012; 11:291–297. [DOI] [PubMed] [Google Scholar]
- 65.Shi Y, Xia F, Li Q-J, et al. Magnetic resonance elastography for the evaluation of liver fibrosis in chronic hepatitis B and C by using both gradient-recalled echo and spin-echo echo planar imaging: a prospective study. Am J Gastroenterol 2016; 111:823–833. [DOI] [PubMed] [Google Scholar]
- 66.Chen J, Talwalkar Ja, Yin M, et al. Early detection of nonalcoholic steatohepatitis in patients with nonalcoholic fatty liver disease by using MR elastography. Radiology 2011; 259:749–756. [DOI] [PMC free article] [PubMed] [Google Scholar]
- 67.Kim D, Kim WR, Talwalkar J, et al. Advanced fibrosis in nonalcoholic fatty liver disease: noninvasive assessment with MR elastography. Radiology 2013; 268:411–419. [DOI] [PMC free article] [PubMed] [Google Scholar]
- 68.Loomba R, Wolfson T, Ang B, et al. Magnetic resonance elastography predicts advanced fibrosis in patients with nonalcoholic fatty liver disease: a prospective study. Hepatology 2014; 60:1920–1928. [DOI] [PMC free article] [PubMed] [Google Scholar]
- 69.Singh S, Venkatesh SK, Loomba R, et al. Magnetic resonance elastography for staging liver fibrosis in non-alcoholic fatty liver disease: a diagnostic accuracy systematic review and individual participant data pooled analysis. Eur Radiol 2016; 26:1431–1440. [DOI] [PMC free article] [PubMed] [Google Scholar]
- 70.Imajo K, Kessoku T, Honda Y, et al. Magnetic resonance imaging more accurately classifies steatosis and fibrosis in patients with nonalcoholic fatty liver disease than transient elastography. Gastroenterology 2016; 150:626–637. [DOI] [PubMed] [Google Scholar]
- 71.Loomba R, Cui J, Wolfson T, et al. Novel 3D magnetic resonance elastography for the noninvasive diagnosis of advanced fibrosis in NAFLD: a prospective study. Am J Gastroenterol 2016; 111:1–9. [DOI] [PMC free article] [PubMed] [Google Scholar]
- 72.Kim RG, Nguyen P, Bettencourt R, et al. Magnetic resonance elastography identifies fibrosis in adults with alpha-1 antitrypsin deficiency liver disease: a prospective study. Aliment Pharmacol Ther 2016; 44:287–299. [DOI] [PubMed] [Google Scholar]
- 73.Wang J, Malik N, Yin M, et al. Magnetic resonance elastography is accurate in detecting advanced fibrosis in autoimmune hepatitis. World J Gastroenterol 2017; 23:859–868. [DOI] [PMC free article] [PubMed] [Google Scholar]
- 74.Chen J, Oudry J, Glaser KJ, et al. Diagnostic performance of MR elastography and vibration-controlled transient elastography in the detection of hepatic fibrosis in patients with severe to morbid obesity. Radiology 2017; 283:418–428. [DOI] [PMC free article] [PubMed] [Google Scholar]
- 75.Trout AT, Serai S, Mahley AD, et al. Liver stiffness measurements with mr elastography: agreement and repeatability across imaging systems, field strengths, and pulse sequences. Radiology 2016; 281:793–804. [DOI] [PubMed] [Google Scholar]
- 76.Serai SD, Yin M, Wang H, et al. Cross-vendor validation of liver magnetic resonance elastography. Abdom Imaging 2015; 40:789–794. [DOI] [PMC free article] [PubMed] [Google Scholar]
- 77.Yin M, Glaser KJ, Talwalkar JA, et al. Hepatic MR elastography: clinical performance in a series of 1377 consecutive examinations. Radiology 2016; 278:114–124. [DOI] [PMC free article] [PubMed] [Google Scholar]
- 78.Tang A, Cloutier G, Szeverenyi NM, et al. Ultrasound elastography and MR elastography for assessing liver fibrosis: part 2, diagnostic performance, confounders, and future directions. Am J Roentgenol 2015; 205:33–40. [DOI] [PMC free article] [PubMed] [Google Scholar]
- 79.Venkatesh SK, Yin M, Ehman RL. Magnetic resonance elastography of liver: technique, analysis, and clinical applications. J Magn Reson Imaging 2013; 37:544–555. [DOI] [PMC free article] [PubMed] [Google Scholar]
- 80.Tang A, Cloutier G, Szeverenyi NM, et al. Ultrasound elastography and MR elastography for assessing liver fibrosis: part 2, diagnostic performance, confounders, and future directions. Am J Roentgenol 2015; 1–8. [DOI] [PMC free article] [PubMed] [Google Scholar]
- 81.Singh S, Venkatesh SK, Wang Z, et al. Diagnostic performance of magnetic resonance elastography in staging liver fibrosis: a systematic review and meta-analysis of individual participant data. Clin Gastroenterol Hepatol 2015; 13:440–451. [DOI] [PMC free article] [PubMed] [Google Scholar]
- 82.Guo Y, Parthasarathy S, Goyal P, et al. Magnetic resonance elastography and acoustic radiation force impulse for staging hepatic fibrosis: a meta-analysis. Abdom Imaging 2015; 40:818–834. [DOI] [PubMed] [Google Scholar]
- 83.Huwart L, Sempoux C, Vicaut E, et al. Magnetic resonance elastography for the noninvasive staging of liver fibrosis. Gastroenterology 2008; 135:32–40. [DOI] [PubMed] [Google Scholar]
- 84.Yoon JH, Lee JM, Joo I, et al. Hepatic fibrosis: prospective comparison of MR elastography and US shear wave elastography for evaluation. Radiology 2014; 273:132000. [DOI] [PubMed] [Google Scholar]
- 85.Bonekamp S, Torbenson MS, Kamel IR. Diffusion-weighted magnetic resonance imaging for the staging of liver fibrosis. J Clin Gastroenterol 2011; 45:885–892. [DOI] [PMC free article] [PubMed] [Google Scholar]
- 86.Chow AM, Gao DS, Fan SJ, et al. Liver fibrosis: an intravoxel incoherent motion (IVIM) study. J Magn Reson Imaging 2012; 36:159–167. [DOI] [PubMed] [Google Scholar]
- 87.Bakan AA, Inci E, Bakan S, et al. Utility of diffusion-weighted imaging in the evaluation of liver fibrosis. Eur Radiol 2012; 22:682–687. [DOI] [PubMed] [Google Scholar]
- 88.Koinuma M, Ohashi I, Hanafusa K, et al. Apparent diffusion coefficient measurements with diffusion-weighted magnetic resonance imaging for evaluation of hepatic fibrosis. J Magn Reson Imaging 2005; 22:80–85. [DOI] [PubMed] [Google Scholar]
- 89.Sandrasegaran K, Akisik FM, Lin C, et al. Value of diffusion-weighted MRI for assessing liver fibrosis and cirrhosis. Am J Roentgenol 2009; 193:1556–1560. [DOI] [PubMed] [Google Scholar]
- 90.Taouli B, Tolia AJ, Losada M, et al. Diffusion-weighted MRI for quantification of liver fibrosis: preliminary experience. Am J Roentgenol 2007; 189:799–806. [DOI] [PubMed] [Google Scholar]
- 91.Annet L, Peeters F, Abarca-Quinones J, et al. Assessment of diffusion-weighted MR imaging in liver fibrosis. J Magn Reson Imaging 2007; 25:122–128. [DOI] [PubMed] [Google Scholar]
- 92.Luciani A, Vignaud A, Cavet M, et al. Liver cirrhosis: intravoxel incoherent motion MR imaging–pilot study. Radiology 2008; 249:891–899. [DOI] [PubMed] [Google Scholar]
- 93.Hu G, Chan Q, Quan X, et al. Intravoxel incoherent motion MRI evaluation for the staging of liver fibrosis in a rat model. J Magn Reson Imaging 2014; 42:331–339. [DOI] [PubMed] [Google Scholar]
- 94.Yoon JH, Lee JM, Baek JH, et al. Evaluation of hepatic fibrosis using intravoxel incoherent motion in diffusion-weighted liver MRI. J Comput Assist Tomogr 2014; 38:110–116. [DOI] [PubMed] [Google Scholar]
- 95.Friedman SL. Mechanisms of hepatic fibrogenesis. Gastroenterology 2008; 134:1655–1669. [DOI] [PMC free article] [PubMed] [Google Scholar]
- 96.Girometti R, Furlan A, Esposito G, et al. Relevance of b-values in evaluating liver fibrosis: a study in healthy and cirrhotic subjects using two single-shot spin-echo echo-planar diffusion-weighted sequences. J Magn Reson Imaging 2008; 28:411–419. [DOI] [PubMed] [Google Scholar]
- 97.Ozkurt H, Keskiner F, Karatag O, et al. Diffusion weighted MRI for hepatic fibrosis: impact of b-value. Iran J Radiol 2014; 11:1–8. [DOI] [PMC free article] [PubMed] [Google Scholar]
- 98.Bülow R, Mensel B, Meffert P, et al. Diffusion-weighted magnetic resonance imaging for staging liver fibrosis is less reliable in the presence of fat and iron. Eur Radiol 2013; 23:1281–1287. [DOI] [PubMed] [Google Scholar]
- 99.Mahmoud-Ghoneim D, Amin A, Corr P. MRI-based texture analysis: a potential technique to assess protectors against induced-liver fibrosis in rats. Radiol Oncol 2009; 43:30–40. [Google Scholar]
- 100.Yu H, Buch K, Li B, et al. Utility of texture analysis for quantifying hepatic fibrosis on proton density MRI. J Magn Reson Imaging 2015; 42:1259–1265. [DOI] [PubMed] [Google Scholar]
- 101.Bahl G, Cruite I, Wolfson T, et al. Noninvasive classification of hepatic fibrosis based on texture parameters from double contrast-enhanced magnetic resonance images. J Magn Reson Imaging 2012; 36:1154–1161. [DOI] [PMC free article] [PubMed] [Google Scholar]
- 102.Yokoo T, Wolfson T, Iwaisako K, et al. Evaluation of liver fibrosis using texture analysis on combined-contrast-enhanced magnetic resonance images at 3.0T. Biomed Res Int 2015; 2015:387653. [DOI] [PMC free article] [PubMed] [Google Scholar]
- 103.Kato H, Kanematsu M, Zhang X, et al. Computer-aided diagnosis of hepatic fibrosis: preliminary evaluation of mri texture analysis using the finite difference method and an artificial neural network. Am J Roentgenol 2007; 189:117–122. [DOI] [PubMed] [Google Scholar]
- 104.Materne R, Van Beers BE, Smith AM, et al. Non-invasive quantification of liver perfusion with dynamic computed tomography and a dual-input one-compartmental model. Clin Sci (Lond) 2000; 99:517–525. [PubMed] [Google Scholar]
- 105.Bonekamp D, Bonekamp S, Geiger B, et al. An elevated arterial enhancement fraction is associated with clinical and imaging indices of liver fibrosis and cirrhosis. J Comput Assist Tomogr 2012; 36:681–689. [DOI] [PubMed] [Google Scholar]
- 106.Kim H, Booth CJ, Pinus AB, et al. Induced hepatic fibrosis in rats: hepatic steatosis, macromolecule content, perfusion parameters, and their correlations—preliminary MR imaging in rats. Radiology 2008; 247:696–705. [DOI] [PubMed] [Google Scholar]
- 107.Khalifa F, Soliman A, El-baz A, et al. Models and methods for analyzing DCE-MRI: a review. Med Phys 2014; 41:1–32. [DOI] [PubMed] [Google Scholar]
- 108.Seale MK, Catalano OA, Saini S, et al. Hepatobiliary-specific MR contrast agents: role in imaging the liver and biliary tree. Radiographics 2009; 29:1725–1748. [DOI] [PubMed] [Google Scholar]
- 109.Verloh N, Utpatel K, Haimerl M, et al. Liver fibrosis and Gd-EOB-DTPA- enhanced MRI: a histopathologic correlation. Nat Sci Rep 2015; 1–10. [DOI] [PMC free article] [PubMed] [Google Scholar]
- 110.Watanabe H, Kanematsu M, Goshima S, et al. Staging hepatic fibrosis: comparison of gadoxetate disodium-enhanced and diffusion-weighted MR imaging—preliminary observations. Radiology 2011; 259:142–150. [DOI] [PubMed] [Google Scholar]
- 111.Feier D, Balassy C, Bastati N, et al. Liver fibrosis: histopathologic and biochemical influences on diagnostic efficacy of hepatobiliary contrast-enhanced MR imaging in staging. Radiology 2013; 269:460–468. [DOI] [PubMed] [Google Scholar]
- 112.Kumazawa K, Edamoto Y, Yanase M, et al. Liver analysis using gadolinium-ethoxybenzyl-diethylenetriamine pentaacetic acid-enhanced magnetic resonance imaging: correlation with histological grading and quantitative liver evaluation prior to hepatectomy. Hepatol Res 2012; 42:1081–1088. [DOI] [PubMed] [Google Scholar]
- 113.Motosugi U, Ichikawa T, Oguri M, et al. Staging liver fibrosis by using liver-enhancement ratio of gadoxetic acid-enhanced MR imaging: comparison with aspartate aminotransferase-to-platelet ratio index. Magn Reson Imaging 2011; 29:1047–1052. [DOI] [PubMed] [Google Scholar]
- 114.Oluaki T, Morita K, Namimoto T, et al. Comparison of the hepatocyte fraction and conventional image based methods for the estimation of liver function. In: Proc Int Soc Magn Reson Med, May 7–13 2016; Singapore, Abstract 0165. [Google Scholar]
- 115.Okuaki T, Morita K, Namimoto T, et al. Assessment of the hepatocyte fraction for estimation of liver function. In Proc Int Soc Magn Reson Med 2015; 23:384. [Google Scholar]
- 116.Watanabe H, Kanematsu M, Kitagawa T, et al. MR elastography of the liver at 3 T with cine-tagging and bending energy analysis: preliminary results. Eur Radiol 2010; 20:2381–2389. [DOI] [PubMed] [Google Scholar]
- 117.Osman NF, Faranesh AZ, Mcveigh ER, et al. Tracking cardiac motion using cine harmonic phase (HARP) MRI. Magn Reson Med 1999; 42:1048–1060. [DOI] [PMC free article] [PubMed] [Google Scholar]
- 118.Barajas J, Garcia-Barnés J, Carreras F, et al. Angle images using Gabor filters in cardiac tagged MRI. Front Artif Intell Appl 2005; 131:107–114. [Google Scholar]
- 119.Mannelli L, Wilson GJ, Dubinsky TJ, et al. Assessment of the liver strain among cirrhotic and normal livers using tagged MRI. J Magn Reson Imaging 2012; 36:1490–1495. [DOI] [PubMed] [Google Scholar]
- 120.Harouni AA, Gharib AM, Osman NF, et al. Assessment of liver fibrosis using fast strain-encoded MRI driven by inherent cardiac motion. Magn Reson Med 2014; [Epub ahead of print]. [DOI] [PMC free article] [PubMed] [Google Scholar]
- 121.Gilani IA, Sepponen R. Quantitative rotating frame relaxometry methods in MRI. NMR Biomed 2016; 29:841–861. [DOI] [PubMed] [Google Scholar]
- 122.Yuan J, Zhao F, Griffith JF, et al. Optimized efficient liver T1ρ mapping using limited spin lock times. Phys Med Biol 2012; 57:1631–1640. [DOI] [PubMed] [Google Scholar]
- 123.Wang Y-X, Yuan J, Chu E, et al. T1 r MR imaging is sensitive to evaluate liver fibrosis: an experimental study in a rat biliary duct ligation model. Radiology 2011; 259:712–719. [DOI] [PubMed] [Google Scholar]
- 124.Allkemper T, Sagmeister F, Cicinnati V, et al. Evaluation of fibrotic liver disease with whole-liver T1ρ MR imaging: a feasibility study at 1.5 T. Radiology 2014; 271:408–415. [DOI] [PubMed] [Google Scholar]
- 125.Singh A, Reddy D, Haris M, et al. T1ρ MRI of healthy and fibrotic human livers at 1.5 T. J Transl Med 2015; 13:292. [DOI] [PMC free article] [PubMed] [Google Scholar]
- 126.Jiang J, Huang B, Bin G, et al. An experimental study on the assessment of rabbit hepatic fibrosis by using magnetic resonance T1ρ imaging. Magn Reson Imaging 2015; 34:308–311. [DOI] [PubMed] [Google Scholar]
- 127.Zhao F, Deng M, Yuan J, et al. Experimental evaluation of accelerated T1rho relaxation quantification in human liver using limited spin-lock times. Korean J Radiol 2012; 13:736–742. [DOI] [PMC free article] [PubMed] [Google Scholar]
- 128.Rauscher I, Eiber M, Ganter C, et al. Evaluation of T1ρ as a potential MR biomarker for liver cirrhosis: comparison of healthy control subjects and patients with liver cirrhosis. Eur J Radiol 2014; 83:900–904. [DOI] [PubMed] [Google Scholar]
- 129.Singh A, Reddy D, Haris M, et al. T1ρ MRI of healthy and fibrotic human livers at 1.5 T. J Transl Med 2015; 13:292. [DOI] [PMC free article] [PubMed] [Google Scholar]
- 130.Takayama Y, Nishie A, Asayama Y, et al. T1ρ relaxation of the liver: a potential biomarker of liver function. J Magn Reson Imaging 2014; 195:188–195. [DOI] [PubMed] [Google Scholar]
- 131.Colecchia A, Montrone L, Scaioli E, et al. Measurement of spleen stiffness to evaluate portal hypertension and the presence of esophageal varices in patients with HCV-related cirrhosis. Gastroenterology 2012; 143:646–654. [DOI] [PubMed] [Google Scholar]
- 132.Ronot M, Lambert S, Elkrief L, et al. Assessment of portal hypertension and high-risk oesophageal varices with liver and spleen three-dimensional multifrequency MR elastography in liver cirrhosis. Eur Radiol 2014; 24:1394–1402. [DOI] [PubMed] [Google Scholar]
- 133.Palaniyappan N, Cox E, Bradley C, et al. Non-invasive assessment of portal hypertension using quantitative magnetic resonance imaging. J Hepatol 2016; 65:1131–1139. [DOI] [PMC free article] [PubMed] [Google Scholar]
- 134.Berzigotti A, Ashkenazi E, Reverter E, et al. Non-invasive diagnostic and prognostic evaluation of liver cirrhosis and portal hypertension. Dis Markers 2011; 31:129–138. [DOI] [PMC free article] [PubMed] [Google Scholar]
- 135.Motosugi U, Ichikawa T, Koshiishi T, et al. Liver stiffness measured by magnetic resonance elastography as a risk factor for hepatocellular carcinoma: a preliminary case-control study. Eur Radiol 2013; 23:156–162. [DOI] [PubMed] [Google Scholar]
- 136.Trautwein C, Friedman SL, Schuppan D, et al. Hepatic fibrosis: concept to treatment. J Hepatol 2015; 62:S15–S24. [DOI] [PubMed] [Google Scholar]
- 137.Berenguer M, Schuppan D. Progression of liver fibrosis in post-transplant hepatitis C: mechanisms, assessment and treatment. J Hepatol 2013; 58:1028–1041. [DOI] [PubMed] [Google Scholar]
- 138.Loomba R, Sirlin CB, Ang B, et al. Ezetimibe for the treatment of nonalcoholic steatohepatitis: assessment by novel magnetic resonance imaging and magnetic resonance elastography in a randomized trial (MOZART trial). Hepatology 2015; 61:1239–1250. [DOI] [PMC free article] [PubMed] [Google Scholar]