Abstract
BED is characterized by overeating with a loss of control. The primary aim of the study was to measure plasma concentrations of three key gut peptides influencing hunger (ghrelin) and satiety (PYY, GLP-1) to ascertain potential abnormalities in BED. The participants were 10 obese BED and 9 obese nonBED premenopausal women. They did not differ in age, 30.1±8.1 SD, BMI, 36.2±5.9, or % body fat, 43.3±5.7. Following a 13-h overnight fast, blood was drawn (−15, 0, 5, 15, 30, 60, 90, 120 min) for measurement of total plasma concentrations of ghrelin, PYY and GLP-1, pre and post ingestion of a nutritionally complete liquid meal (1256 kJ) at 9 am (0–5 min). Ratings of hunger and fullness preceded each blood draw. Ghrelin was significantly lower premeal at −15 min (P = .05) and postmeal at 90 min (P = .027) and 120 min (P = .025) in the BED group as compared to the nonBED group. Ghrelin also declined less postprandially in the BED group (P = .019) with a longer time to the nadir value (P = .004). However, fasting and meal-related changes in levels of PYY and GLP-1 did not differ between the groups nor did ratings of hunger and fullness. Following a randomized cognitive behavior and dietary intervention, the ghrelin values in BED normalized. Prior to treatment, the lower fasting ghrelin in BED may be a consequence of down-regulation by overeating. The lack of differences in the satiety promoting hormones, PYY and GLP-1, makes them unlikely contributors to the binge eating in BED.
Keywords: obesity, food intake, eating disorders, treatment, cognitive behavior therapy, CBT, nutrition
1. Introduction
Binge eating disorder (BED) entails repeated episodes of excessive food intake with a loss of control but without purging afterwards [1]. Arguably the most common eating disorder, BED is overrepresented among obese individuals and may be contributing to their weight gain. [2]. BED is listed in the Appendix of the DSM IV-TR of the American Psychiatric Association and falls into the Eating Disorder Not Otherwise Specified (EDNOS) category [1]. With the current worldwide epidemic of obesity, BED prevalence has also increased, lending urgency to the study of its pathogenesis. As is the case for obesity, BED is more prevalent in women than in men (3:2) [3]. There is evidence of a biological basis for BED, including a moderate heritability of 0.50 [4], possible, although controversial, association with melanocortin-4 receptor (MCR4) mutation [5,6,7], an enlarged stomach capacity [8,9], and more brain activation in response to binge-type food stimuli [10].
There also may be abnormal circulating levels of peripheral peptide hormones in BED that influence food intake. Key hormones involved in eating behavior include the orexigenic peptide, ghrelin, released primarily from the stomach, and the anorexigenic peptides, glucagon like peptide-1 (GLP-1) and peptide YY (PYY), cosecreted from the L cells in the distal intestine [11]. In normal individuals, ghrelin levels rise prior to a meal and decline following a meal, whereas GLP-1 and PYY levels both increase following a meal (11), but little is known about their pattern in BED. We examined these three gut peptide plasma concentrations pre and post test meal in a group of obese BED and nonBED women. We previously reported lower ghrelin in BED [9,12] but did not examine PYY and GLP-1, which we predicted would be lower, especially postmeal, and thereby contribute to overeating in BED.
2. Methods
2.1 Participants
The participants were 19 obese premenopausal women, in otherwise good health as evaluated by a medical history and physical examination, including an electrocardiogram and fasting blood samples for a chemistry panel and complete blood cell count. Ten women met full criteria for BED, with reported binge eating episodes (more than twice the size of a normal meal) on two or more days/week for the past 6 mo, and nine women did not report any binge eating (nonBED). The diagnosis was based on the Questionnaire on Eating and Weight Patterns (QEWP) (3) followed by a clinical interview with a clinical psychologist (M.E.G). The frequency of binge eating days in the BED group was 3.2 d ± 0.8 SD. None of the participants had current suicidal ideation or had been hospitalized for depression or other psychiatric disorders. The two groups did not differ in age, BMI, or % body fat (Table 1). Body fat was estimated by bioelectrical impedance analysis (BIA), using a Tanita instrument (TBF-300A) just prior to the physical examination. (One nonBED participant did not have the measurement.) Participants were asked to fast overnight and eat a standard dinner meal between 7 and 8 pm the evening prior to the day of the test meal. They all signed consent forms approved by the hospital IRB.
Table 1.
Characteristics of the Obese Women by Group (means ± SD)
| * Group | N | Age | BMI (kg/m2) | # Body Fat % |
|---|---|---|---|---|
| BED | 10 | 29.9 ± 8.2 | 36.5 ± 6.6 | 44.1 ± 6.8 |
| NB | 9 | 30.3 ± 8.4 | 35.8 ± 5.5 | **42.2 ± 4.2 |
| Total | 19 | 30.1 ± 8.1 | 36.2 ± 5.9 | 43.3 ± 5.7 |
BED - Binge Eating Disorder, NB - Non-Binge Eater
Bioelectrical Impedance Analysis
n = 8
Note: None of these characteristics differed significantly by group.
2.2 Procedure
The participants arrived at the hospital in the morning and reported the time of their prior evening dinner meal. An intravenous butterfly catheter, kept patent with a slow saline drip, was inserted at 8:15 am, and the participant rested in a reclined seated position for 30 min to allow for adaptation to the venipuncture. The initial baseline blood draw was at 8:45 am (−15 min), and subsequent blood samplings were at: 0, 5, 15, 30, 60, 90, and 120 min. A nutritionally complete (24% protein, 55% carbohydrate, and 21% fat of the total energy value, 1254 kJ) liquid test meal (300 ml Boost [Mead Johnson] and 300 ml water) was provided at 9 am. The meal was designed to have the energy value of a breakfast and was served at a temperature of 10°C. The participant was asked to consume the meal through a straw from a graduated beaker at a constant rate in order to finish in 5 min, with a timer visible. Appetite ratings on a visual analog scale (0–100) of hunger and fullness preceded each of the blood draws.
Blood samples were collected in tubes prepared with EDTA and aprotinin (Trasyol) and kept on ice for 2 min. The samples were then cold centrifuged (2800 RPM) for 15 min, and the plasma stored in cryo-microtubes at −80 °C. All plasma samples were assayed in duplicate. Total ghrelin (acylated and desacylated) was measured with a radioimmunoassay (RIA) from Phoenix Pharmaceuticals (intra-assay CV = 5.8, inter-assay = 6.35). Total GLP-1 (amidated and non-amidated forms) was assayed with an RIA kit from Linco (intra-assay CV = 31.0, inter-assay CV = 17.0). Finally, total PYY (1-36 and 3-36) was assayed with RIA kits (intra-assay CV = 5.3, inter-assay CV = 7.0) from Linco.
2.2.1 Intervention
Eight BED and 8 nonBED participants (2 BED and 1 nonBED did not continue) were randomly assigned for 6 weeks to either (a) individual weekly treatment with nutritional counseling and cognitive behavior therapy or (b) a non-treatment control. The treatment was based on the Learn Manual (13), which employs a combined approach for both obesity and binge eating. The test meal protocol was repeated after the intervention period.
2.3 Data analysis
General linear model (GLM) for mixed model repeated measures ANOVA was employed with the BED group (IV), as a fixed factor to examine changes in plasma concentrations and appetite ratings (DVs), over successive time points. The same analytic approach was used with the BED group, intervention condition, and remission status as fixed factors (IVs) to examine changes from before to after the intervention period within individuals. Covariates were entered as appropriate, such as weight change. MANOVA was used to examine absolute values in plasma concentrations and appetite ratings at multiple time points as well as area under the curve (AUC). Area under the curve (AUC) was calculated for plasma levels and appetite ratings using trapezoidal approximation. Two-tailed P ≤ .05 was required for statistical significance (SPSS 15.0).
3. Results
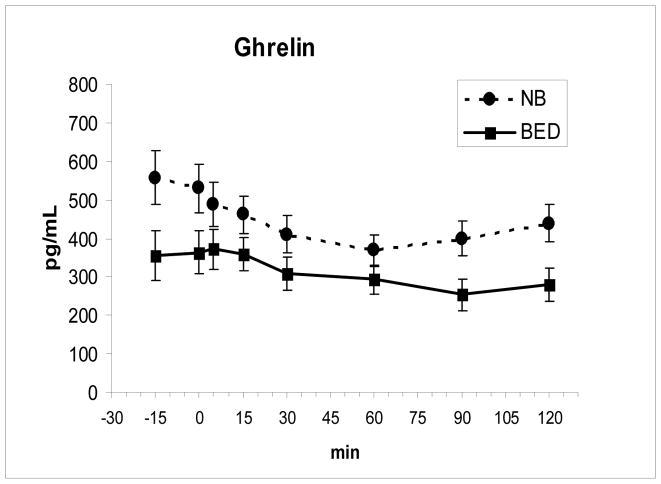
Ghrelin was lower in the BED group at −15 min, F (1,16) = 4.49, P = .05, and postprandially at 90 min, F(1,16) = 5.92, P = .027, and 120 min, F (1,16) = 6.13, P = .025. Ghrelin declined across groups, F (7,112) = 16.0, P < .00001, but declined less postprandially in the BED group, F (7, 112) = 2.53, P = .019 (Fig 1). The time to the nadir value for ghrelin was also longer for the BED group, 81.0 min ± 20.2 SD relative to the nonBED group, 52.5 min ± 13.9, F(1,16) = 11.46, P = .04. The AUC for ghrelin showed a trend to be lower for BED, F (1,16) = 3.86, P = .067 than for nonBED. The reported time of the prior dinner meal did not differ between groups.
Fig. 1.
In the BED group, fasting ghrelin levels (mean ± SE) were lower at −15 min (P = .05), and postprandial ghrelin levels (meal ingested from 0–5 min) were lower at 90 min (P = .027) and 120 min (P = .025) compared to nonBED (NB). Ghrelin levels also declined less after the meal (P = .019) in BED compared to NB.
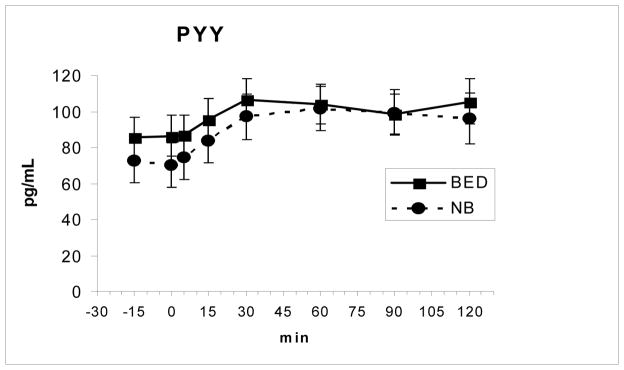
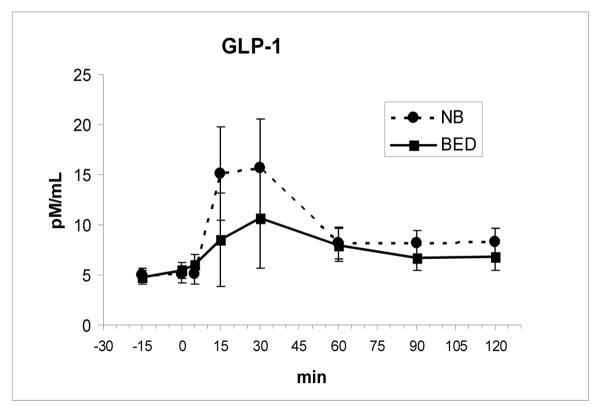
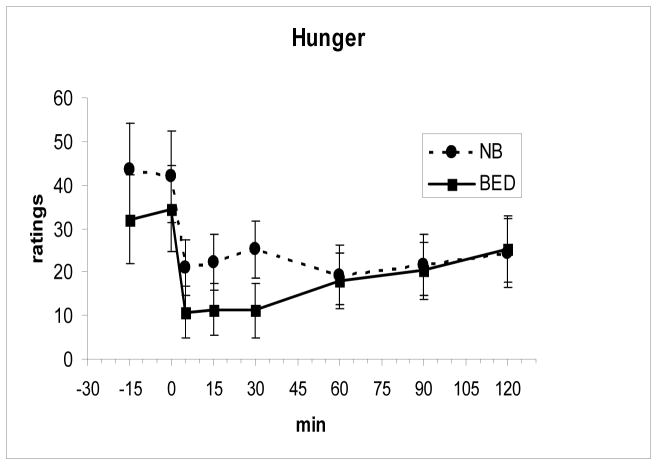
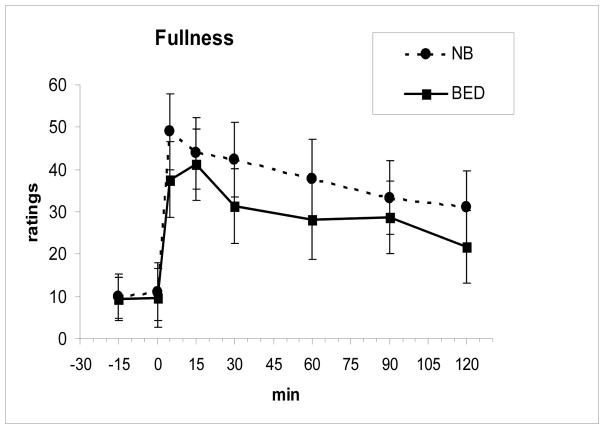
Fasting and meal-related changes in levels of PYY and GLP-1 as well as the time to the peak level and AUCs did not differ between the two groups (Fig 2 and Fig 3). Both PYY, F(7, 112 = 11.0, P < .00001, and GLP-1, F(7,112) = 3.85, P = .001, showed significant meal-related increases across groups. There were also no differences in the fasting or meal-related hunger and fullness ratings including AUCs between groups (Fig 4 and Fig 5).
Fig. 2.
PYY levels (mean ± SE) increased following the meal, ingested from 0–5 min, but did not differ between groups
Fig. 3.
GLP-1 levels (mean ± SE) increased after the meal, ingested from 0–5 min, but did not differ between groups.
Fig. 4.
Hunger ratings (mean ± SE) decreased after the meal, ingested from 0–5 min, but did not differ between groups.
Fig. 5.
Fullness ratings (mean ± SE) increased after the meal, ingested from 0–5 min, but did not differ between groups.
3.1 Intervention
Following the intervention period, the treated group lost 4.4 kg ± 2.6 whereas the untreated grouped gained 0.3 kg ± 1.3, F(1,11) = 16.7, p = .002, which did not differ by BED group. Also all the BED S’s in the treated group remitted (no longer met criteria for BED), with frequency of binge eating days declining from 2.75±0.5 to 0.8 ±1.4, F(1,3) = 121.0, p = .002. One of the BED S’s in the untreated group also remitted, with frequency of binge days in that group declining from 3.8±1.0 to 2.0 ± 1.6, F(1,3) = 5.4, p = .10, ns.
The changes in the ghrelin levels that initially differed significantly between BED groups, were compared within the BED group from before to after the intervention period. Ghrelin at −15 min increased from 364 pg/mL ±99 to 552 ±178, F(1,7) = 7.8, p = .027; at 90 min from 251 ± 66 to 449 ± 181, F(1,7) = 9.3, P = .019; and at 120 min from 281 ± 69 to 433 ±176, F(1,7) = 6.4, P = .039. AUC ghrelin also increased from 41,591 pg/L*min ± 9286 to 64323 pg/L*min ± 23484, F(1,7) = 7.7, p = .027. These changes remained significant after controlling for weight change. For these ghrelin changes, the interactions with treatment condition, remission status, or change in binge frequency were not significant.
For the measurements following the intervention, there were no longer differences in ghrelin at −15, 90, and 120 min, or AUC that originally differed between the BED groups. The AUCs for PYY and GLP-1 or for hunger and fullness also did not differ by group. The above measures did not differ by intervention condition, or show interactions between group and intervention condition.
4. Discussion
The lower fasting ghrelin levels and smaller postprandial decline in the BED group is consistent with our previous findings [9, 12]. The finding of lower ghrelin may seem counterintuitive because ghrelin, a peptide that stimulates hunger, might be expected to be higher in BED. These differences in ghrelin between groups could not be attributed to differences in BMI or body fat, hunger ratings at time −15 min, or the reported time of the prior dinner meal, as none of these differed between groups.
Consistent with these ghrelin results, fasting ghrelin has been found to be found to be lower in both lean and obese female BED than in nonBED counterparts [13], suggesting that BED status, rather than overweight category, is the more relevant characteristic. The lower fasting ghrelin in BED may represent down regulation in response to overeating. Previously, we found a significant negative correlation between gastric capacity, which was increased in BED, and ghrelin levels suggesting that a large gastric capacity may help mediate the reduction in ghrelin [9]. Conceivably, however, the smaller decline in ghrelin postmeal in BED may itself promote more eating. The absence of significant differences in ghrelin levels following an intervention is consistent with a previous report [12]. In the present study, the lack of differences in ghrelin levels following treatment suggests normalization resulted from the treatment, without conclusive evidence, however, since the changes in ghrelin pre to post intervention were not significantly related to treatment condition, remission status, or change in frequency of binge eating days.
In contrast to ghrelin, fasting and meal-related changes in plasma concentrations of the satiety promoting hormones PYY and GLP-1 did not differ between the BED groups. The lack of group differences in PYY and GLP-1 makes these peptides unlikely to be involved in the overeating in BED. We previously reported no differences between obese BED and nonBED groups in pre and postmeal levels of glucose, insulin, leptin, and CCK [12]. Thus, the negative results in the current study for PYY and GLP-1, two “ileal brake” peptides, extends the prior list of negative candidates while strengthening the case for ghrelin.
4.1 Limitations
Selected appetite-related hormones were studied in a relatively small sample of each diagnostic group, which became even smaller following the intervention. We also did not specifically measure the active forms of these peptides: acylated ghrelin, active GLP-1, and PYY3-36. Nevertheless, the assays for the total hormones measured the sum of the active and inactive forms. For ghrelin, the total and active forms correlate significantly with each other, r = .62 [16]. For PYY, the predominant form in humans is the active form, PYY 3-36, which closely tracks total PYY in response to a meal [16]. Likewise active GLP-1 shows a similar response to total GLP-1 following a glucose meal [17]. Although the test meal, designed for breakfast, was relatively small, the energy value was adequate to lead to significant postprandial declines in ghrelin and significant increases in GLP-1 and PYY. The meal represented a specific mixture of macronutrients that was high in CHO (55% by energy), but since ghrelin is most responsive to CHO [18,19] the meal provided a reasonable test of ghrelin responsivity.
4.2 Conclusions
BED participants had lower plasma ghrelin concentrations premeal which then declined less postmeal than nonBED obese controls. The lower ghrelin in BED relative to non-BED is consistent with lower ghrelin in obese compared to lean individuals and suggests down regulation of ghrelin by chronic binge eating. Treatment of BED may help reverse this abnormality. There were no differences among BED and nonBED participants in the satiety peptides GLP-1 or PYY, pre and postmeal, either before or after treatment, making these peptides unlikely maintenance factors of the disorder.
Acknowledgments
Funding was in part by NIH grant DK074046 (AG), the Hormone-Metabolite Core of the NY Obesity Research Center (P30DK026687) provided hormone assays, and the Columbia GCRC (MO1 RR0064529) provided outpatient services.
Footnotes
Publisher's Disclaimer: This is a PDF file of an unedited manuscript that has been accepted for publication. As a service to our customers we are providing this early version of the manuscript. The manuscript will undergo copyediting, typesetting, and review of the resulting proof before it is published in its final citable form. Please note that during the production process errors may be discovered which could affect the content, and all legal disclaimers that apply to the journal pertain.
References
- 1.American Psychiatric Association. Diagnostic and Statistical Manual of Mental Disorders. 4. Washington, DC: 2000. Text Revision ed. [Google Scholar]
- 2.Ochner CN, Geliebter A. Binge eating disorder. Obes Management. 2007;3:161–164. [Google Scholar]
- 3.Yanovski SZ. Binge eating disorder: current knowledge and future directions. Obes Res. 1993;1:306–24. doi: 10.1002/j.1550-8528.1993.tb00626.x. [DOI] [PubMed] [Google Scholar]
- 4.Bulik CM, Sullivan PF, Kendler KS. Genetic and environmental contributions to obesity and binge eating. Int J Eat Disord. 2003;33:293–8. doi: 10.1002/eat.10140. [DOI] [PubMed] [Google Scholar]
- 5.Branson R, Potoczna N, Kral JG, Lentes KU, Hoehe MR, Horber FF. Binge eating as a major phenotype of melanocortin 4 receptor gene mutations. N Engl J Med. 2003;348:1096–103. doi: 10.1056/NEJMoa021971. [DOI] [PubMed] [Google Scholar]
- 6.Tao YX, Segaloff DL. Functional analysis of melanocortin-4 receptor mutations identified from patients with binge eating disorder and nonobese or obese subjects. J Clin Endocrinol Metab. 2005;90:5632–8. doi: 10.1210/jc.2005-0519. [DOI] [PubMed] [Google Scholar]
- 7.Hebebrand J, Geller F, Dempfle A, et al. Binge-eating episodes are not characteristic of carriers of melanocortin-4 receptor gene mutations. Mol Psychiatry. 2004;9:796–800. doi: 10.1038/sj.mp.4001491. [DOI] [PubMed] [Google Scholar]
- 8.Geliebter A, Hashim SA. Gastric capacity in normal, obese, and bulimic women. Physiol Behav. 2001;74:743–6. doi: 10.1016/s0031-9384(01)00619-9. [DOI] [PubMed] [Google Scholar]
- 9.Geliebter A, Yahav EK, Gluck ME, Hashim SA. Gastric capacity, test meal intake, and appetitive hormones in binge eating disorder. Physiol Behav. 2004;81:735–40. doi: 10.1016/j.physbeh.2004.04.014. [DOI] [PubMed] [Google Scholar]
- 10.Geliebter A, Ladell T, Logan M, Schneider T, Sharafi M, Hirsch J. Responsivity to food stimuli in obese and lean binge eaters using functional MRI. Appetite. 2006;46:31–35. doi: 10.1016/j.appet.2005.09.002. [DOI] [PubMed] [Google Scholar]
- 11.Hellstrom PM, Geliebter A, Naslund E, Schmidt PT, Yahav E, Hashim SA, Yeomans MR. Peripheral and central signals in the control of eating in normal, obese and binge-eating human subjects. Br J Nutr. 2004;92(Suppl 1):S47–S57. doi: 10.1079/bjn20041142. [DOI] [PubMed] [Google Scholar]
- 12.Geliebter A, Gluck ME, Hashim SA. Plasma ghrelin concentrations are lower in binge-eating disorder. J Nutr. 2005;135:1326–30. doi: 10.1093/jn/135.5.1326. [DOI] [PubMed] [Google Scholar]
- 13.Brownell KD. The LEARN®Program for Weight Management. 10. American. Health; Dallas, Texas: 2004. [Google Scholar]
- 14.Monteleone P, Fabrazzo M, Tortorella A, Martiadis V, Serritella C, Maj M. Circulating ghrelin is decreased in non-obese and obese women with binge eating disorder as well as in obese non-binge eating women, but not in patients with bulimia nervosa. Psychoneuroendocrinology. 2005;30:243–50. doi: 10.1016/j.psyneuen.2004.07.004. [DOI] [PubMed] [Google Scholar]
- 15.Marzullo P, Verti B, Savia G, Walker GE, Guzzaloni G, Tagliaferri M, Di Blasio A, Liuzzi A. The relationship between active ghrelin levels and human obesity involves alterations in resting energy expenditure. J Clin Endocrinol Metab. 2004;89:936–9. doi: 10.1210/jc.2003-031328. [DOI] [PubMed] [Google Scholar]
- 16.Pfluger PT, Kampe J, Castaneda TR, Vahl T, D’Alessio DA, Kruthaupt T, Benoit SC, Cuntz U, Rochlitz HJ, Moehlig M, Pfeiffer AF, Koebnick C, Weickert MO, Otto B, Spranger J, Tschöp MH. Effect of human body weight changes on circulating levels of peptide YY and peptide YY3-36. J Clin Endocrinol Metab. 2007;92:583–8. doi: 10.1210/jc.2006-1425. [DOI] [PubMed] [Google Scholar]
- 17.Korosi J, McIntosh CH, Pederson RA, Demuth HU, Habener JF, Gingerich R, Egan JM, Elahi D, Meneilly GS. Effect of aging and diabetes on the enteroinsular axis. J Gerontol A Biol Sci Med Sci. 2001;56:M575–9. doi: 10.1093/gerona/56.9.m575. [DOI] [PubMed] [Google Scholar]
- 18.Erdmann J, Töpsch R, Lippl F, Gussmann P, Schusdziarra V. Postprandial response of plasma ghrelin levels to various test meals in relation to food intake, plasma insulin, and glucose. J Clin Endocrinol Metab. 2004;89:3048–3054. doi: 10.1210/jc.2003-031610. [DOI] [PubMed] [Google Scholar]
- 19.Monteleone P, Bencivenga R, Longobardi N, Serritella C, Maj M. Differential responses of circulating ghrelin to high-fat or high-carbohydrate meal in healthy women. J Clin Endocrinol Metab. 2003;88:5510–5514. doi: 10.1210/jc.2003-030797. [DOI] [PubMed] [Google Scholar]


