

Abstract
BACKGROUND
In the Systolic Blood Pressure Intervention Trial (SPRINT), adults at high risk for cardiovascular disease who received intensive systolic blood-pressure control (target, <120 mm Hg) had significantly lower rates of death and cardiovascular disease events than did those who received standard control (target, <140 mm Hg). On the basis of these data, we wanted to determine the lifetime health benefits and health care costs associated with intensive control versus standard control.
METHODS
We used a microsimulation model to apply SPRINT treatment effects and health care costs from national sources to a hypothetical cohort of SPRINT-eligible adults. The model projected lifetime costs of treatment and monitoring in patients with hypertension, cardiovascular disease events and subsequent treatment costs, treatment-related risks of serious adverse events and subsequent costs, and quality-adjusted life-years (QALYs) for intensive control versus standard control of systolic blood pressure.
RESULTS
We determined that the mean number of QALYs would be 0.27 higher among patients who received intensive control than among those who received standard control and would cost approximately $47,000 more per QALY gained if there were a reduction in adherence and treatment effects after 5 years; the cost would be approximately $28,000 more per QALY gained if the treatment effects persisted for the remaining lifetime of the patient. Most simulation results indicated that intensive treatment would be cost-effective (51 to 79% below the willingness-to-pay threshold of $50,000 per QALY and 76 to 93% below the threshold of $100,000 per QALY), regardless of whether treatment effects were reduced after 5 years or persisted for the remaining lifetime.
CONCLUSIONS
In this simulation study, intensive systolic blood-pressure control prevented cardiovascular disease events and prolonged life and did so at levels below common willingness-to-pay thresholds per QALY, regardless of whether benefits were reduced after 5 years or persisted for the patient’s remaining lifetime. (Funded by the National Heart, Lung, and Blood Institute and others; SPRINT ClinicalTrials.gov number, NCT01206062.)
THE MOST EFFECTIVE BLOOD-PRESSURE goals for treatment with antihypertensive medications are uncertain. Treating hypertension to standard systolic blood-pressure goals is cost-saving or cost-effective among patients at high risk for cardiovascular disease in the United States.1 However, until recently, evidence from randomized trials did not clearly support intensive control of systolic blood pressure.2–4
The Systolic Blood Pressure Intervention Trial (SPRINT) showed significant reductions in the rates of death and cardiovascular disease events with intensive systolic blood-pressure control (intensive control; target, <120 mm Hg) versus standard control (target, <140 mm Hg) among adults at high risk for cardiovascular disease who had no history of diabetes, stroke, or heart failure.5,6 Intensive control may prevent cardiovascular disease events in high-risk patients and reduce health care costs, as compared with standard control, but these benefits must be weighed against the increased risk of serious adverse events and higher implementation costs (e.g., additional office visits, laboratory tests, and medications). The purpose of this SPRINT cost-effectiveness study was to estimate lifetime health gains and averted health care costs with intensive control after considering increased treatment costs and the risks of treatment-related serious adverse events.
METHODS
MICROSIMULATION MODEL
We developed a microsimulation model to estimate costs, clinical outcomes, and quality-adjusted life-years (QALYs) of systolic blood-pressure control in SPRINT-eligible adults (Fig. 1; and Figs. S1 and S2 in the Supplementary Appendix, available with the full text of this article at NEJM.org). The model compared the lifetime incremental cost-effectiveness of intensive control with that of standard control with the use of 6-month cycles. We accounted for health gained and lost to society due to intensive control and for payers’ direct health care costs; patients’ indirect costs were not included.
Figure 1. Structure of the SPRINT Simulation Model.
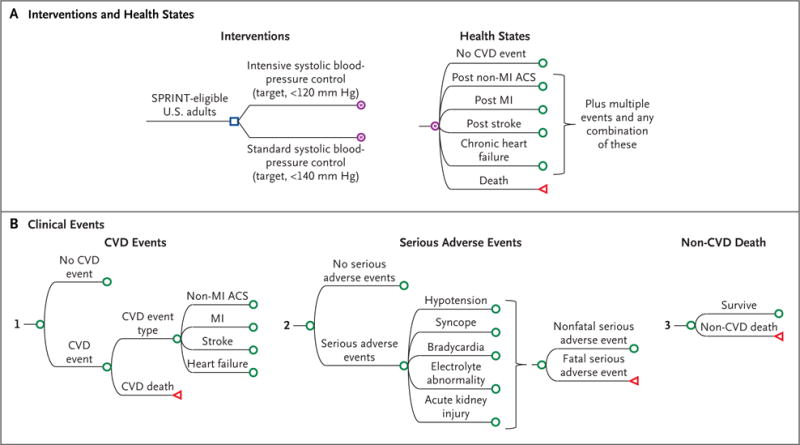
Shown is the microsimulation model used to estimate costs, clinical outcomes, and quality-adjusted life-years of intensive control of systolic blood pressure in adults who were eligible to participate in the Systolic Blood Pressure Intervention Trial (SPRINT). (A complete list of the eligibility criteria for participation in SPRINT is provided in the Methods section in the Supplementary Appendix.) Panel A shows the two interventions — intensive control and standard control of systolic blood pressure — and health states of the patients, and Panel B shows the three categories of subsequent clinical events: cardiovascular disease (CVD) events, serious adverse events, and death from causes other than cardiovascular disease. The blue square indicates the decision node, the point at which a treatment strategy is chosen; the purple encircled letter “M” indicates the Markov node, with branches indicating the health states in transition every 6 months; the green circle indicates the chance node, after which there is a probability of the occurrence of each event; and the red triangle indicates the terminal node, the end of a pathway within a 6-month cycle. ACS denotes acute coronary syndrome, and MI myocardial infarction.
We used SPRINT results to estimate the risk of death from all causes and from cardiovascular causes, cardiovascular disease events, and serious adverse events in 10,000 hypothetical patients who shared the same baseline characteristics, inclusion criteria, and number of intervention medications with SPRINT participants (Table 1, and Table S1 in the Supplementary Appendix).6 Cardiovascular disease events included acute myocardial infarction, acute coronary syndrome not resulting in myocardial infarction, stroke, and heart failure. Serious adverse events of interest were hypotension, syncope, bradycardia, electrolyte abnormalities, and acute kidney injury.6
Table 1.
Selected Input Values, Ranges, and Distributions for the SPRINT Cost-Effectiveness Model.*
| Probability | Source | Base-Case Value | Distribution | ||
|---|---|---|---|---|---|
| Mean | Minimum | Maximum | |||
| First cardiovascular disease event or death in the base-case scenario: primary outcome | |||||
| During first 5 yr or with medication adherence afterward (rate per 100 person-yr) | SPRINT | ||||
| Intensive control | 1.65±0.52 | 1.23 | 2.30 | Beta | |
| Standard control | 2.19±0.59 | 1.71 | 2.93 | Beta | |
| Hazard ratio | 0.75 | 0.64 | 0.89 | Log-normal | |
| With nonadherence after first 5 yr | Pooled Cohort risk equations† | ||||
| Cardiovascular disease event | |||||
| Fatal event (%) | SPRINT | ||||
| Intensive control | 15.23±2.30 | 11.43 | 20.51 | Beta | |
| Standard control | 20.38±2.25 | 16.46 | 25.30 | Beta | |
| Risk of recurrent event or death | Pooled Cohort risk equations† | ||||
| Death from noncardiovascular causes | |||||
| During first 5 yr (rate per 100 person-yr) | SPRINT | ||||
| Intensive control | 0.78±0.18 | 0.52 | 1.26 | Beta | |
| Standard control | 0.96±0.20 | 0.66 | 1.49 | Beta | |
| Hazard ratio | 0.81 | 0.64 | 1.03 | Log-normal | |
| After first 5 yr | CDC life tables excluding major cardiovascular disease‡ | ||||
| Serious adverse events | |||||
| Rate per 100 person-yr§ | SPRINT | ||||
| Intensive control | 4.10±0.24 | 3.66 | 4.60 | Beta | |
| Standard control | 2.88±0.20 | 2.51 | 3.30 | Beta | |
| Hazard ratio | 1.43 | 1.26 | 1.62 | Log-normal | |
| Kidney disease | |||||
| Chronic kidney disease (rate per 100 person-yr) | SPRINT | ||||
| Intensive control | 1.18±0.28 | 0.80 | 1.89 | Beta | |
| Standard control | 0.34±0.16 | 0.18 | 0.80 | Beta | |
| Hazard ratio | 3.49 | 2.44 | 5.10 | Log-normal | |
| End-stage renal disease after chronic kidney disease | U.S. Renal Data System¶ | 0.77±0.33 | 0.43 | 1.72 | Beta |
Plus–minus values are means ±SD. Hazard ratios were used in the model to determine the risk with intensive control relative to standard control. The complete list of input values is provided in Table S1 in the Supplementary Appendix. Minimum and maximum values were preferentially derived from reported 95% confidence intervals or ranges or from calculated 95% confidence intervals with the use of variance estimates as available. CDC denotes Centers for Disease Control and Prevention, and SPRINT Systolic Blood Pressure Intervention Trial.
Data for the Pooled Cohorts are from the American College of Cardiology and the American Heart Association.7
Data are from Arias et al.8
Serious adverse events were those that were fatal, life-threatening, or resulted in an emergency department visit (including hypotension, syncope, bradycardia, electrolyte abnormality, and acute kidney injury).
Data are from the 2015 Annual Data Report of the U.S. Renal Data System.9
PROBABILITY OF CLINICAL EVENTS
For the first 5 years of the simulation, we assumed that patients had adhered to medications as observed in SPRINT and were at risk for treatment-related serious adverse events, first fatal or nonfatal cardiovascular disease events, and death from causes other than cardiovascular disease as reported for their assigned study groups. For survivors of incident cardiovascular disease events in the base case, we used risk equations of the American College of Cardiology and the American Heart Association (ACC–AHA) Pooled Cohorts7 to determine the risk of repeated cardiovascular disease events. We varied these estimates in scenario analyses. Other probabilities were derived from national sources and published literature (Table 1, and Table S1 in the Supplementary Appendix).
During the initial 5-year period, our estimates of risks and benefits of intensive control versus standard control reflected the medication adherence of the SPRINT participants. After the initial 5-year period, we used four post-trial persistence-of-treatment-effect scenarios to simulate the degree to which the effects of intensive control would persist for patients’ remaining lifetimes. The four scenarios used different assumptions about the prevalence and duration of treatment adherence. In all four scenarios, we estimated the risks of a first cardiovascular disease event or serious adverse event in the subgroup of patients who were assumed to maintain treatment adherence similar to that of SPRINT participants on the basis of observed SPRINT estimates for their assigned study group. In this model, patients who did not adhere to their medication regimen reverted to their baseline, pretrial systolic blood pressure, and we used the Pooled Cohort risk equations to estimate the risk of a cardiovascular disease event on the basis of the systolic blood pressure and other characteristics.7 In all the patients, we based the competing risk of death from causes other than cardiovascular disease on the life tables of the Centers for Disease Control and Prevention.8
In the first scenario (base case), we simulated the possibility that medication adherence and therefore treatment effects would be gradually reduced after the first 5 years in the two study groups until 15 years after baseline, after which all the patients would no longer adhere to their assigned treatment (Tables S2 and S3 in the Supplementary Appendix). The probability of treatment adherence after the initial 5 years was stratified according to the number of antihypertensive medications (i.e., lower adherence was associated with an increased number of medications).10–12 In the second scenario (worst case), patients stopped adhering to their medication regimen immediately after the initial 5-year period. In the third scenario (15-year best case), patients adhered to their medication regimen and had treatment effects (including those after a cardiovascular disease event) that persisted for 15 years, after which all the patients immediately did not adhere to the medication regimen. Finally, in the fourth scenario (lifetime best case), patients had age-stratified SPRINT in-trial adherence and treatment effects that persisted over their remaining lifetime.
COSTS
We calculated the total direct medical costs over the remaining lifetime of the patients. These costs included those associated with the intervention (i.e., medications, office visits, and laboratory monitoring), with acute and chronic cardiovascular disease events, with acute serious adverse events, and with background health care for the treatment of noncardiovascular diseases (Tables S1 and S4 in the Supplementary Appendix). Medication costs were calculated with the use of a weighted average cost of generic formulary medications used in SPRINT, the distribution of prescribed medication classes in SPRINT, and wholesale acquisition costs.6,13 We derived the costs of office visits and laboratory monitoring from the schedules for physician and laboratory fees from the Centers for Medicare and Medicaid Services.14,15 Other costs were calculated from common sources and were stratified according to age and separated by cost type.16–18 All cost inputs were inflated to 2017 U.S. dollars.19 Future costs and QALYs were discounted at 3% annually.
UTILITY VALUES OF HEALTH STATES
Utility values, an overall assessment of well-being on a scale of 0 (death) to 1 (perfect health without disability), reflect the severity of disability in health states. We derived utility values that were specific for patients’ long-term health state from the results on the EuroQol Group 5-Dimension Self-Report Questionnaire (EQ-5D) from the Medical Expenditure Panel Survey for the base case and EQ-5D results directly measured in SPRINT in a scenario analysis.20 Disutility and costs were applied for acute cardiovascular disease events and acute kidney injury for 4 weeks and for other serious adverse events for 2 weeks.1,21,22 After the occurrence of cardiovascular disease events, disutility penalties and costs were applied for long-term sequelae.
MODEL VALIDATION
We validated the model quantitatively (i.e., comparing model predictions with the event rates that were observed in SPRINT) and by visual inspection (i.e., comparing cumulative incidence curves between SPRINT observations and model predictions). We compared the predicted and observed cumulative incidence of and hazard ratios for the primary outcome of a first fatal or nonfatal cardiovascular disease event at the median follow-up (3.3 years) in SPRINT. For longer-term validation, we visually compared model predictions with the cumulative incidence of atherosclerotic cardiovascular disease events in the Framingham Heart Study cohorts.23
SENSITIVITY ANALYSES
We varied each input value in the model over a plausible range in one-way sensitivity analyses to examine the effect of uncertainty regarding individual values on the results. Scenario analyses examined the effect of various assumptions with respect to medication adherence (including self-reported adherence, as measured in SPRINT with the use of an eight-item Morisky adherence scale24,25), a restricted time horizon, the risk of death from causes other than cardiovascular disease, the number of office and laboratory visits, the risk of serious adverse events, the costs of antihypertensive medication and background health care, a substitution of the characteristics of SPRINT-eligible adults in the general U.S. population,26 alternative utility estimates, and pill-taking disutility (i.e., the overall health state [utility value] of daily pill-taking) (Tables S3 and S5 in the Supplementary Appendix). To reassess cost-effectiveness in case the Pooled Cohort risk equations underestimated the risk of repeated cardiovascular disease events, we included a scenario that substituted a higher average risk of such events as predicted by the Framingham Recurrent Coronary Heart Disease calculator.27 To assess whether the Pooled Cohort risk equations overestimated the risk of incident cardiovascular disease, we adjusted the predicted risk to reflect the lower average risk of cardiovascular disease of more contemporary cohorts.28 In probabilistic sensitivity analyses, the model was run 1000 times, each taking random draws from prespecified uncertainty distributions of all inputs.
STUDY OVERSIGHT
The authors wrote the manuscript and attest to the completeness and accuracy of the data and analysis. The manuscript was reviewed and approved by the SPRINT steering committee and publications subcommittee. In this study, since we were performing secondary analyses of deidentified data, we sought no approval from institutional review boards. The institutional review board at each trial site and an independent data and safety monitoring board reviewed, approved, and monitored the conduct of SPRINT while the original trial was being performed.
RESULTS
MODEL VALIDATION
The microsimulation model accurately reproduced the risks and cumulative incidence curves for the primary outcome, components of the primary outcome, and serious adverse events in SPRINT during the 5-year trial period (Table S6 and Fig. S3 in the Supplementary Appendix). Base-case simulated incidence rates for the SPRINT primary outcome at 3.3 years were 17.3 events per 1000 person-years in the intensive-control group and 22.2 events per 1000 person-years in the standard-control group, as compared with 16.5 and 21.9 events per 1000 person-years, respectively, in the actual trial. The predicted hazard ratio for the primary outcome in the simulation was 0.78 (95% confidence interval [CI], 0.70 to 0.87), as compared with the observed hazard ratio of 0.75 (95% CI, 0.64 to 0.89). Long-term validation of the microsimulation model is shown in Figure S4 in the Supplementary Appendix.
MAIN ANALYSIS
In the base-case scenario, in which adherence and treatment effects are reduced after 5 years, the model predicted that intensive control would prevent 170 incident primary outcome events and 190 deaths from cardiovascular disease over the remaining lifetime of 10,000 patients, as compared with standard treatment (Fig. 2A, and Table S7 and Figs. S5, S6, and S7 in the Supplementary Appendix). In the best-case scenario, 929 primary outcome events and 464 deaths from cardiovascular disease would be prevented. Background health care costs were the largest component of lifetime health care costs (Fig. 2B, and Table S8 and Fig. S8 in the Supplementary Appendix). The higher costs that were associated with increased survival, treatment for hypertension, and serious adverse events with intensive control were offset by decreased costs for the treatment of cardiovascular disease.
Figure 2. Incidence Rate Ratios for the Primary Outcome and Incremental Direct Medical Costs for Intensive versus Standard Control, According to Four Scenarios for Medication Adherence and Treatment Effect.

Panel A shows incidence rate ratios for the SPRINT primary outcome (the first occurrence of myocardial infarction, acute coronary syndrome not resulting in myocardial infarction, stroke, heart failure, or death from cardiovascular causes) for intensive control versus standard control of systolic blood pressure during the simulation over different time periods. The results are shown according to the four post-trial persistence-of-treatment-effect scenarios: base case (i.e., reduced adherence to the medication regimen and treatment effects after 5 years until total nonadherence and no treatment effects at 15 years), worst case (i.e., nonadherence and no treatment effects after 5 years), best case until 15 years (i.e., in-trial adherence and persistence of treatment effects for 15 years), and lifetime best case (i.e., lifetime in-trial adherence and persistence of treatment effects). Although the assumptions and input were identical for all four scenarios for the first 5 years of the simulation, there were small differences in the incidence rate ratios for cardiovascular disease events for the period from 0 to 5 years that reflect the role of chance in the microsimulation approach. The I bars indicate 95% confidence intervals. Panel B shows the range of mean cumulative incremental direct medical costs of intensive control versus standard control of systolic blood pressure, according to the expenditure — including costs associated with serious adverse events, treatment, background health care for the treatment of noncardiovascular diseases, chronic cardiovascular disease (CVD), or CVD event — in the four post-trial persistence-of-treatment-effect scenarios over time.
In the base case, intensive control cost approximately $47,000 more per QALY gained than standard control (Table 2). In 1000 probabilistic simulations, there was a 54% probability that intensive control was cost-effective at a willingness-to-pay threshold of $50,000 per QALY and a 79% probability at a threshold of $100,000 per QALY. Cost-effectiveness acceptability curves are provided in Figure 3, and cost-effectiveness scatter plots are shown in Figure S9 in the Supplementary Appendix. Health gains and cost-effectiveness were sensitive to whether the benefits of intensive control extended past the 5-year trial period. In the best-case scenario in which adherence and treatment effects persisted over the patient’s lifetime, intensive control cost approximately $28,000 per QALY gained; the probability that intensive control was cost-effective increased to 79% at $50,000 per QALY and to 93% at $100,000 per QALY.
Table 2.
Lifetime Direct Medical Costs, Effectiveness, and Incremental Cost-Effectiveness for Intensive Control versus Standard Control of Systolic Blood Pressure.*
| Scenario | Mean Total Cost | Mean Remaining Lifetime QALYs | ICER | Probability of Cost-Effectiveness | ||||||
|---|---|---|---|---|---|---|---|---|---|---|
| Intensive Control |
Standard Control |
Difference (95% UI) |
Intensive Control |
Standard Control |
Difference (95% UI) |
$50K per QALY |
$100K per QALY |
$150K per QALY |
||
| dollars | dollars | percent | ||||||||
| Base case | 284,637 | 271,841 | 12,796 (−872 to 26,551) |
12.45 | 12.17 | 0.27 (−0.06 to 0.64) |
46,546 | 54 | 79 | 86 |
| Worst case | 283,401 | 270,965 | 12,436 (−2,148 to 28,091) |
12.31 | 12.06 | 0.25 (−0.11 to 0.61) |
49,851 | 51 | 76 | 84 |
| Best case for 15 yr | 286,161 | 274,163 | 11,998 (−862 to 25,365) |
12.58 | 12.25 | 0.33 (0.01 to 0.71) |
36,352 | 66 | 88 | 94 |
| Best case for lifetime | 285,909 | 274,146 | 11,763 (−5,386 to 29,232) |
12.82 | 12.40 | 0.43 (0.04 to 0.84) |
27,617 | 79 | 93 | 96 |
Shown are the results of probabilistic analyses running the model 1000 times with the use of randomly selected values for input measurements from predefined distributions. The uncertainty intervals (UIs) show the 2.5 to 97.5 percentiles for the incremental differences in costs and quality-adjusted life-years (QALYs). The uncertainty of the incremental cost-effectiveness ratio (ICER), which was calculated as the cost per QALY gained, is shown by the probability that intensive control is cost-effective at the specified willingness-to-pay thresholds. Costs are direct medical costs. The four post-trial scenarios for medication adherence and treatment effects are as follows: base case (reduced adherence and treatment effects after 5 years until nonadherence and no treatment effects at 15 years), worst case (nonadherence and no treatment effects after 5 years), best case until 15 years (in-trial adherence and persistence of treatment effects for 15 years), and lifetime best case (lifetime in-trial adherence and treatment effects).
Figure 3. Probability of Cost-Effectiveness of Intensive versus Standard Blood-Pressure Control.

Shown is the probability of the cost-effectiveness of intensive control of systolic blood pressure, as compared with standard control, according to a range of willingness-to-pay thresholds (the cost in dollars per quality-adjusted life-year [QALY]). The curves represent the four post-trial persistence-of-treatment-effect scenarios. The curves were generated from the results of the probabilistic analysis in which the model was run 1000 times with the use of random draws for all model measurements to capture joint uncertainty in the model results.
All post-trial persistence-of-treatment-effect scenarios had similar incremental cost-effectiveness ratios (ICERs) at the end of the in-trial period. The cost-effectiveness of intensive control was maximized at approximately 20 years in the lifetime best-case scenario and at 10 years in the other persistence-of-treatment-effect scenarios (Fig. S10 in the Supplementary Appendix). The estimate of the cost-effectiveness of intensive control was similar to the overall estimate in most subgroups that were examined. The exceptions were seen in patients who were 75 years of age or older, who had a more favorable ICER ($26,000 per QALY gained); and in women and patients with previous cardiovascular disease, who had less favorable ICERs ($77,000 and $72,000 per QALY gained, respectively) (Table S9 in the Supplementary Appendix).
ONE-WAY SENSITIVITY AND SCENARIO ANALYSES
The uncertainty ranges of individual variables had a small-to-moderate effect on cost-effectiveness (ICER range, $31,000 to $69,000 per QALY) (Fig. S11 in the Supplementary Appendix). The model was most sensitive to the hazard ratio for cardiovascular disease events with intensive control, the risk of cardiovascular disease events with standard control, the risk of end-stage renal disease after chronic kidney disease, the hazard ratio for death from causes other than cardiovascular disease with intensive control during the first 5 years, and the risk of chronic kidney disease with standard control. Each of these factors potentially increased the ICER above $50,000 per QALY (Fig. S11 in the Supplementary Appendix). Values that were associated with renal outcomes accounted for 4 of the 10 inputs to which the results were most sensitive. Variation in other values had little effect and resulted in ICERs that differed from the base-case ICER by less than $10,000 per QALY. There was a small-to-moderate difference between the results of 36 separate scenario analyses and the base-case estimate (ICERs of $37,000 to $76,000 per QALY). Conservative values for “real world” medication adherence resulted in ICERs ranging from $38,000 to $50,000 per QALY. When the base-case model was populated with a cohort representing the characteristics of SPRINT-eligible U.S. adults in the general population, the ICER was $46,000 per QALY (Table S10 in the Supplementary Appendix).
DISCUSSION
We found that intensive systolic blood-pressure control among adults at high risk for cardiovascular disease was cost-effective and below common U.S. willingness-to-pay thresholds in most simulations (51 to 79% below $50,000 per QALY29,30 and 76 to 93% below $100,000 per QALY), regardless of whether the benefits were reduced after 5 years or persisted for the remaining lifetime of the patient. Intensive control entailed more frequent office visits, laboratory tests, and greater medication use than did standard control, and such factors were costly early on. However, these costs were balanced by health gains from prevented cardiovascular disease events and deaths. The predicted cost-effectiveness was maximized after approximately 10 to 20 years of treatment. Since our analysis time horizon extended beyond the SPRINT observation period to evaluate the potential value of lifetime intensive control, we accounted for a plausible range of possible treatment effects during the post-trial period, medication adherence, and risks of serious adverse events in the assessment of cost-effectiveness.
In two previous cost-effectiveness analyses, the investigators projected that intensive control of blood pressure would be cost-effective among U.S. adults at high risk for cardiovascular disease.31,32 Moise and colleagues estimated more favorable ICERs for intensive control than for standard control among U.S. adults at high cardiovascular risk, but they did not define a high risk of cardiovascular disease strictly according to SPRINT eligibility criteria; in addition, they simulated only a 10-year time horizon and did not account for the costs of treating noncardiovascular diseases in their cost-effectiveness calculations.31 Richman et al. used a lifetime horizon, with their main cost-effectiveness estimate of approximately $24,000 per QALY gained, which was presumably based on lifetime persistence of the benefits of intensive control as defined in SPRINT.32 Our base case assumed a reduction in treatment effects over time on the basis of standard practice for cost-effectiveness analysis of clinical trials. If we assume similar conditions to those in the analysis by Richman et al. (apart from allowing for repeated cardiovascular disease events), our model showed an ICER of approximately $37,000 per QALY gained. As opposed to the Richman et al. approach, in which the participants reverted to the standard-control group after a first cardiovascular disease event, we kept participants in their assigned treatment group after a first event, a method that was consistent with the SPRINT intention-to-treat design. When Richman et al. restricted the benefits that were reported in SPRINT to the median follow-up period in SPRINT (3.3 years), intensive control resulted in an ICER of approximately $35,000, a finding that was consistent with our results when we restricted benefits to 5 years (with an ICER of approximately $41,000 per QALY gained) (Fig. S10 in the Supplementary Appendix).
Approximately 17 million U.S. adults meet SPRINT eligibility criteria and stand to benefit from intensive control of systolic blood pressure.26,33 Recent hypertension guidelines from Canada and Australia incorporated evidence from SPRINT and recommended the consideration of intensive control in selected patients who are at high risk for cardiovascular disease, with close follow-up for serious adverse events.34,35 An ACC–AHA statement recommended that clinical-practice guidelines integrate cost-effectiveness assessments such as ours.29 Our study contributes to the formulation of hypertension guidelines by showing the potential lifetime benefits and cost-effectiveness of intensive control of systolic blood pressure incremental to standard control among high-risk patients. Our results suggest that the maximized cost-effectiveness of intensive control depends on extending treatment beyond 5 years. Research is needed on ways to implement and sustain protocols for intensive control for patients who are most likely to benefit.
This analysis was based on effectiveness, the risk of serious adverse events, medication adherence, and quality-of-life data gathered in SPRINT and adhered to standards for cost-effectiveness analyses (Tables S11 and S12 in the Supplementary Appendix).36,37 There were several limitations. Our simulations represent a range of hypothetical treatment effects projected beyond the SPRINT trial period, since long-term data on treatment effects of intensive control versus standard control beyond the end of the trial are not available. Methods of blood-pressure measurement in most current clinical practices differ from the automated blood-pressure approach used in SPRINT. This issue did not come into play in our analysis, since the effects of intensive control were modeled as relative risks of outcomes and not as changes in systolic blood pressure. The benefits that were observed in SPRINT are consistent with aggregate evidence supporting benefits of intensive control among patients at high risk for cardiovascular disease.38–40 However, because SPRINT excluded patients with a history of diabetes, stroke, or heart failure, our results should be extended only with caution to such patients.2,3
Although there was no significant difference in the rate of combined serious adverse events between the intensive-control group and the standard-control group in SPRINT, we conservatively modeled the risk of specific outcomes that were classified as serious adverse events or as resulting in an emergency department visit. Nonetheless, the risks of serious adverse events that were observed in SPRINT may not represent such risks that would be expected if patients who are treated in the community underwent intensive control. We estimated that the underlying risks of serious adverse events in the two study groups would need to be 2.75 times the risks observed in SPRINT or that the risks of serious adverse events in the intensive-control group would need to be 1.64 times the risk in the standard-control group to push the ICER for intensive control above $50,000 per QALY (Figs. S12 and S13 in the Supplementary Appendix). When we assumed that there was no between-group difference in the risk of combined serious adverse events (i.e., the overall result in SPRINT), the ICER was even lower ($34,000 per QALY for the base case) (Fig. S13 in the Supplementary Appendix).
In conclusion, in this simulation study, we found that intensive control of systolic blood pressure prevented cardiovascular disease events and prolonged life and did so at a cost that was below common willingness-to-pay thresholds, regardless of whether the benefits were reduced after 5 years or persisted for the remaining lifetime of the patient.
Supplementary Material
Acknowledgments
The views expressed in this article are those of the authors and do not necessarily represent the official views of the National Institutes of Health, the Department of Veterans Affairs, or the U.S. government.
Supported by grants (1K01HL133468-01, to Dr. Bress; and R01 HL130500-01A1, to Drs. Moran and Bellows) from the National Heart, Lung, and Blood Institute and a grant (U54-GM10494, to Drs. Weintraub and Zhang) from the National Institute of General Medical Sciences. SPRINT is funded by the National Heart, Lung, and Blood Institute, the National Institute of Diabetes and Digestive and Kidney Diseases, the National Institute on Aging, and the National Institute of Neurological Disorders and Stroke (contract numbers HHSN268200900040C, HHSN268200900046C, HHSN268200900047C, HHSN268200900048C, and HHSN268200 900049C, and Interagency Agreement Number A-HL-13-002-001), through the Department of Veterans Affairs, and through Clinical and Translational Science Awards Programs funded by the National Center for Advancing Translational Sciences.
We thank Dr. Marisa Schauerhamer for assisting in the literature search and review and Drs. Paul Muntner and Rikki Tanner for assisting with the National Health and Nutrition Examination Survey analyses, which are provided in Table S5 in the Supplementary Appendix.
APPENDIX
The authors’ full names and academic degrees are as follows: Adam P. Bress, Pharm.D., Brandon K. Bellows, Pharm.D., Jordan B. King, Pharm.D., Rachel Hess, M.D., Srinivasan Beddhu, M.D., Zugui Zhang, Ph.D., Dan R. Berlowitz, M.D., Molly B. Conroy, M.D., M.P.H., Larry Fine, M.D., Suzanne Oparil, M.D., Donald E. Morisky, Sc.D., Lewis E. Kazis, Sc.D., Natalia Ruiz-Negrón, Pharm.D., Jamie Powell, M.D., Leonardo Tamariz, M.D., M.P.H., Jeff Whittle, M.D., M.P.H., Jackson T. Wright, Jr., M.D., Ph.D., Mark A. Supiano, M.D., Alfred K. Cheung, M.D., William S. Weintraub, M.D., and Andrew E. Moran, M.D., M.P.H.
The authors’ affiliations are as follows: the Departments of Population Health Sciences (A.P.B., R.H., M.B.C.) and Pharmacotherapy (B.K.B., N.R.-N.) and the Divisions of General Internal Medicine (R.H., M.B.C.), Nephrology and Hypertension (S.B., A.K.C.), and Geriatrics (M.A.S.), Department of Internal Medicine, University of Utah School of Medicine, Medical Service, Veterans Affairs (VA) Salt Lake City Healthcare System (S.B., A.K.C.), and VA Salt Lake City Geriatric Research, Education and Clinical Center (M.A.S.), Salt Lake City, and SelectHealth, Murray (B.K.B., N.R.-N.) — all in Utah; Pharmacy Department, Kaiser Permanente Colorado, Aurora (J.B.K.); Christiana Care Health System, Newark, DE (Z.Z., W.S.W.); Center for Healthcare Organization and Implementation Research, Bedford VA Medical Center, Bedford, and the Department of Health Law, Policy, and Management, Boston University School of Public Health (D.R.B.), and the Department of Health Law, Policy and Management, Center for the Assessment of Pharmaceutical Practices, Boston University School of Public Health, Boston (L.E.K.) — all in Massachusetts; Clinical Applications and Prevention Branch, Division of Cardiovascular Sciences, National Heart, Lung, and Blood Institute, Bethesda, MD (L.F.); Vascular Biology and Hypertension Program, Division of Cardiovascular Disease, University of Alabama at Birmingham, Birmingham (S.O.); Fielding School of Public Health, Department of Community Health Sciences, University of California, Los Angeles, Los Angeles (D.E.M.); the Division of General Internal Medicine, Brody School of Medicine, East Carolina University, Greenville, NC (J.P.); the Division of Population Health and Computational Medicine, University of Miami and Geriatric Research, Education and Clinical Center, Miami VA, Miami (L.T.); Clement J. Zablocki VA Medical Center, Milwaukee, and the Department of Medicine, Medical College of Wisconsin, Wauwatosa (J.W.) — both in Wisconsin; the Division of Nephrology and Hypertension, University Hospitals Case Medical Center, Case Western Reserve University, Cleveland (J.T.W.); and the Division of General Medicine, Department of Medicine, Columbia University Medical Center, New York (A.E.M.).
Footnotes
References
- 1.Moran AE, Odden MC, Thanataveerat A, et al. Cost-effectiveness of hypertension therapy according to 2014 guidelines. N Engl J Med. 2015;372:447–55. doi: 10.1056/NEJMsa1406751. [DOI] [PMC free article] [PubMed] [Google Scholar]
- 2.The ACCORD Study Group. Effects of intensive blood-pressure control in type 2 diabetes mellitus. N Engl J Med. 2010;362:1575–85. doi: 10.1056/NEJMoa1001286. [DOI] [PMC free article] [PubMed] [Google Scholar]
- 3.Benavente OR, Coffey CS, Conwit R, et al. Blood-pressure targets in patients with recent lacunar stroke: the SPS3 randomised trial. Lancet. 2013;382:507–15. doi: 10.1016/S0140-6736(13)60852-1. [DOI] [PMC free article] [PubMed] [Google Scholar]
- 4.James PA, Oparil S, Carter BL, et al. 2014 Evidence-based guideline for the management of high blood pressure in adults: report from the panel members appointed to the Eighth Joint National Committee (JNC 8) JAMA. 2014;311:507–20. doi: 10.1001/jama.2013.284427. [DOI] [PubMed] [Google Scholar]
- 5.Ambrosius WT, Sink KM, Foy CG, et al. The design and rationale of a multi-center clinical trial comparing two strategies for control of systolic blood pressure: the Systolic Blood Pressure Intervention Trial (SPRINT) Clin Trials. 2014;11:532–46. doi: 10.1177/1740774514537404. [DOI] [PMC free article] [PubMed] [Google Scholar]
- 6.The SPRINT Research Group. A randomized trial of intensive versus standard blood-pressure control. N Engl J Med. 2015;373:2103–16. doi: 10.1056/NEJMoa1511939. [DOI] [PMC free article] [PubMed] [Google Scholar]
- 7.Goff DC, Jr, Lloyd-Jones DM, Bennett G, et al. ACC/AHA guideline on the assessment of cardiovascular risk: a report of the American College of Cardiology/American Heart Association Task Force on Practice Guidelines. Circulation. 2013;2014;129(Suppl 2):S49–S73. doi: 10.1161/01.cir.0000437741.48606.98. [DOI] [PubMed] [Google Scholar]
- 8.Arias E, Heron M, Tejada-Vera B. United States life tables eliminating certain causes of death, 1999-2001. Natl Vital Stat Rep. 2013;61:1–128. [PubMed] [Google Scholar]
- 9.Identification and care of patients with CKD. (United States Renal Data System).2015 Annual Data Report, vol 1 Chronic kidney disease in the United States. 2015 https://www.usrds.org/2015/view/v1_02.aspx.
- 10.Iskedjian M, Einarson TR, MacKeigan LD, et al. Relationship between daily dose frequency and adherence to antihypertensive pharmacotherapy: evidence from a meta-analysis. Clin Ther. 2002;24:302–16. doi: 10.1016/s0149-2918(02)85026-3. [DOI] [PubMed] [Google Scholar]
- 11.Jones DE, Carson KA, Bleich SN, Cooper LA. Patient trust in physicians and adoption of lifestyle behaviors to control high blood pressure. Patient Educ Couns. 2012;89:57–62. doi: 10.1016/j.pec.2012.06.003. [DOI] [PMC free article] [PubMed] [Google Scholar]
- 12.Xu KT, Ragain RM. Effects of weight status on the recommendations of and adherence to lifestyle modifications among hypertensive adults. J Hum Hypertens. 2005;19:365–71. doi: 10.1038/sj.jhh.1001828. [DOI] [PubMed] [Google Scholar]
- 13.Red Book Online. 2016 http://www.micromedex.com.
- 14.Centers for Medicare & Medicaid Services. Physician fees schedule. 2016 http://www.cms.gov/apps/physician-fee-schedule/overview.aspx.
- 15.Centers for Medicare & Medicaid Services. Lab fee schedule. 2016 https://www.cms.gov/Medicare/Medicare-Fee-for-Service-Payment/ClinicalLabFeeSched/Clinical-Laboratory-Fee-Schedule-Files.html.
- 16.Healthcare Cost and Utilization Project (HCUP) Statistics on hospital stays. 2013 https://www.hcup-us.ahrq.gov/
- 17.Centers for Disease Control and Prevention. Chronic disease cost calculator, version 2. 2013 http://www.cdc.gov/chronicdisease/calculator.
- 18.Trogdon JG, Murphy LB, Khavjou OA, et al. Costs of chronic diseases at the state level: the chronic disease cost calculator. Prev Chronic Dis. 2015;12:E140. doi: 10.5888/pcd12.150131. [DOI] [PMC free article] [PubMed] [Google Scholar]
- 19.Bureau of Economic Analysis. Price indexes for personal consumption expenditures by type of product. http://www.bea.gov/iTable/iTable.cfm?ReqID=12&step=1&acrdn=2#reqid=12&step=3&isuri=1&1203=16.
- 20.Sullivan PW, Ghushchyan V. Preference-based EQ-5D index scores for chronic conditions in the United States. Med Decis Making. 2006;26:410–20. doi: 10.1177/0272989X06290495. [DOI] [PMC free article] [PubMed] [Google Scholar]
- 21.King JB, Shah RU, Bress AP, Nelson RE, Bellows BK. Cost-effectiveness of sacubitril-valsartan combination therapy compared with enalapril for the treatment of heart failure with reduced ejection fraction. JACC Heart Fail. 2016;4:392–402. doi: 10.1016/j.jchf.2016.02.007. [DOI] [PubMed] [Google Scholar]
- 22.Yao G, Freemantle N, Flather M, Tharmanathan P, Coats A, Poole-Wilson PA. Long-term cost-effectiveness analysis of nebivolol compared with standard care in elderly patients with heart failure: an individual patient-based simulation model. Pharmacoeconomics. 2008;26:879–89. doi: 10.2165/00019053-200826100-00007. [DOI] [PubMed] [Google Scholar]
- 23.Lloyd-Jones DM, Leip EP, Larson MG, et al. Prediction of lifetime risk for cardiovascular disease by risk factor burden at 50 years of age. Circulation. 2006;113:791–8. doi: 10.1161/CIRCULATIONAHA.105.548206. [DOI] [PubMed] [Google Scholar]
- 24.Haley WE, Gilbert ON, Riley RF, et al. The association between Self-Reported Medication Adherence scores and systolic blood pressure control: a SPRINT baseline data study. J Am Soc Hypertens. 2016;10(11):857–864.e2. doi: 10.1016/j.jash.2016.08.009. [DOI] [PMC free article] [PubMed] [Google Scholar]
- 25.Morisky DE, Ang A, Krousel-Wood M, Ward HJ. Predictive validity of a medication adherence measure in an outpatient setting. J Clin Hypertens (Greenwich) 2008;10:348–54. doi: 10.1111/j.1751-7176.2008.07572.x. [DOI] [PMC free article] [PubMed] [Google Scholar] [Retracted]
- 26.Bress AP, Tanner RM, Hess R, Colantonio LD, Shimbo D, Muntner P. Generalizability of SPRINT results to the U.S. adult population. J Am Coll Cardiol. 2016;67:463–72. doi: 10.1016/j.jacc.2015.10.037. [DOI] [PMC free article] [PubMed] [Google Scholar]
- 27.D’Agostino RB, Russell MW, Huse DM, et al. Primary and subsequent coronary risk appraisal: new results from the Framingham study. Am Heart J. 2000;139:272–81. doi: 10.1067/mhj.2000.96469. [DOI] [PubMed] [Google Scholar]
- 28.Cook NR, Ridker PM. Calibration of the pooled cohort equations for atherosclerotic cardiovascular disease: an update. Ann Intern Med. 2016;165:786–94. doi: 10.7326/M16-1739. [DOI] [PubMed] [Google Scholar]
- 29.Anderson JL, Heidenreich PA, Barnett PG, et al. ACC/AHA statement on cost/value methodology in clinical practice guidelines and performance measures: a report of the American College of Cardiology/American Heart Association Task Force on Performance Measures and Task Force on Practice Guidelines. J Am Coll Cardiol. 2014;63:2304–22. doi: 10.1016/j.jacc.2014.03.016. [DOI] [PubMed] [Google Scholar]
- 30.Neumann PJ, Cohen JT, Weinstein MC. Updating cost-effectiveness — the curious resilience of the $50,000-per-QALY threshold. N Engl J Med. 2014;371:796–7. doi: 10.1056/NEJMp1405158. [DOI] [PubMed] [Google Scholar]
- 31.Moise N, Huang C, Rodgers A, et al. Comparative cost-effectiveness of conservative or intensive blood pressure treatment guidelines in adults aged 35-74 years: the Cardiovascular Disease Policy model. Hypertension. 2016;68:88–96. doi: 10.1161/HYPERTENSIONAHA.115.06814. [DOI] [PMC free article] [PubMed] [Google Scholar]
- 32.Richman IB, Fairley M, Jørgensen ME, Schuler A, Owens DK, Goldhaber-Fiebert JD. Cost-effectiveness of intensive blood pressure management. JAMA Cardiol. 2016;1:872–9. doi: 10.1001/jamacardio.2016.3517. [DOI] [PMC free article] [PubMed] [Google Scholar]
- 33.Bress AP, Kramer H, Khatib R, et al. Potential deaths averted and serious adverse events incurred from adoption of the SPRINT (Systolic Blood Pressure Intervention Trial) intensive blood pressure regimen in the United States: projections from NHANES (National Health and Nutrition Examination Survey) Circulation. 2017;135:1617–28. doi: 10.1161/CIRCULATIONAHA.116.025322. [DOI] [PMC free article] [PubMed] [Google Scholar]
- 34.Leung AA, Nerenberg K, Daskalopoulou SS, et al. Hypertension Canada’s 2016 Canadian Hypertension Education Program guidelines for blood pressure measurement, diagnosis, assessment of risk, prevention, and treatment of hypertension. Can J Cardiol. 2016;32:569–88. doi: 10.1016/j.cjca.2016.02.066. [DOI] [PubMed] [Google Scholar]
- 35.Gabb GM, Mangoni AA, Anderson CS, et al. Guideline for the diagnosis and management of hypertension in adults — 2016. Med J Aust. 2016;205:85–9. doi: 10.5694/mja16.00526. [DOI] [PubMed] [Google Scholar]
- 36.Husereau D, Drummond M, Petrou S, et al. Consolidated Health Economic Evaluation Reporting Standards (CHEERS) statement. Value Health. 2013;16:e1–e5. doi: 10.1016/j.jval.2013.02.010. [DOI] [PubMed] [Google Scholar]
- 37.Sanders GD, Neumann PJ, Basu A, et al. Recommendations for conduct, methodological practices, and reporting of cost-effectiveness analyses: Second Panel on Cost-Effectiveness in Health and Medicine. JAMA. 2016;316:1093–103. doi: 10.1001/jama.2016.12195. [DOI] [PubMed] [Google Scholar]
- 38.Ettehad D, Emdin CA, Kiran A, et al. Blood pressure lowering for prevention of cardiovascular disease and death: a systematic review and meta-analysis. Lancet. 2016;387:957–67. doi: 10.1016/S0140-6736(15)01225-8. [DOI] [PubMed] [Google Scholar]
- 39.Xie X, Atkins E, Lv J, et al. Effects of intensive blood pressure lowering on cardiovascular and renal outcomes: updated systematic review and meta-analysis. Lancet. 2016;387:435–43. doi: 10.1016/S0140-6736(15)00805-3. [DOI] [PubMed] [Google Scholar]
- 40.Bundy JD, Li C, Stuchlik P, et al. Systolic blood pressure reduction and risk of cardiovascular disease and mortality: a systematic review and network meta-analysis. JAMA Cardiol. 2017;2:775–81. doi: 10.1001/jamacardio.2017.1421. [DOI] [PMC free article] [PubMed] [Google Scholar]
Associated Data
This section collects any data citations, data availability statements, or supplementary materials included in this article.