

Abstract
Background
Patients with chronic kidney disease (CKD) experience high rates of atherosclerotic cardiovascular disease and death that are not fully explained by traditional risk factors. In animal studies, defective cellular cholesterol efflux pathways which are mediated by the ATP binding cassette transporters ABCA1 and ABCG1 are associated with accelerated atherosclerosis. We hypothesized that cholesterol efflux in humans would vary in terms of cellular components, with potential implications for cardiovascular disease.
Methods
We recruited 120 CKD patients (eGFR<30 mL/min/1.73m2) and 120 control subjects (eGFR ≥60 mL/min/1.73m2) in order to measure cholesterol efflux using either patients' HDL and THP-1 macrophages or patients' monocytes and a flow cytometry based cholesterol efflux assay. We also measured cell-surface levels of the common β subunit of the IL-3/GM-CSF receptor (IL-3Rβ) which has been linked to defective cholesterol homeostasis and may promote monocytosis. In addition, we measured plasma inflammatory cytokines and plasma metabolite profiles.
Results
There was a strong positive correlation between cell-surface IL-3Rβ levels and monocyte counts in CKD (P<0.001). ABCA1 mRNA was reduced in CKD vs. control monocytes (P<0.05), across various etiologies of CKD. Cholesterol efflux to apolipoprotein A1 was impaired in monocytes from CKD patients with diabetic nephropathy (P<0.05), but we found no evidence for a circulating HDL-mediated defect in cholesterol efflux in CKD. Profiling of plasma metabolites showed that medium-chain acylcarnitines were both independently associated with lower levels of cholesterol transporter mRNA in CKD monocytes at baseline (P<0.05), and with cardiovascular events in CKD patients after median 2.6 years of follow-up.
Conclusions
Cholesterol efflux in humans varies in terms of cellular components. We report a cellular defect in ABCA1-mediated cholesterol efflux in monocytes from CKD patients with diabetic nephropathy. Unlike several traditional risk factors for atherosclerotic cardiovascular disease, plasma metabolites inversely associated with endogenous cholesterol transporters predicted cardiovascular events in CKD patients. (Funded by the National Institute of Diabetes and Digestive and Kidney Diseases and others.)
Keywords: atherosclerosis, immunology, kidney, metabolomics, risk factors
1. Introduction
Plasma high density lipoprotein cholesterol (HDL-C) levels have an independent inverse relationship with atherosclerotic cardiovascular disease;1 however, several recent therapeutic interventions aimed at raising HDL-C levels have failed in clinical trials,2,3 highlighting an incomplete understanding of the relationship between HDL and atherosclerosis. Recent studies have indicated that the ability of HDL to mediate cholesterol efflux from macrophages is a better predictor of atherosclerotic plaque burden4 and future atherosclerotic cardiovascular disease events5 than HDL-C levels,4,5 and defects in HDL function have been described in a variety of settings.6,7 Although the assessment of cholesterol efflux capacity used in these earlier studies4,5 reflects the ability to mobilize free cholesterol from macrophages, it does not capture variation in cholesterol efflux in terms of cellular components such as endogenous cholesterol transporters.4 Given their relationship to atherosclerosis in animal models,8 an investigation of cellular defects in cholesterol efflux warrants study in humans.
Two ATP-binding cassette transporters, ABCA1 and ABCG1, play key roles in promoting efflux of cellular cholesterol to apolipoprotein A1 (apoA1)9 and HDL10 and are highly expressed in cholesterol loaded macrophages and monocytes.11,12 ABCA1 is mutated in patients with Tangier Disease, who accumulate macrophage foam cells in tissues.13 In animal studies, defective cellular cholesterol efflux pathways are associated with accelerated atherosclerosis.8 Increased cell-surface levels of the common β subunit of the IL-3/GM-CSF receptor (IL-3Rβ or CD131) which can be detected by flow cytometry on the surface of monocytes appears to be a signature of defective cholesterol homeostasis and myeloid proliferation in animals lacking ABCA1 and ABCG1.8
Patients with chronic kidney disease (CKD) experience high rates of atherosclerotic cardiovascular disease and death14,15 that are not fully explained by traditional risk factors.15 We recently discovered that mild levels of renal dysfunction are accompanied by reduced levels of HDL-C and higher levels of circulating monocytes.16 Moreover, studies in animal models8 have shown that cellular defects in cholesterol efflux can promote atherosclerosis independent of HDL changes.
This study was designed to investigate new mechanisms of accelerated atherosclerosis in patients with CKD. We hypothesized that monocyte counts would be positively correlated with cell-surface IL-3Rβ in CKD patients, due either to a defect in HDL or in monocytes due to decreased levels of ABCA1 or ABCG1. A secondary hypothesis was that monocytes from CKD patients would have a cellular defect in cholesterol efflux compared to controls using a flow cytometry based cholesterol efflux assay. In exploratory analyses we also measured plasma inflammatory cytokines and carried out metabolite profiling.
2. Methods
2.1 Study Population
The research protocol was approved by the Institutional Review Board (IRB) of Columbia University Medical Center (CUMC) in New York. All study participants provided written informed consent. CKD patients were recruited from outpatient Nephrology clinics and Control subjects from the Associates in Internal Medicine clinic at CUMC. We used the abbreviated Modification of Diet in Renal Disease (MDRD) equation17 to calculate the estimated GFR (eGFR). CKD patient inclusion criteria were age ≥ 18 years, K/DOQI CKD Stage 4-518 (eGFR<30 mL/min/1.73m2, not on dialysis). Control subject inclusion criteria were age ≥ 18 years, eGFR ≥60 mL/min/1.73m2.14 Patient and control exclusion criteria are given in the sub-text of Table 1. Subjects were asked to come for a research visit on a scheduled morning following a 12-hour fast for blood collection. 60 subjects (the first 30 CKD patients and 30 controls) comprised the Monocyte Cohort, in which the main goal was to use flow cytometry to cross-sectionally measure monocyte counts and cell-surface levels of the IL-3Rβ. Additional subjects were recruited for cellular cholesterol efflux assays and ABCA1 mRNA measurements in human monocyte subsets and for metabolite profiling. 120 subjects (the first 60 CKD patients and 60 controls) comprised the Metabolite Cohort, in which plasma was separated for cross-sectional comparison of 89 circulating metabolites. 240 total subjects (120 CKD patients and 120 controls) comprised the Entire Cohort. Additional details are provided in the Supplementary Appendix, available online with the full text of this article. A detailed description of subject cohorts is provided in Table S1 (controls) and Table S2 (CKD patients) in order to indicate the contents of each cohort and the assays performed. Subjects were studied on consecutive days during recruitment periods, at an average of 4-5 subjects (CKD patients and controls) per day.
Table 1. Baseline Characteristics of Study Participants*†.
| Entire Cohort | |||
|---|---|---|---|
| Control N=120 | CKD N=120 | P-value | |
| Spanish consent –no. (%) | 101 (84) | 82 (68) | 0.004 |
| Hispanic –no. (%)** | 110 (91.7) | 86 (71.7) | <0.001 |
| Black –no. (%) | 7 (5.8) | 20 (16.7) | 0.008 |
| White –no. (%) | 2 (1.7) | 12 (10.0) | 0.006 |
| Asian –no. (%) | 1 (0.8) | 2 (1.7) | 1.00 |
| CKD Demographics –no. (%) ‡ | |||
| Diabetic nephropathy | 62 (52) | ||
| Hypertensive nephrosclerosis | 30 (25) | ||
| Other etiologies | 28 (23) | ||
| K/DOQI Stage 4 | 94 (78) | ||
| K/DOQI Stage 5 | 26 (22) | ||
| No proteinuria | 5 (4) | ||
| Microalbuminuria | 37 (31) | ||
| Macroalbuminuria | 78 (65) | ||
| Clinical Variable | |||
| eGFR –ml/min/1.73m2 | 82.3 ± 14.3 | 19.5 ± 5.8 | <0.001 |
| Age –yr | 61.9 ± 11.0 | 67.4 ± 13.0 | <0.001 |
| Female sex –no. (%) | 74 (62) | 70 (58) | 0.60 |
| Diabetes –no. (%) | 37 (31) | 75 (63) | <0.001 |
| Systolic BP –mmHg | 126.0 ± 11.6 | 136.4 ± 12.4 | <0.001 |
| Plasma Biochemistry | |||
| HDL-C –mg/dL | 52.3 ± 17.5 | 49.1 ± 20.3 | 0.04 |
| LDL-C –mg/dL | 110.5 ± 36.2 | 92.1 ± 37.2 | <0.001 |
| Triglycerides –mg/dL | 124.7 ± 62.6 | 142.8 ± 65.1 | 0.01 |
| Total Cholesterol –mg/dL | 187.7 ± 43.7 | 169.6 ± 47.3 | 0.003 |
| Apo A1 –mg/dL | 155.2 ± 34.0 | 145.4 ± 38.7 | 0.02 |
| Apo C3 –mg/dL | 13.0 ± 4.7 | 17.2 ± 6.2 | <0.001 |
| Apo B –mg/dL | 94.6 ± 28.7 | 84.6 ± 28.6 | 0.005 |
| TNF-alpha –pg/mL § | 2.0 ± 1.4 | 4.2 ± 2.2 | <0.001 |
| M-CSF –pg/mL § | 384.8 ± 145.1 | 1410.9 ± 483.4 | <0.001 |
| suPAR –pg/mL § | 2402.4 ± 649.5 | 4559.8 ± 1060.7 | <0.001 |
| Total WBC –109 cells/L § | 6.1 ± 1.9 | 6.6 ± 1.9 | 0.43 |
| Antihypertensive Therapy –no. (%) | |||
| ACE-inhibitor/ARB | 54 (45) | 53 (44) | 0.90 |
| Beta blocker | 19 (16) | 84 (70) | <0.001 |
| Thiazide diuretic | 39 (33) | 36 (30) | 0.68 |
| Loop diuretic | 1 (1) | 75 (63) | <0.001 |
| Potassium sparing diuretic | 2 (2) | 5 (4) | 0.45 |
| Isosorbide | 0 (0) | 16 (13) | <0.001 |
| Hydralazine | 0 (0) | 10 (8) | 0.001 |
| Dihydropyridine CCB | 25 (21) | 74 (62) | <0.001 |
| Non-dihydropyridine CCB | 3 (3) | 5 (4) | 0.72 |
| Alpha-2 adrenergic agonist | 0 (0) | 9 (8) | 0.003 |
| Alpha-1 adrenergic antagonist | 1 (1) | 3 (3) | 0.62 |
| LDL-C Lowering Therapy –no. (%) | |||
| Statin | 59 (49) | 99 (83) | <0.001 |
| Ezetemibe | 0 (0) | 8 (7) | 0.01 |
CKD patient and control exclusion criteria were acute cardiovascular event, revascularization, or congestive heart failure exacerbation in the last 6 months, hemoglobin A1c>10%, blood pressure >160/90 averaged over the last 3 clinic visits, total bilirubin >2 mg/dL and/or liver enzymes (AST or ALT) greater than 3 fold the upper limit of normal, nephrotic range proteinuria >3500 mg/g creatinine measured by either random urine protein to creatinine ratio or urine albumin to creatinine ratio, hemoglobin <9 g/dL, cancer in the last 5 years, HIV or Hepatitis positive status, current smoking, drug and/or alcohol abuse, treatment with steroids or any other form of immunosuppression, treatment with hormone replacement therapy, treatment with drugs affecting HDL metabolism including fibrates or niacin, and current unstable psychiatric illness.
Plus-minus values are means ± SD. P values were calculated by Fisher's exact test/chi-square test for categorical variables, Student's t-test or Wilcoxon-Mann Whitney test for continuous variables. eGFR denotes estimated glomerular filtration rate; HDL-C, high density lipoprotein cholesterol; LDL-C, low density lipoprotein cholesterol; Apo A1, apolipoprotein A1; Apo C3, apolipoprotein C3; Apo B, apolipoprotein B; TNF-alpha, tumor necrosis factor alpha; M-CSF, macrophage colony stimulating factor; suPAR, soluble urokinase-type plasminogen activator receptor; Total WBC, total white blood cells/leukocytes; ACE-inhibitor, angiotensin converting enzyme inhibitor; ARB, angiotensin receptor blocker; and CCB, calcium channel blocker.
Race/ethnicity was obtained from chart review (outpatient clinic notes) or self-reported.
Etiology of CKD was obtained from chart review of the primary nephrologist's clinic notes. CKD secondary to other etiologies included polycystic kidney disease, renal dysplasia, congenital solitary kidney, medullary cystic disease, chronic interstitial nephritis (in one case related to lithium toxicity), nephrolithiasis and obstructive uropathy, IgA nephropathy, secondary focal segmental glomerulosclerosis (FSGS), non-resolving acute tubular necrosis, and etiology unknown. CKD secondary to diabetic nephropathy was often additionally attributed to a longstanding history of hypertension and included one patient with a prior episode of obstruction, one patient who also had polycystic kidney disease, one patient who also had a congenital solitary kidney, and one patient also felt to have secondary FSGS. CKD secondary to hypertensive arterionephrosclerosis included four patients with ischemic nephropathy/renal artery stenosis, one patient who also had a history of cyroablation for a renal cell carcinoma more than 5 years prior, and one patient who also had a solitary kidney. K/DOQI Stage 4 CKD was defined as eGFR 15-29 ml/min/1.73m2 and Stage 5 CKD as eGFR <15 ml/min/1.73m2 (not on dialysis). No proteinuria was defined as <30 mg/g creatinine, microalbuminuria as 30-300 mg/g creatinine, and macroalbuminuria as >300 mg/g creatinine. There was no patient with nephrotic range proteinuria (>3500 mg/g creatinine) as per the study design.
TNF-alpha, M-CSF, and suPAR were measured in 30 CKD patients and 30 control subjects. Total leukocytes were measured by complete blood count in 29 CKD patients and 17 control subjects (results shown) and in a replication cohort of 12 CKD patients and 14 control subjects later recruited (6.6±1.2 vs. 6.5±1.8 109 cells/L, P=0.87), for a total of 41 CKD patients and 31 control subjects (6.6±1.7 vs. 6.3±1.9 109 cells/L, P=0.48).
2.2 Flow Cytometry Based Phenotyping of Human Monocyte Subsets
Monocyte subsets were prepared from CKD patients and controls from fresh blood19 (representative Control subject, Figure 1A). Monocytes were quantified as the percentage of single cells (percentage of leukocytes). Cell-surface IL-3Rβ mean fluorescence intensity (MFI), per cell/event, was measured. Additional experimental details are provided in the Supplementary Appendix.
Figure 1. Evidence for a Cellular Defect in ABCA1-Mediated Cholesterol Efflux in Monocytes from CKD Patients with Diabetic Nephropathy.
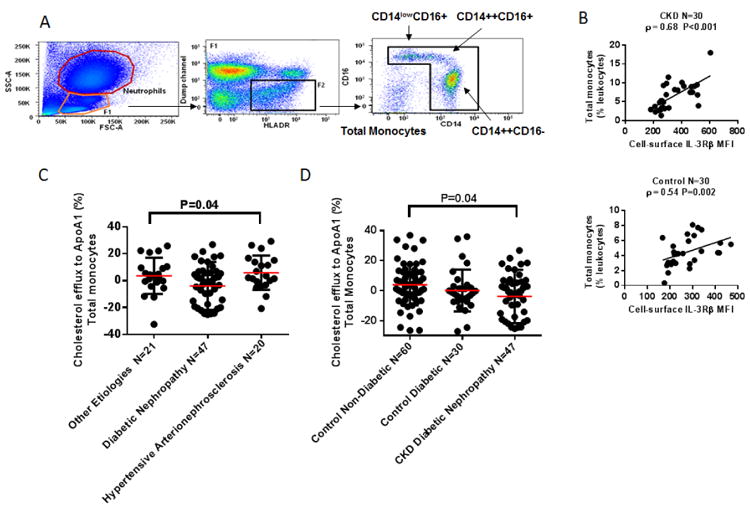
Panel A shows flow cytometry identification of human monocyte subsets. Total monocytes were contained among HLA-DR+ cells that did not express B-cell (CD19-), T-cell (αβTCR-), NK-cell (CD56-), or granulocyte (CD15-) markers (“dump” channel). Within this gate, large CD14++CD16- “classical” and CD14++CD16+ “intermediate” monocytes, small CD14lowCD16+ “non-classical” monocytes, and CD14-CD16- dendritic cells were identified (representative Control subject). Panel B shows the association of cell-surface common β subunit of the IL-3/GM-CSF receptor (IL-3Rβ) mean fluorescence intensity (MFI) levels, per cell/event, with total monocyte counts quantified as the percentage of single cells (percentage of leukocytes) in CKD patients and controls from the Monocyte Cohort, assessed with the use of Spearman's correlation coefficient, rho (ρ). Panels C and D show results of a flow cytometry cholesterol efflux assay using the fluorescent sterol BODIPY-cholesterol. Fresh red blood cells from CKD patients and controls were lysed and leukocytes immediately stained with BODIPY-cholesterol/cyclodextrin. Labeled cells from individual CKD patients and controls were then incubated in separate suspension culture for 2 hours with no acceptors (non-acceptor control) and 5 μg/mL control ApoA1. BODIPY-cholesterol mean fluorescence intensity (MFI) was measured in total monocytes and in each monocyte subset (no acceptor and ApoA1 conditions). In CKD patients and controls, cholesterol efflux was identified by the percent decrease in MFI of the fluorescent sterol BODIPY-cholesterol in cholesterol acceptor (5 μg/mL apoA1)-treated monocytes relative to the non-acceptor control for each subject calculated as (1-BODIPY-cholesterol MFI Acceptor condition/BODIPY-cholesterol MFI No Acceptor condition) × 100. Panel C shows results of this cholesterol efflux assay in 88 CKD patients according to 3 etiology categories of CKD using Analysis of variance (ANOVA) to detect a difference between groups. A single outlier in the diabetic nephropathy group is included in the analysis but is not shown. Panel D shows results of this cholesterol efflux assay in CKD patients with diabetic nephropathy, diabetic controls, and non-diabetic controls using ANOVA. A standard post hoc test indicated that it was the comparison between CKD patients with diabetic nephropathy and non-diabetic control subjects which was significant at the 0.05 level in total monocytes. A single outlier in the diabetic nephropathy group is included in the analysis but is not shown.
2.3 Flow Cytometry Assay to Detect Cellular Cholesterol Efflux in Human Monocyte Subsets
BODIPY-cholesterol is a fluorescent analog of cholesterol which undergoes efflux from macrophages via ABCA1/ABCG1.20 Cholesterol efflux was identified by the percent decrease in MFI of the fluorescent sterol BODIPY-cholesterol in cholesterol acceptor (apoA1)-treated monocytes relative to the non-acceptor control for each subject calculated as (1-BODIPY-cholesterol MFI Acceptor condition/BODIPY-cholesterol MFI No Acceptor condition) × 100. Cholesterol efflux was compared in CKD patients vs. controls. Details of the assay protocol are provided in the Supplementary Appendix. Using the THP-1 human monocyte cell line, we confirmed that cholesterol efflux to apoA1 from human monocytes measured using BODIPY-cholesterol correlated moderately with efflux measured using radiolabeled (3H) cholesterol (Figure S1 of the Supplementary Appendix).
2.4 Metabolite Profiling
Fasting EDTA plasma was frozen at −80°C immediately after collection. Metabolites were profiled with liquid chromatography-tandem mass spectrometry (LC-MS) as previously described16,21,22 in 120 subjects. Details are given in the Supplementary Appendix.
2.5 Clinical Endpoint
We prospectively followed 119 individuals (59 CKD patients and 60 controls) from the day of the research visit (blood draw) for the development of a pre-specified composite cardiovascular endpoint (defined in the Supplementary Appendix) which was independently adjudicated by two Internal Medicine residency-trained MDs on staff at CUMC in October-November, 2015.
2.6 Statistical Analysis
Efflux data are summarized in terms of means and standard deviations. Analysis of variance (ANOVA) was used to detect a difference in BODIPY-cholesterol efflux (%) between groups (according to 3 etiology categories of CKD, and also in CKD patients with diabetic nephropathy, diabetic controls, and non-diabetic controls), followed by a standard post hoc test to determine the significant comparisons. Demographic and clinical variables were compared across quartiles of BODIPY-cholesterol efflux in total, CD14++CD16-, CD14++CD16+, CD14lowCD16+ monocytes from CKD patients with the use of the Jonckheere–Terpstra trend test. Additional details are given in the Supplementary Appendix.
Statistical methods for metabolite analyses are given in the sub-text of Tables 3 and 4. All reported P values in our study are two-tailed. P<0.05 (or P<0.0006 for metabolite comparisons in CKD patients vs. controls, P<0.002 for metabolite predictors of the composite cardiovascular outcome using Bonferroni correction given multiple testing) was considered statistically significant. Analyses were done with SAS 9.1.3 (SAS Institute, Cary, NC) and R 3.0.1 (http://www.r-project.org).
Table 3. Metabolites Independently Associated with Lower Levels of ABCA1 and ABCG1 mRNAs in CD14++CD16-, CD14++CD16+, and CD14lowCD16+ Monocytes from CKD Patients*.
| Outcome Variable | Simple Linear Regression | Multiple linear regression adjusted for age, sex | Multiple linear regression adjusted for age, sex, diabetes, HDL-C |
|
| |||
| Regression Coefficient (SE)** | |||
|
| |||
| ABCA1 mRNA | |||
| CD14++CD16-N=26 | Carnitine | Carnitine | Carnitine |
| -0.33 (0.11)‡ | -0.29 (0.13)† | -0.28 (0.13)† | |
| C4-butyryl-carnitine | C4-butyryl-carnitine | C4-butyryl-carnitine | |
| -0.28 (0.12)† | -0.25 (0.12)† | -0.25 (0.12)† | |
| C9-carnitine | |||
| -0.26 (0.12)† | |||
| CD14++CD16+ N=26 | Citrulline | Citrulline | |
| -0.33 (0.15)† | -0.34 (0.16)† | ||
| CD14lowCD16+ N=25 | C9-carnitine | ||
| -0.37 (0.17)† | |||
| ABCG1 mRNA | |||
| CD14++CD16-N=26 | Carnitine | Carnitine | Citrulline |
| -0.32 (0.10)‡ | -0.33 (0.11)‡ | -0.26 (0.12)† | |
| C9-carnitine | C9-carnitine | Carnitine | |
| -0.26 (0.11)† | -0.31 (0.11)‡ | -0.35 (0.12)‡ | |
| C9-carnitine | |||
| -0.34 (0.11)‡ | |||
| CD14++CD16+ N=22 | Citrulline | Citrulline | Citrulline |
| -0.36 (0.14)† | -0.40 (0.15)† | -0.38 (0.16)† | |
| C8-carnitine | C8-carnitine | C8-carnitine | |
| -0.42 (0.13)‡ | -0.44 (0.15)‡ | -0.43 (0.16)† | |
| C9-carnitine | C9-carnitine | C9-carnitine | |
| -0.34 (0.14)† | -0.36 (0.15)† | -0.43 (0.16)† | |
| C10-carnitine | C10-carnitine | C10-carnitine | |
| -0.44 (0.13)‡ | -0.50 (0.14)‡ | -0.50 (0.15)‡ | |
| CD14lowCD16+ N=25 | Citrulline | ||
| -0.57 (0.25)† | |||
HDL-C denotes high density lipoprotein cholesterol; ABCA1 mRNA, ATP-binding cassette transporter A1 mRNA normalized to cyclophilin A; ABCG1 mRNA, ATP-binding cassette transporter G1 mRNA normalized to cyclophilin A.
All metabolite values were natural logarithmically transformed because of their non-normal distribution and then standardized (to mean=0, SD=1). Regression coefficients represent the standardized change in dependent variable per 1-SD change in the log-transformed metabolite. For example, a 1-SD increment in log carnitine was associated with a -0.28-SD change in log ABCA1 mRNA in CD14++CD16- monocytes from CKD patients. Separate regressions were fitted for each combination of outcome (response) and metabolite (predictor), adjusted for age, sex, and then additionally adjusted for diabetes, HDL-C. Initially, a Bonferroni-corrected P value threshold of 0.0006 (0.05/89) was used to compare 89 metabolites between 60 CKD patients and 60 control subjects (Metabolite Cohort) to account for the number of metabolites analyzed. 34 metabolites were significantly different at P<0.0006: metabolites increased in CKD were creatinine, citrulline, 5-HIAA, dimethylglycine, ADMA/SDMA, allantoin, aminoisobutyric acid, anthranilic acid, kynurenic acid, kynurenine, 5′ adenosylhomocysteine, n-Carbamoyl-β-alanine, choline, trimethylamine-N-oxide, xanthosine, cystamine, cysteamine, carnitine, C2-carnitine, C3-malonyl-carnitine, C4-butyryl-carnitine, C4-methylmalonyl-carnitine, C5-valeryl-carnitine, C5-glutaryl-carnitine, C6-carnitine, C7-carnitine, C8-carnitine, C9-carnitine, C10-carnitine; metabolites decreased in CKD were serine, tyrosine, tryptophan, xanthine, xanthurenate. Values of all 34 of these metabolites (except for cystamine, cysteamine due to incomplete data) from all CKD patients with ABCA1/ABCG1 mRNA measurements were entered into the regression models above, with a significant P value at this stage denoted as below.
P<0.05
P<0.01
Table 4. Metabolites Independently Associated with First Occurrence of a Cardiovascular Event in CKD Patients with Median Follow-up Period 2.6 (IQR 1.9-4.4) Years*.
| No. of CKD Patients with Event 15, Total No. of CKD Patients Followed 59 | ||
|
| ||
| Univariate Cox regression | Cox regression adjusted for age, sex | Cox regression adjusted for age, sex, diabetes, HDL-C |
|
| ||
| Hazard Ratio [95% CI]** | ||
|
| ||
| C9-carnitine | 5′adenosylhomocysteine | 5′adenosylhomocysteine |
| 4.79 [1.72-13.32]‡ | 8.70 [1.55-48.76]† | 7.82 [1.40-43.77]† |
| Age | C7-carnitine | C7-carnitine |
| 1.05 [1.00-1.10] | 5.34 [1.13-25.17]† | 4.94 [1.05-23.19]† |
| Female sex | ||
| 0.85 [0.30-2.40] | C9-carnitine | C9-carnitine |
| Hispanic§ | 5.05 [1.81-14.12]‡ | 5.28 [1.85-15.08]¶ |
| 1.14 [0.32-4.08] | ||
| HDL-C | Xanthosine | |
| 1.01 [0.98-1.03] | 2.06 [1.02-4.18]† | |
| LDL-C | ||
| 1.00 [0.98-1.01] | ||
| Triglycerides | ||
| 1.00 [0.99-1.01] | ||
| Total Cholesterol | ||
| 1.00 [0.99-1.01] | ||
| Systolic BP | ||
| 1.01 [0.97-1.06] | ||
| Diabetes | ||
| 2.30 [0.64-8.19] | ||
| Diabetic nephropathy§ | ||
| 1.93 [0.65-5.76] | ||
| Macroalbuminuria§ | ||
| 0.81 [0.29-2.24] | ||
| Apo A1 | ||
| 1.00 [0.98-1.01] | ||
| Apo C3 | ||
| 1.01 [0.92-1.10] | ||
| Apo B | ||
| 1.00 [0.98-1.02] | ||
HDL-C denotes high density lipoprotein cholesterol; LDL-C, low density lipoprotein cholesterol; Apo A1, apolipoprotein A1; Apo C3, apolipoprotein C3; and Apo B, apolipoprotein B.
All metabolite values were natural logarithmically transformed because of their non-normal distribution and then standardized (to mean=0, SD=1). Cox proportional-hazards models were used to assess the association between baseline plasma metabolites and time to first occurrence of a cardiovascular event defined as myocardial infarction, coronary artery angioplasty/stenting/bypass surgery, stroke with symptoms lasting >24 hours, carotid endarterectomy/stenting, non-traumatic lower extremity amputation, lower limb artery angioplasty/stenting/bypass surgery, hospitalization for unstable angina, hospitalization for heart failure, or death from coronary heart disease (fatal myocardial infarction excluding procedure-related events, fatal heart failure, sudden cardiac death, or other cardiac death).2,40 The composite cardiovascular outcome occurred in a total of 15 out of 59 CKD patients in the Metabolite Cohort. Separate regressions were fitted for each metabolite (predictor), adjusted for age, sex, and then additionally adjusted for diabetes, HDL-C. Shown are hazard ratios and 95% confidence intervals [CI] which can be interpreted as per the following example: The incidence rate of having the composite cardiovascular outcome increased by [(5.28-1)*100] % for every 1 SD increment in log C9-carnitine. Initially, a Bonferroni-corrected P value threshold of 0.0006 (0.05/89) was used to compare 89 metabolites between 60 CKD patients and 60 control subjects to account for the number of metabolites analyzed. 34 metabolites given in the sub-text of Table 3 were significantly different at P<0.0006. Values of 32 of these metabolites (all except cystamine, cysteamine due to incomplete data) from CKD patients were entered into the regression models above, with a significant P value at this stage denoted as below.
P<0.05
P<0.01
P<0.002 (Bonferroni-corrected for multiple testing based on 0.05/32 metabolites)
Race/ethnicity was obtained from chart review (outpatient clinic notes) or self-reported. Etiology of CKD was obtained from chart review of the primary nephrologist's clinic notes as described in the sub-text of Table 1. Macroalbuminuria was defined as >300 to 3500 mg/g creatinine.
3. Results
Baseline characteristics of the study participants are shown in Table 1. 240 total subjects (120 CKD patients and 120 controls) comprised the Entire Cohort. The first 120 subjects (60 CKD patients and 60 controls) comprised the Metabolite Cohort, in which plasma was separated for cross-sectional comparison of 89 circulating metabolites, and the first 30 CKD patients and 30 controls comprised the Monocyte Cohort, in which the main goal was to measure monocyte counts and cell-surface levels of the IL-3Rβ (Table S3 of the Supplementary Appendix). In the Entire Cohort (Table 1), CKD patients (eGFR 19.5±5.8 ml/min/1.73m2) were well matched to control subjects (eGFR 82.3±14.3 ml/min/1.73m2) by gender (approximately 60% female in both groups), but were slightly older than controls and more subjects were diabetic. Etiologies of CKD included diabetic nephropathy, hypertensive arterionephrosclerosis, and other etiologies of CKD, defined and categorized as in the sub-text of Table 1. A greater percentage of CKD patients were receiving statins. In the Monocyte and Metabolite Cohorts (Table S3 of the Supplementary Appendix), comparable gender, race/ethnicity, age distribution, and other characteristics were seen.
3.1 Cell-Surface IL-3Rβ is Associated with Monocyte Count in CKD Patients
There was no significant difference in total WBC count in CKD patients vs. controls (Table 1). CKD patients in the Monocyte Cohort displayed a 50% higher total monocyte count vs. controls (6.4 ± 3.6 vs. 4.4 ± 1.9 % of leukocytes, P=0.03) and a 50% higher major subset of CD14++CD16- “classical” monocytes19,23 vs. controls (4.5 ± 2.6 vs. 3.1 ± 1.3 % of leukocytes, P=0.03), Figure S2A of the Supplementary Appendix. Importantly, the level of cell-surface IL-3Rβ (MFI per cell) was higher by 25% on total monocytes and on all three monocyte subsets in CKD patients vs. controls (P<0.05 for each comparison), Figure S2A of the Supplementary Appendix. There was a strong positive correlation between the level of the IL-3Rβ and total monocyte count, CD14++CD16- monocyte count, and CD14++CD16+ monocyte count in CKD, respectively (Spearman's ρ=0.68, P<0.001; ρ=0.82, P<0.001; ρ=0.64, P<0.001, Figure 1B and Figure S2B of the Supplementary Appendix), suggesting that an underlying defect in cholesterol homeostasis might be contributing to monocytosis.8 These relationships remained significant after adjustment for age, sex, diabetes, and HDL-C (Table S4 of the Supplementary Appendix). In Control subjects, correlations between the IL-3Rβ and total, CD14++CD16-, CD14++CD16+ monocyte counts were weaker (ρ=0.54, P=0.002; ρ=0.49, P=0.007; ρ=0.29, P=0.12, respectively, Figure 1B and Figure S2B of the Supplementary Appendix), suggesting a less important relationship between cholesterol homeostasis and monocyte counts in these subjects.
3.2 Monocytes from CKD Patients are Deficient in ABCA1
We first used an assay employing patients' HDL and cultured THP-1 macrophages24 to test for a defect in the circulating cholesterol acceptor HDL.4,24 The level of total HDL-C isolated by precipitation of apoB-containing particles from pools of plasma (PEG-HDL-C) was not significantly different between 30 CKD patients and 30 controls (P=0.23) and there was also no difference in isotopic cholesterol efflux measurements using PEG-HDL-C from CKD patients vs. controls incubated with LXR-activated macrophage foam cells (P=0.21), Figure S3A of the Supplementary Appendix. These results indicated that there was no major defect in HDL-mediated cholesterol efflux from THP-1 macrophages. In contrast, ABCA1 mRNA (but not ABCG1 mRNA) was significantly lower by 20% in the major subset of CD14++CD16- monocytes19,23 from CKD patients vs. controls (P=0.03), Figure S3B of the Supplementary Appendix, suggesting that lower levels of cholesterol transporters that lead to higher levels of the IL-3Rβ may be at least partly responsible for monocytosis in certain patients with CKD. There was no significant difference in ABCA1 mRNA levels in monocytes from patients with various etiologies of CKD (Table S5 of the Supplementary Appendix). While a greater percentage of CKD patients vs. controls were receiving statins (Table 1), statin use did not significantly lower ABCA1 or ABCG1 expression in monocyte subsets from CKD patients, while it did in controls (Figure S4 of the Supplementary Appendix). In addition, mean ABCA1 mRNA levels were about 15% lower in CD14++CD16- monocytes from CKD patients vs. controls not taking statins.
3.3 Monocytes from CKD Patients with Diabetic Nephropathy Have a Cellular Defect in ABCA1-Mediated Cholesterol Efflux
We measured cholesterol efflux in 88 CKD patients vs. 90 controls, defined as the percent decrease in BODIPY-cholesterol MFI in apoA1-treated monocytes relative to the non-acceptor control for each subject. % BODIPY-cholesterol efflux to apoA1 was non-significantly lower in total, CD14++CD16-, CD14++CD16+, and CD14lowCD16+ monocytes from CKD patients vs. controls (0.1 ± 16.3 vs. 2.6 ± 13.9 %, 0.0 ± 15.9 vs. 2.2 ± 14.3 %, 0.1 ± 18.0 vs. 2.5 ± 15.0 %, and 0.8 ± 16.2 vs. 3.3 ± 14.6 % respectively). % cholesterol efflux to apoA1 varied based on etiology of CKD, with the lowest cholesterol efflux measurements occurring in CKD patients with diabetic nephropathy rather than those with hypertensive arterionephrosclerosis or other etiologies of CKD (P=0.04 total monocytes, P=0.06 CD14++CD16- monocytes, P=0.04 CD14lowCD16+ monocytes, ANOVA, Figure 1C and Figure S5A of the Supplementary Appendix). Among CKD patients with diabetic nephropathy, diabetic controls, and non-diabetic controls, it was the comparison between CKD patients with diabetic nephropathy and non-diabetic control subjects which was significant at the 0.05 level in total, CD14++CD16-, and CD14lowCD16+ monocytes (Figure 1D and Figure S5B of the Supplementary Appendix). Since efflux to apoA1 occurs via ABCA1,9 results provide evidence for a cellular defect in ABCA1-mediated cholesterol efflux in monocytes from CKD patients with diabetic nephropathy, and suggest that this defect may occur in addition to the decrease in ABCA1 mRNA levels in these patients, given similar reductions in ABCA1 mRNA in different etiology categories of CKD (Table S5 of the Supplementary Appendix).
While decreasing quartiles of BODIPY-cholesterol efflux in total monocytes from CKD patients were not correlated with several traditional risk factors for atherosclerotic cardiovascular disease, a greater percentage of CKD patients with diabetes (P=0.02), diabetic nephropathy (P=0.03), and those taking angiotensin converting enzyme inhibitors/angiotensin receptor blockers (P=0.03) were found in the lowest quartile of BODIPY-cholesterol efflux to apoA1 (Table 2). Similar results were obtained when comparing demographic and clinical variables across quartiles of BODIPY-cholesterol efflux in monocyte subsets from CKD patients (Tables S6-S8 and Figure S6 of the Supplementary Appendix). In terms of the relationship between these variables and cholesterol efflux to apoA1 in total monocytes from control subjects, decreasing quartiles of BODIPY-cholesterol efflux in total monocytes from controls were not significantly correlated with diabetes (P=0.11, Table S9 of the Supplementary Appendix); however multivariable quantile regression analysis adjusted for age, sex, HDL-C, and disease status (CKD or control) revealed that diabetes was independently associated with % BODIPY-cholesterol efflux to apoA1 in total monocytes from all subjects (P=0.02, N=178).
Table 2. % BODIPY-cholesterol Efflux to Apo A1 in Total Monocytes from CKD Patients (N=88) & Traditional and Non-Traditional Risk Factors for Atherosclerotic Cardiovascular Disease*†.
| Characteristic | Quartile 1 BODIPY-cholesterol Efflux (N=22) | Quartile 2 BODIPY-cholesterol Efflux (N=22) | Quartile 3 BODIPY-cholesterol Efflux (N=22) | Quartile 4 BODIPY-cholesterol Efflux (N=22) | P Value for Trend |
|---|---|---|---|---|---|
| Age –yr Median (IQR) | 67 (60-73) | 69 (58-82) | 72 (59-81) | 67 (55-77) | 0.88 |
| Female sex (%) | 59 | 64 | 59 | 45 | 0.34 |
| Hispanic (%)** | 68 | 64 | 73 | 82 | 0.25 |
| HDL-C –mg/dL Median (IQR) | 43 (31-58) | 47 (38-69) | 48 (37-55) | 48 (33-67) | 0.57 |
| LDL-C –mg/dL Median (IQR) | 95 (69-123 | 101 (79-123) | 79 (60-103) | 87 (61-109) | 0.32 |
| Triglycerides –mg/dL Median (IQR) | 127 (91-192) | 120 (89-160) | 139 (93-183) | 134 (116-150) | 0.68 |
| Total Cholesterol –mg/dL Median (IQR) | 172 (151-198) | 180 (149-205) | 160 (133-191) | 159 (147-193) | 0.59 |
| Systolic BP –mmHg Median (IQR) | 136 (126-144) | 142 (132-149) | 137 (132-140) | 133 (129-145) | 0.68 |
| Diabetes (%)‡ | 91 | 45 | 59 | 50 | 0.02 |
| Diabetic nephropathy (%)‡ | 77 | 41 | 59 | 36 | 0.03 |
| Macroalbuminuria (%)‡ | 73 | 82 | 77 | 55 | 0.17 |
| ACE-inhibitor/ARB (%) | 64 | 36 | 41 | 27 | 0.03 |
| Statin (%) | 86 | 68 | 73 | 100 | 0.22 |
| Apo A1 –mg/dL Median (IQR) | 132 (118-161) | 141 (118-178) | 149 (129-172) | 153 (123-175) | 0.20 |
| Apo C3 –mg/dL Median (IQR) | 16 (14-20) | 16 (12-21) | 16 (12-20) | 17 (14-19) | 0.84 |
| Apo B –mg/dL Median (IQR) | 88 (70-113) | 92 (72-111) | 80 (65-100) | 81 (67-102) | 0.44 |
All continuous variables are reported as medians with inter-quartile ranges (IQR) and categorical variables as percentages. Characteristics were compared across quartiles of BODIPY-cholesterol efflux with the use of the Jonckheere-Terpstra trend test.
HDL-C denotes high density lipoprotein cholesterol; LDL-C, low density lipoprotein cholesterol; ACE-inhibitor, angiotensin converting enzyme inhibitor; ARB, angiotensin receptor blocker; Apo A1, apolipoprotein A1; Apo C3, apolipoprotein C3; and Apo B, apolipoprotein B.
Race/ethnicity was obtained from chart review (outpatient clinic notes) or self-reported.
Etiology of CKD was obtained from chart review of the primary nephrologist's clinic notes as described in the sub-text of Table 1. Macroalbuminuria was defined as >300 to 3500 mg/g creatinine. In 178 total subjects, multivariable quantile regression analysis adjusted for age, sex, HDL-C, and disease status (CKD or control) revealed that diabetes was independently associated with % BODIPY-cholesterol efflux to apoA1 in total monocytes (P=0.02).
3.4 Plasma from CKD Patients Reduces ABCA1 in THP-1 Control Human Monocytes
Pooled 2.5% plasma from 30 CKD patients incubated with THP-1 monocytes for 6 hours induced an almost 20% downregulation in ABCA1 mRNA vs. pooled 2.5% plasma from 30 control subjects (P=0.02), Figure S3C of the Supplementary Appendix, suggesting that a circulating substance(s) may disrupt cellular cholesterol efflux in CKD.
3.5 Medium Chain Acylcarnitines are Associated with Lower Levels of Cholesterol Transporters in Monocytes from CKD Patients and with Cardiovascular Events at Follow-up
Upon entry into linear regression models adjusted for age, sex, diabetes, and HDL-C, 6 metabolites (carnitine, C4-butyryl-carnitine, C8-carnitine, C9-carnitine, C10-carnitine, citrulline) had significant inverse relationships (at P<0.05) with ABCA1 and ABCG1 mRNAs in monocyte subsets from CKD patients (Table 3), relationships that were evaluated due to the negative effect of CKD plasma on cholesterol transporters. A full list of metabolites elevated in CKD patients vs. controls is given in Table S10 of the Supplementary Appendix. Of the 29 metabolites that were elevated in CKD patients vs. controls, a significant difference across 3 etiology categories of CKD (P<0.05, ANOVA) was only seen for the plasma metabolites xanthosine and carnitine (Table S10 of the Supplementary Appendix). Levels of medium chain acylcarnitines did not significantly differ by etiology of CKD. While C5-valeryl-carnitine was significantly and positively associated with cell-surface IL-3Rβ expression in CD14lowCD16+ monocytes from CKD patients in a simple linear regression model (P<0.05), significance was lost after multivariable adjustment (Table S11 of the Supplementary Appendix). We found no direct relationship between exogenous short and medium-chain acylcarnitines and cholesterol transporter mRNAs in THP-1 cells (data not shown), suggesting that the strong inverse association is likely mediated by in vivo factors particular to the CKD milieu.
15 out of 59 CKD patients in the Metabolite Cohort met the composite cardiovascular outcome vs. 2 out of 60 controls during a median follow-up period of 2.6 years (P=0.001, Log-Rank test). Upon entry into Cox regression models adjusted for age, sex, diabetes, and HDL-C, 4 metabolites (5′adenosylhomocysteine, C7-carnitine, C9-carnitine, xanthosine) were significantly associated (at P<0.05) with first occurrence of a cardiovascular event in CKD patients (Table 4). 1 of these metabolites (C9-carnitine) remained significant at P<0.002 (Bonferroni-corrected for multiple testing). Several traditional risk factors for atherosclerotic cardiovascular disease listed in Table 4 were not significantly associated (at P<0.05) with cardiovascular events in CKD patients.
Discussion
A cholesterol efflux assay which measures efflux of cholesterol from cultured cells to patients' HDL has recently been associated with future atherosclerotic cardiovascular disease events5 emphasizing the potential value of this5 and other in vitro assays4 in guiding the development of new HDL-targeted therapies4 which may particularly benefit patients with dysfunctional HDL.6,7 In this study, we report evidence for a cellular defect in ABCA1-mediated cholesterol efflux in monocytes from CKD patients with diabetic nephropathy, using a fluorescent analog of cholesterol which primarily measures efflux via this pathway,25 while we found no defect in HDL functionality in CKD patients vs. controls using a traditional isotopic cholesterol efflux assay. In the presence of a cellular defect occurring at the initiation step of the reverse cholesterol transport pathway, such as the one we discovered in monocytes from CKD patients with diabetic nephropathy, increasing levels of HDL or enhancing HDL function may not alone be helpful. Therapies to boost cholesterol transporters and enhance cellular cholesterol efflux such as liver X receptor (LXR) activators26 targeted to monocytes/macrophages may be required, perhaps in combination with infusion of cholesterol-poor reconstituted HDL infusions, which can mediate passive cholesterol efflux from monocytes/macrophages independent of ABC transporters.27
HDL-C levels were not markedly altered in CKD patients compared to control subjects recruited from an urban Internal Medicine clinic; yet compared to these subjects CKD patients had lower levels of endogenous cholesterol transporters (ABCA1 mRNA) and higher levels of cell-surface IL-3Rβ, which in part mediates the relationship between defective cholesterol homeostasis and myeloid proliferation in animal studies.8 In humans, we discovered that the IL-3Rβ was independently associated with monocyte counts in CKD, a marker16,28,29 and mediator30 of atherosclerosis. In addition, the lowest cholesterol efflux measurements occurred in CKD patients with diabetic nephropathy, which suggested an additional cellular defect in these patients, given similar reductions in ABCA1 mRNA in different etiology categories of CKD. One possibility is reactive carbonyl-mediated damage to ABCA1 protein in the setting of diabetes;31 another is altered cellular lipid metabolism related to defective mitochondrial function. Together these findings define a novel underlying pathophysiology which is likely relevant to accelerated atherosclerosis in CKD,15 adding to earlier reports documenting dysfunction of the reverse cholesterol transport pathway in CKD.32,33
We hypothesized that a circulating factor may downregulate cholesterol transporters in CKD. We indeed found that plasma from CKD patients vs. controls reduced ABCA1 expression in THP-1 monocytes, a phenomenon additionally seen in cultured endothelial cells exposed to dialysis patients' plasma.34 One possibility is that systemic inflammation (as seen in our CKD patients) may increase toll-like receptor signaling, leading to repression of LXR target genes including ABCA1.35 Statins may lower expression of LXR target genes in control subjects by inhibiting the synthesis of an oxysterol ligand for LXR,36 while having less of an effect on modulation of cholesterol transporters in CKD patients due to inflammation-related transrepression of LXR mRNA.35
We discovered that plasma metabolites inversely associated with endogenous cholesterol transporters in CKD monocytes predicted cardiovascular events in CKD patients, specifically C9-carnitine. While medium chain acylcarnitines are known to be increased in the plasma of type 2 diabetics,37 the relationships we observed were independent of diabetes. Medium chain acylcarnitines have previously been associated with cardiovascular events38 and mortality39 in non-renal patients at risk for cardiovascular disease.39 The mechanism of increased cardiovascular risk due to C9-carnitine in CKD patients may be related to the fact that medium-chain acylcarnitines can activate pro-inflammatory nuclear factor κB (NFκB)-associated pathways37 which may repress LXR targets such as ABCA1. Finally, we acknowledge a limitation of our study that CKD patients were overall older than controls and more subjects were diabetic; however, we analyzed diabetic nephropathy patients alongside non-diabetic controls, strengthening our results.
In conclusion, we report a cellular defect in ABCA1-mediated cholesterol efflux that occurs early on in the reverse cholesterol transport pathway in monocytes from CKD patients with diabetic nephropathy. We suggest that therapeutic approaches to overcome this proximal defect may enhance the efficacy of new therapies targeting distal components of the reverse cholesterol transport pathway, and may reduce cardiovascular risk.
Supplementary Material
Highlights.
Cholesterol efflux in humans varies in terms of cellular components.
We report a cellular defect in ABCA1 -mediated cholesterol efflux in CKD patients.
Plasma metabolites predicted cardiovascular events in CKD patients.
Acknowledgments
Preliminary results were presented by Dr. Ganda on Saturday, November 7, 2015 at the American Society of Nephrology annual meeting in San Diego, CA during a Clinical Practice Session entitled ‘Non-Framingham Risk Factors for Cardiovascular Disease in the CKD Population: Inflammation and Cardiovascular Disease: New Insight from Monocytes and Macrophages’. We wish to thank the patients who participated in this study.
Sources of Funding: Supported by awards to Dr. Ganda from the NIDDK of the NIH (K23DK097288), The Louis V. Gerstner, Jr. Scholars Program at Columbia College of Physicians & Surgeons, the Irving Institute for Clinical and Translational Research through the National Center for Advancing Translational Sciences (UL1 TR000040), and Merck and Pfizer Investigator-Initiated research grants to Dr. Ganda; also supported by awards from the NHLBI to Dr. Tall (1R01HL107653) and to Dr. Gerszten (1R01HL096738), an AHA Established Investigator Award to Dr. Gerszten, and the Leducq Foundation. The content is solely the responsibility of the authors and does not necessarily represent the official views of the NIH.
Footnotes
Disclosures: AT reports being a consultant to CSL, Lilly, Merck, MedImmune and Amgen.
Publisher's Disclaimer: This is a PDF file of an unedited manuscript that has been accepted for publication. As a service to our customers we are providing this early version of the manuscript. The manuscript will undergo copyediting, typesetting, and review of the resulting proof before it is published in its final citable form. Please note that during the production process errors may be discovered which could affect the content, and all legal disclaimers that apply to the journal pertain.
References
- 1.Gordon DJ, Rifkind BM. High-density lipoprotein--the clinical implications of recent studies. N Engl J Med. 1989;321:1311–6. doi: 10.1056/NEJM198911093211907. [DOI] [PubMed] [Google Scholar]
- 2.Barter PJ, Caulfield M, Eriksson M, et al. Effects of torcetrapib in patients at high risk for coronary events. N Engl J Med. 2007;357:2109–22. doi: 10.1056/NEJMoa0706628. [DOI] [PubMed] [Google Scholar]
- 3.Boden WE, Probstfield JL, Anderson T, et al. Niacin in patients with low HDL cholesterol levels receiving intensive statin therapy. N Engl J Med. 2011;365:2255–67. doi: 10.1056/NEJMoa1107579. [DOI] [PubMed] [Google Scholar]
- 4.Khera AV, Cuchel M, de la Llera-Moya M, et al. Cholesterol efflux capacity, high-density lipoprotein function, and atherosclerosis. N Engl J Med. 2011;364:127–35. doi: 10.1056/NEJMoa1001689. [DOI] [PMC free article] [PubMed] [Google Scholar]
- 5.Rohatgi A, Khera A, Berry JD, et al. HDL cholesterol efflux capacity and incident cardiovascular events. N Engl J Med. 2014;371:2383–93. doi: 10.1056/NEJMoa1409065. [DOI] [PMC free article] [PubMed] [Google Scholar]
- 6.Shao B, Tang C, Sinha A, et al. Humans With Atherosclerosis Have Impaired ABCA1 Cholesterol Efflux and Enhanced High-Density Lipoprotein Oxidation by Myeloperoxidase. Circ Res. 2014;114:1733–42. doi: 10.1161/CIRCRESAHA.114.303454. [DOI] [PMC free article] [PubMed] [Google Scholar]
- 7.Holzer M, Birner-Gruenberger R, Stojakovic T, et al. Uremia alters HDL composition and function. J Am Soc Nephrol. 2011;22:1631–41. doi: 10.1681/ASN.2010111144. [DOI] [PMC free article] [PubMed] [Google Scholar]
- 8.Yvan-Charvet L, Pagler T, Gautier EL, et al. ATP-binding cassette transporters and HDL suppress hematopoietic stem cell proliferation. Science. 2010;328:1689–93. doi: 10.1126/science.1189731. [DOI] [PMC free article] [PubMed] [Google Scholar]
- 9.Wang N, Silver DL, Costet P, Tall AR. Specific binding of ApoA-I, enhanced cholesterol efflux, and altered plasma membrane morphology in cells expressing ABC1. J Biol Chem. 2000;275:33053–8. doi: 10.1074/jbc.M005438200. [DOI] [PubMed] [Google Scholar]
- 10.Wang N, Lan D, Chen W, Matsuura F, Tall AR. ATP-binding cassette transporters G1 and G4 mediate cellular cholesterol efflux to high-density lipoproteins. Proc Natl Acad Sci U S A. 2004;101:9774–9. doi: 10.1073/pnas.0403506101. [DOI] [PMC free article] [PubMed] [Google Scholar]
- 11.Langmann T, Klucken J, Reil M, et al. Molecular cloning of the human ATP-binding cassette transporter 1 (hABC1): evidence for sterol-dependent regulation in macrophages. Biochem Biophys Res Commun. 1999;257:29–33. doi: 10.1006/bbrc.1999.0406. [DOI] [PubMed] [Google Scholar]
- 12.Wang X, Collins HL, Ranalletta M, et al. Macrophage ABCA1 and ABCG1, but not SR-BI, promote macrophage reverse cholesterol transport in vivo. J Clin Invest. 2007;117:2216–24. doi: 10.1172/JCI32057. [DOI] [PMC free article] [PubMed] [Google Scholar]
- 13.Hayden MR, Clee SM, Brooks-Wilson A, Genest J, Jr, Attie A, Kastelein JJ. Cholesterol efflux regulatory protein, Tangier disease and familial high-density lipoprotein deficiency. Current opinion in lipidology. 2000;11:117–22. doi: 10.1097/00041433-200004000-00003. [DOI] [PubMed] [Google Scholar]
- 14.Go AS, Chertow GM, Fan D, McCulloch CE, Hsu CY. Chronic kidney disease and the risks of death, cardiovascular events, and hospitalization. N Engl J Med. 2004;351:1296–305. doi: 10.1056/NEJMoa041031. [DOI] [PubMed] [Google Scholar]
- 15.Yerkey MW, Kernis SJ, Franklin BA, Sandberg KR, McCullough PA. Renal dysfunction and acceleration of coronary disease. Heart. 2004;90:961–6. doi: 10.1136/hrt.2003.015503. [DOI] [PMC free article] [PubMed] [Google Scholar]
- 16.Ganda A, Magnusson M, Yvan-Charvet L, et al. Mild renal dysfunction and metabolites tied to low HDL cholesterol are associated with monocytosis and atherosclerosis. Circulation. 2013;127:988–96. doi: 10.1161/CIRCULATIONAHA.112.000682. [DOI] [PMC free article] [PubMed] [Google Scholar]
- 17.Levey AS, Bosch JP, Lewis JB, Greene T, Rogers N, Roth D. A more accurate method to estimate glomerular filtration rate from serum creatinine: a new prediction equation. Modification of Diet in Renal Disease Study Group. Ann Intern Med. 1999;130:461–70. doi: 10.7326/0003-4819-130-6-199903160-00002. [DOI] [PubMed] [Google Scholar]
- 18.K/DOQI clinical practice guidelines for chronic kidney disease: evaluation, classification, and stratification. Am J Kidney Dis. 2002;39:S1–266. [PubMed] [Google Scholar]
- 19.Ziegler-Heitbrock L, Ancuta P, Crowe S, et al. Nomenclature of monocytes and dendritic cells in blood. Blood. 2010;116:e74–80. doi: 10.1182/blood-2010-02-258558. [DOI] [PubMed] [Google Scholar]
- 20.Martel C, Li W, Fulp B, et al. Lymphatic vasculature mediates macrophage reverse cholesterol transport in mice. J Clin Invest. 2013;123:1571–9. doi: 10.1172/JCI63685. [DOI] [PMC free article] [PubMed] [Google Scholar]
- 21.Cheng S, Rhee EP, Larson MG, et al. Metabolite profiling identifies pathways associated with metabolic risk in humans. Circulation. 2012;125:2222–31. doi: 10.1161/CIRCULATIONAHA.111.067827. [DOI] [PMC free article] [PubMed] [Google Scholar]
- 22.Wang TJ, Larson MG, Vasan RS, et al. Metabolite profiles and the risk of developing diabetes. Nat Med. 2011;17:448–53. doi: 10.1038/nm.2307. [DOI] [PMC free article] [PubMed] [Google Scholar]
- 23.Cros J, Cagnard N, Woollard K, et al. Human CD14dim monocytes patrol and sense nucleic acids and viruses via TLR7 and TLR8 receptors. Immunity. 2010;33:375–86. doi: 10.1016/j.immuni.2010.08.012. [DOI] [PMC free article] [PubMed] [Google Scholar]
- 24.Yvan-Charvet L, Kling J, Pagler T, et al. Cholesterol efflux potential and antiinflammatory properties of high-density lipoprotein after treatment with niacin or anacetrapib. Arterioscler Thromb Vasc Biol. 2010;30:1430–8. doi: 10.1161/ATVBAHA.110.207142. [DOI] [PMC free article] [PubMed] [Google Scholar]
- 25.Sankaranarayanan S, Kellner-Weibel G, de la Llera-Moya M, et al. A sensitive assay for ABCA1-mediated cholesterol efflux using BODIPY-cholesterol. J Lipid Res. 2011;52:2332–40. doi: 10.1194/jlr.D018051. [DOI] [PMC free article] [PubMed] [Google Scholar]
- 26.Scott J. The liver X receptor and atherosclerosis. N Engl J Med. 2007;357:2195–7. doi: 10.1056/NEJMcibr075951. [DOI] [PubMed] [Google Scholar]
- 27.Rosenson RS, Brewer HB, Jr, Davidson WS, et al. Cholesterol efflux and atheroprotection: advancing the concept of reverse cholesterol transport. Circulation. 2012;125:1905–19. doi: 10.1161/CIRCULATIONAHA.111.066589. [DOI] [PMC free article] [PubMed] [Google Scholar]
- 28.Johnsen SH, Fosse E, Joakimsen O, et al. Monocyte count is a predictor of novel plaque formation: a 7-year follow-up study of 2610 persons without carotid plaque at baseline the Tromso Study. Stroke. 2005;36:715–9. doi: 10.1161/01.STR.0000158909.07634.83. [DOI] [PubMed] [Google Scholar]
- 29.Chapman CM, Beilby JP, McQuillan BM, Thompson PL, Hung J. Monocyte count, but not C-reactive protein or interleukin-6, is an independent risk marker for subclinical carotid atherosclerosis. Stroke. 2004;35:1619–24. doi: 10.1161/01.STR.0000130857.19423.ad. [DOI] [PubMed] [Google Scholar]
- 30.Swirski FK, Libby P, Aikawa E, et al. Ly-6Chi monocytes dominate hypercholesterolemia-associated monocytosis and give rise to macrophages in atheromata. J Clin Invest. 2007;117:195–205. doi: 10.1172/JCI29950. [DOI] [PMC free article] [PubMed] [Google Scholar]
- 31.Passarelli M, Tang C, McDonald TO, et al. Advanced glycation end product precursors impair ABCA1-dependent cholesterol removal from cells. Diabetes. 2005;54:2198–205. doi: 10.2337/diabetes.54.7.2198. [DOI] [PubMed] [Google Scholar]
- 32.Liang K, Vaziri ND. Upregulation of acyl-CoA: cholesterol acyltransferase in chronic renal failure. American journal of physiology Endocrinology and metabolism. 2002;283:E676–81. doi: 10.1152/ajpendo.00364.2001. [DOI] [PubMed] [Google Scholar]
- 33.Vaziri ND, Liang K, Parks JS. Down-regulation of hepatic lecithin:cholesterol acyltransferase gene expression in chronic renal failure. Kidney Int. 2001;59:2192–6. doi: 10.1046/j.1523-1755.2001.00734.x. [DOI] [PubMed] [Google Scholar]
- 34.Cardinal H, Raymond MA, Hebert MJ, Madore F. Uraemic plasma decreases the expression of ABCA1, ABCG1 and cell-cycle genes in human coronary arterial endothelial cells. Nephrol Dial Transplant. 2007;22:409–16. doi: 10.1093/ndt/gfl619. [DOI] [PubMed] [Google Scholar]
- 35.Castrillo A, Joseph SB, Vaidya SA, et al. Crosstalk between LXR and toll-like receptor signaling mediates bacterial and viral antagonism of cholesterol metabolism. Mol Cell. 2003;12:805–16. doi: 10.1016/s1097-2765(03)00384-8. [DOI] [PubMed] [Google Scholar]
- 36.Wong J, Quinn CM, Brown AJ. Statins inhibit synthesis of an oxysterol ligand for the liver × receptor in human macrophages with consequences for cholesterol flux. Arterioscler Thromb Vasc Biol. 2004;24:2365–71. doi: 10.1161/01.ATV.0000148707.93054.7d. [DOI] [PubMed] [Google Scholar]
- 37.Adams SH, Hoppel CL, Lok KH, et al. Plasma acylcarnitine profiles suggest incomplete long-chain fatty acid beta-oxidation and altered tricarboxylic acid cycle activity in type 2 diabetic African-American women. J Nutr. 2009;139:1073–81. doi: 10.3945/jn.108.103754. [DOI] [PMC free article] [PubMed] [Google Scholar]
- 38.Shah SH, Bain JR, Muehlbauer MJ, et al. Association of a peripheral blood metabolic profile with coronary artery disease and risk of subsequent cardiovascular events. Circ Cardiovasc Genet. 2010;3:207–14. doi: 10.1161/CIRCGENETICS.109.852814. [DOI] [PubMed] [Google Scholar]
- 39.Shah SH, Sun JL, Stevens RD, et al. Baseline metabolomic profiles predict cardiovascular events in patients at risk for coronary artery disease. Am Heart J. 2012;163:844–50 e1. doi: 10.1016/j.ahj.2012.02.005. [DOI] [PubMed] [Google Scholar]
- 40.Rogacev KS, Seiler S, Zawada AM, et al. CD14++CD16+ monocytes and cardiovascular outcome in patients with chronic kidney disease. Eur Heart J. 2011;32:84–92. doi: 10.1093/eurheartj/ehq371. [DOI] [PubMed] [Google Scholar]
Associated Data
This section collects any data citations, data availability statements, or supplementary materials included in this article.