Abstract
Enhancement of non-uniformly illuminated images often suffers from over-enhancement and produces unnatural results. This paper presents a naturalness preserved enhancement method for non-uniformly illuminated images, using a priori multi-layer lightness statistics acquired from high-quality images. Our work makes three important contributions: designing a novel multi-layer image enhancement model; deriving the multi-layer lightness statistics of high-quality outdoor images, which are incorporated into the multi-layer enhancement model; and showing that the overall quality rating of enhanced images is consistent with a combination of contrast enhancement and naturalness preservation. Two separate human observer evaluation studies were conducted on naturalness preservation and overall image quality. The results showed the proposed method outperformed four compared state-of-the-art enhancement methods.
Index Terms: Image enhancement, naturalness preservation, lightness statistics, multi-layer
I. INTRODUCTION
As a natural scene is often non-uniformly illuminated, it is common for a natural image having different visibility in different local areas. Enhancement of non-uniformly illuminated images has been extensively studied, but it is still a challenging problem, in that contrast enhancement and naturalness preservation often conflict with each other, while both of them are essential to the quality of enhanced images.
Previous studies mainly focused on contrast enhancement, while only a few took naturalness preservation into consideration. Since naturalness is closely related to individuals’ preferences, there has been no convincing definition of naturalness. A practical way is to consider naturalness from some specific aspects, such as details fidelity, lightness inequality preservation, and color perception [1]–[6]. For non-uniformly illuminated image enhancement, Wang et al. [4] pointed out that the reversal of lightness inequality (for two areas of different lightness, the brighter area becomes darker after enhancement) often leads to unnatural results. To effectively enhance non-uniformly illuminated images, a good method should be able to enhance the contrast as well as preserve the lightness inequality between different local areas.
From the point of view of non-uniformly image enhancement, this section reviews some commonly used image enhancement techniques.
1) Histogram specification-based enhancement
Histogram specification is a simple but frequently used technique for image enhancement. The basic idea of histogram specification is to render the lightness histogram of an image to a specific distribution. Early methods [7], [8] stretched contrast by equally rendering the histogram across all gray levels, e.g. histogram equalization, while these methods often over stretched the gray levels that have larger histogram bins than others. Later studies proposed contrast-limited histogram equalization which prevented over-enhancement by restricting the stretch of similar gray levels [9]–[16]. These methods actually make a compromise of contrast enhancement between different gray levels. But most key parameters are set empirically, which limited the application of these methods.
2) Unsharp masking enhancement
Unsharp masking methods usually enhance images by improving high-frequency bands [17], [18]. The flowchart of these methods is often as: decomposing an image into several frequency bands, assigning greater enhancement factors to higher frequency bands, and summing them up to get the enhanced image. Although these methods are effective in highlighting high frequencies, they may fail to enhance a non-uniformly illuminated image, for which a high-frequency band needs to be processed differently in different local areas. In addition, the parameters of these methods are often set empirically and the enhanced results are easily out of the gray level range of an image. To solve the out-of-range problem, some recent methods [19] employ non-linear mapping functions, which actually preserve the gray level range at the cost of reducing the difference between some gray levels.
3) Retinex-based enhancement
Retinex theory assumes that image lightness depends on illumination and reflectance (the illumination is the radiant flux received by the scene, and the reflectance is the effectiveness in reflecting radiant energy), and sensations of colors have a strong correlation with reflectance [20]. Early Retinex-based methods [21], [22] enhanced an image by removing the estimated illumination and the result often looked unnatural. Considering illumination is an important factor to the enhanced image quality, many recent methods [4], [23]–[25] compress rather than remove the estimated illumination. However, as pointed out by Land et al. [20], illumination is often unknown in a natural scene. McCann [26] indicates that complete color constancy requires humans to ignore illumination so as to synthesize sensations of reflectance, and color constancy is a good assumption in uniform illumination, but not true for real natural images. Theoretically, it is an ill-posed problem to decompose an image into reflectance and illumination for non-uniformly illuminated images. The estimated illumination and reflectance are actually low- and high- frequency components. Reducing the variation of the low-frequency component may suppress some details (edges or contours).
A fundamental tenet of vision is that visual systems are matched to evolution and environments [27]–[30]. A reasonable argument is that an enhanced image looks unnatural is probably because it is not consistent with a priori statistics of natural scenes. For instance, the 1/f power law indicates the amplitude spectrum of a natural scene follow a power law [31]–[36]. But some methods boost the high frequencies too much and thus drive the amplitude spectrum different from the prior. To enhance an image naturally, it may be helpful to use a priori statistics of natural scenes. This paper presents a naturalness preserved image enhancement method (NPIE-MLLS) using a priori multi-layer lightness statistics of high-quality outdoor images. Our work makes three main contributions. First, we propose a novel multi-layer model to extract details layer by layer, which is used to solve the problem that some details remain in the low-frequency component. Second, we derived a multi-layer lightness prior of high-quality outdoor images, which is effective to render the low-frequency component of non-uniformly illuminated images. Third, we found that the overall image quality assessment is correlated with a combination of contrast enhancement and naturalness preservation. In addition, we conducted two separate human observer evaluation studies on naturalness preservation and overall image quality.
Following this introduction section, section II introduces the related work and the motivation. Section III provides an overview of the proposed method, the technical details of which are illustrated in sections IV, V, and VI. Section VII presents the processed results and performance comparison. Finally, conclusions are drawn in Section VIII.
II. Related Work and Motivation
Retinex theory assumes that the perceived lightness is the product of illumination and reflectance, which can be modeled as:
| (1) |
where I(x, y) indicates an image, F(x, y) is the illumination, R(x, y) is the reflectance, and c ∈ {r, g, b} is the color channel index.
Early single-scale Retinex-based (SSR) methods [22] typically enhance an image by removing the estimated illumination and regard the remaining component, i.e., the estimated reflectance, as the enhanced image. Multi-scale Retinex-based (MSR) methods [21] estimate reflectance using several filters of different sizes and take the weighted average as the enhanced image (Fig. 1(a)). Both SSR and MSR may fail to naturally enhance non-uniformly illuminated images, because the lightness inequality between different local areas is easily reversed after removing the estimated illumination [4]. To preserve the lightness inequality, Wang et al. [4] proposed a naturalness preserved enhancement algorithm (NPEA), which consists of three steps (Fig. 1(b)): decomposing an image into two components, modifying the estimated illumination, and combining the modified illumination and the estimated reflectance to obtain the enhanced image.
Fig. 1.
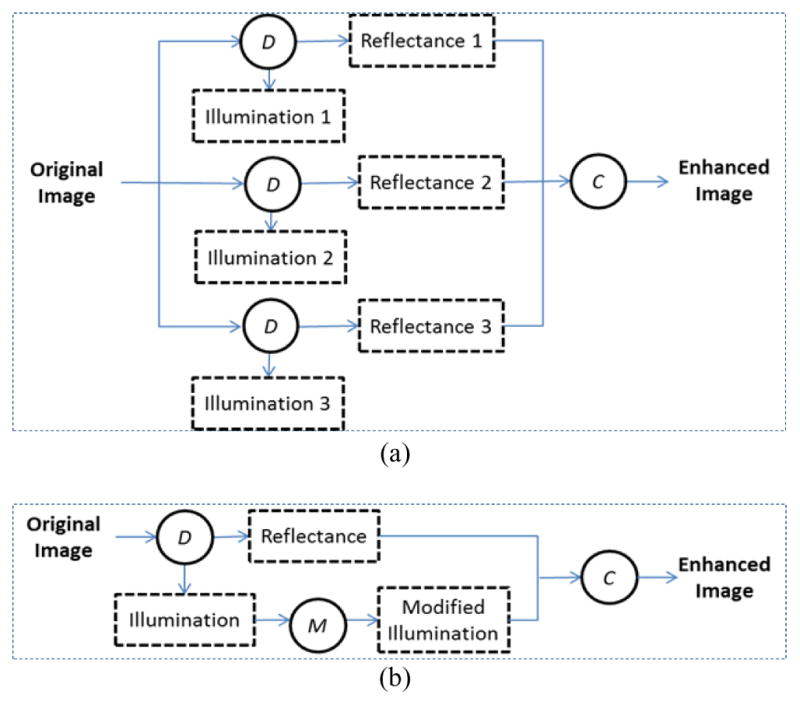
Existing Retinex-based image enhancement models. (a) Multi-scale Retinex-based method [21]. (b) Naturalness preserved enhancement algorithm(NPEA) [4]. D indicates image decomposition, C indicates image combination, and M is illumination mapping.
The estimated illumination is actually the low-frequency component of the original image, and the estimated reflectance is the high-frequency component. Because some details (true reflectance) may still remain in the estimated illumination, even with the state-of-the-arts (Fig. 2) [24], [25], [37], these details cannot be recovered by averaging the reflectance estimated in different scales as it is done in MSR. While NPEA incorporates the illumination (a modified version), the contrast of the details in the estimated illumination may be perceptually suppressed due to the illumination modification.
Fig. 2.
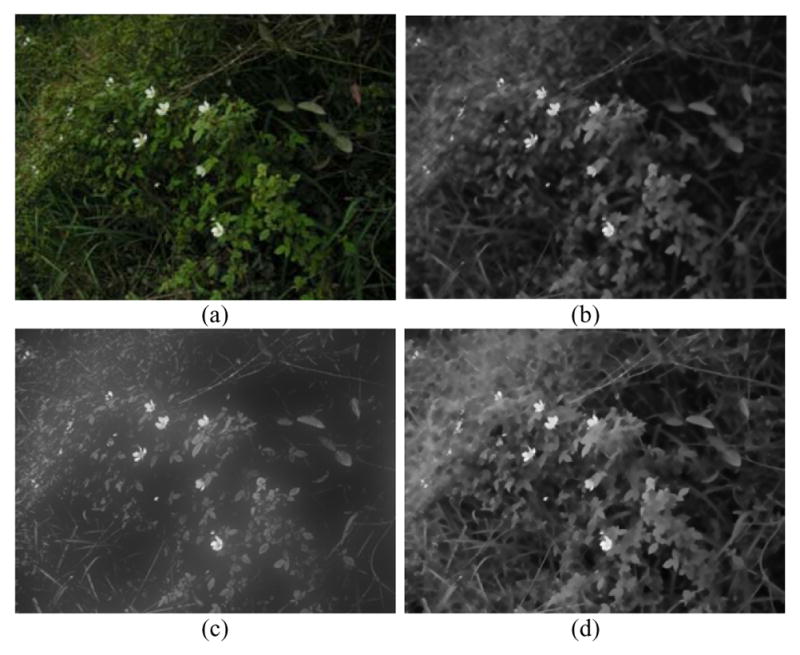
Illustration of details remaining in the estimated illumination. (a) Original image. (b) Estimated Illumination by [37]. (c) Estimated Illumination by [25]. (d) Estimated Illumination by [24].
One of the reasons why human eyes have much higher dynamic ranges than cameras is because the perceived visibility of the image details highly depends on the local luminance mean. Since “local” is a relative concept, Peli [38] proposed a multi-layer contrast definition, i.e., the perceived contrast of a given image location depends on which frequency band the image details are assessed. In other words, the contrast of the image location is different for different “local” scales. Specifically, the contrast of each frequency band is defined by Peli as the ratio of the bandpass-filtered image at that frequency to the low-pass image filtered to an octave below the same frequency. For image enhancement applications, we believe there can be some advantages to decompose an image into multiple layers (multiple frequency bands) and treat these layers as “local” at different scales.
III. Overview of the Proposed Multi-layer Model
Our method is based on two essential assumptions. Firstly, we assume that details may exist in all spatial frequency bands. So the proposed method uses a low-pass filter to decompose an image iteratively into multiple layers (multiple frequency bands) until the remaining low-frequency component is uniform. This scheme is different from the existing MSR model, which estimates the reflectance at several scales, with the estimation at a larger scale including that at smaller scales. Secondly, we assume that high-quality images have common statistical characteristics in lightness that are associated with those multiple layers, and the statistical characteristics are different from those of non-uniformly illuminated images. If the multi-layer lightness prior of high-quality images is applied to render separate layers, non-uniformly illuminated images may be manipulated to be like high-quality ones. Thus, the enhancement would be based on objective statistics rather than personal experience.
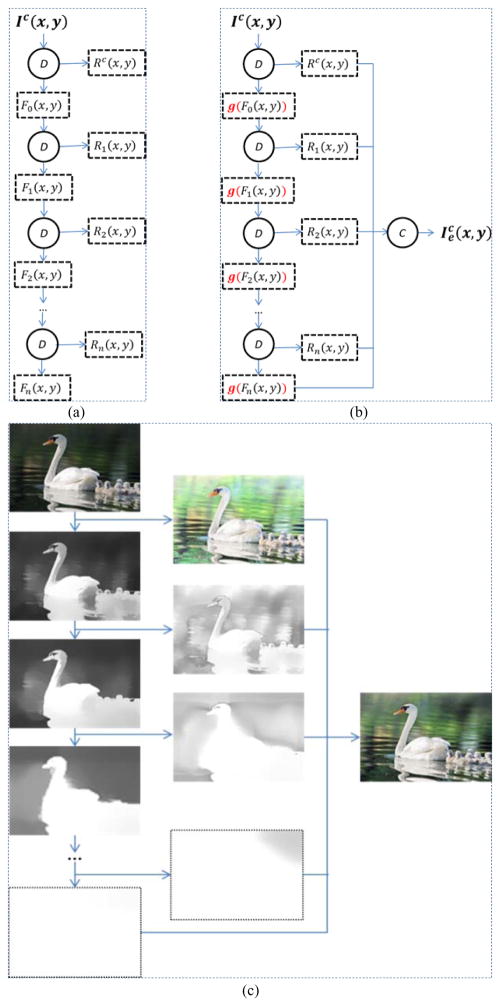
Fig. 3(a) illustrates the image decomposition process of the proposed method. Each component Fi(x, y) is further decomposed into a low-frequency component Fi+1(x, y) and a high-frequency component Ri+1(x, y). Fi+1(x, y) is computed by filtering Fi(x, y) using a low-pass filter, and Ri+1(x, y) = Fi(x, y) / Fi+1(x, y). Thus, the lightness range of the low-frequency component shrinks as i increases. If the layer number is large enough, the lightness of the last layer will be completely uniform. Each Ri(x, y) covers a unique frequency band of the original image, which can be integrated into the final enhanced image to preserve the details that otherwise may get lost.
Fig. 3.
Illustration of the multi-layer model. (a) Image decomposition process. (b) Image enhancement model. Ic(x, y) represents an original image, Fi(x, y) indicates the low-frequency component, Ri(x, y) indicates the high-frequency component, indicates the enhanced image, D indicates image decomposition, C indicates image combination, and g(·) is a mapping function. (c) An example of image decomposition and enhancement using the multi-layer model. For simplicity, the operation symbols are not presented in (c).
In our multi-layer model, an image Ic(x, y) is composed of multiple frequency bands:
| (2) |
| (3) |
where Fi(x, y) indicates the low-frequency component, Ri(x, y) indicates the high-frequency component, Fn(x, y) is the low-frequency component of the last layer, and Rc(x, y) is the high-frequency component by decomposing the original image Ic(x, y) directly. The technical details of image decomposition are given in the next section.
According to Equations (2) and (3), image enhancement can be achieved by modifying either the low- or the high-frequency components. Since the high-frequency component is more sensitive to the scene reflectance, we choose to modify the low-frequency components:
| (4) |
where g(·) is a mapping function of the low-frequency component.
Unlike other methods that process the image lightness empirically and therefore may be biased to unwanted individual’s preferences, the proposed method renders different layers using a priori multi-layer lightness statistics, which is derived from a large number of high-quality outdoor images. The lightness prior and the details of the mapping function g(·) are illustrated in sections V and VI.
In summary, the proposed method consists of three steps as Fig. 3(b) and (c) show: decomposing an image into multiple layers; modifying the low-frequency components based on the multi-layer lightness prior; combining the modified low-frequency components and the high-frequency component to get the enhanced image.
IV. Image Decomposition by the Associative Filter
NPEA uses a bright-pass filter to estimate the low-frequency component [4]. But, the bright-pass filter preserves too many fine details in the low-frequency component, because it uses global statistics to set the filter weight. In [37], an associative filter is used to calculate the dark channel, i.e., the weighted average of local minimum, and it is effective in preserving edges and removing fine details. Similarly, this paper uses the associative filter to estimate the weighted average of local maximum, i.e., the low-frequency component.
In the multi-layer decomposition model (Fig. 3(a)), Fi(x, y) is decomposed into a low-frequency component Fi+1(x, y) and a high-frequency component Ri+1(x, y), satisfying:
| (5) |
where F0(x, y) is obtained by filtering the image lightness L(x, y), which is defined as L(x, y) = maxc∈{r,g,b}Ic(x, y) [39]. Fi+1(x, y), i ≥ 0 is computed by filtering Fi(x, y). The associative filter is defined as [37]:
| (6) |
where Ω(x, y) is a 31×31 area centered at (x, y), the value of σ is empirically set to 3, and is the local maximum of Fi(x, y):
| (7) |
where Ω′(x, y) is a 15×15 area centered at (x, y), and W(x, y) is the normalized factor:
| (8) |
Each filtering operation removes more details from the low-frequency component and makes the low-frequency component smoother. That’s to say the variation of Fi+1(x, y) is less than Fi(x, y). As i increases, all pixel values of Fi(x, y) approach the maximum lightness of the image. Image decomposition is complete when the low-frequency component has no variation.
If the spatial size of the associative filter is constant, the difference between Fi+1(x, y) and Fi(x, y) may be very small after several times filtering, so that the decomposition would result in many layers. If the filter size increases with i, the computation may be intensive. In our experiment, the proposed method keeps the filter size constant, but down-samples the low-frequency image after each filtering, with the down-sampling factor empirically set to 1.25. Thus, the low-frequency image size becomes smaller and smaller during the processing. After completing the decomposition, all the low-frequency images are up-sampled to the size of the original image.
We can see that Fi(x, y) is actually the weighted average of the local maximum of the original image lightness, which implies the value of Ri(x, y) is in the interval [0,1], and the local scale increases as i increases. Thus, if the function g(·) in Equation (4) preserves the lightness inequality of Fi(x, y), our multi-layer model can easily preserve the lightness inequality between different local maxima at the same scale [4].
V. Multi-Layer Lightness Statistics of Natural Images
Natural scene statistics have been extensively studied [1], [40]. For instance, the 1/f power law shows that the amplitude spectrum of natural scenes is linear with the reciprocal of frequency: Amplitude ∝ Spatial Frequency−1.0 [27], [34]. It is also well known that the average lightness and lightness range of an image have strong correlation with image quality [3], [4], [41]. Therefore, the processing of the low-frequency component, which controls the image lightness, is essential to image enhancement. Existing enhancement methods often process the low-frequency component empirically, and thus are prone to be affected by unwanted subjective preferences. Unlike previous methods, our method renders the low-frequency component using a multi-layer lightness prior.
Our multi-layer lightness prior was derived from 1158 high-quality outdoor images. All these images have visually pleasant lightness and details, as Fig. 4 shows. We focus on two attributes of their low-frequency components, the average lightness and lightness range. Each image is decomposed into multiple layers using the associative filter defined in section IV. The layer number is empirically set to 26, because the low-frequency component often becomes completely uniform before reaching 26 filtering iterations in most cases. For each layer i, the average lightness L̄(i) and the lightness range R̄(i), are calculated as:
| (9) |
| (10) |
where N is the image number, Lp(i) = mean(Fi(x, y)) is the average lightness of the low-frequency component Fi(x, y) for the image p, and Rp(i) = max(Fi(x, y)) − min(Fi(x, y)) indicates the lightness range.
Fig. 4.
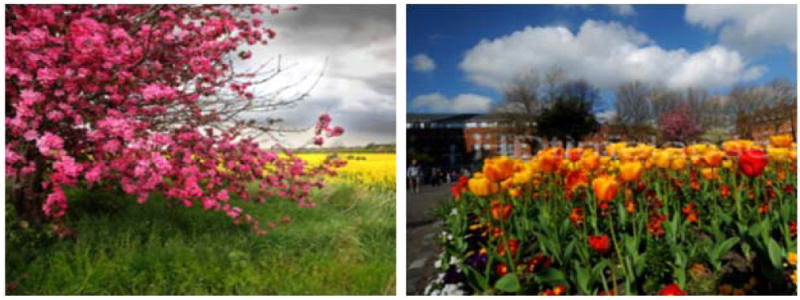
Images from our high-quality outdoor image database.
Fig. 5 shows the average lightness and the lightness range of the low-frequency components with respect to the layer for the 1158 images. The standard errors of the mean both for the average lightness and the lightness range are very small. So it is reliable to model these two attributes based on the statistics. In addition, the maximum lightness of a high-quality image is often 255, implying the maximum value of the low-frequency is 255. Thus, the interval of Fi(x, y) is [255 − R̄(i), 255].
Fig. 5.
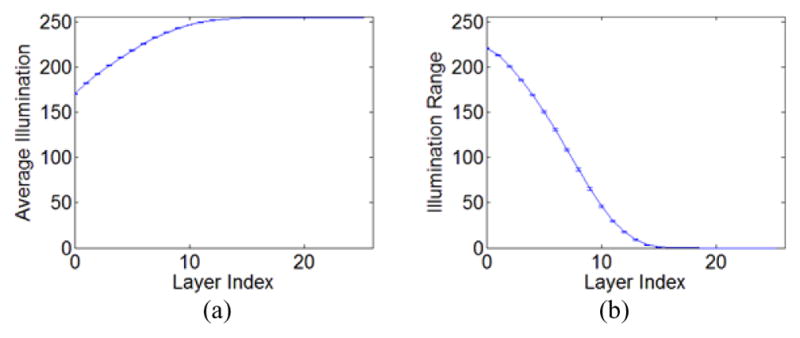
Statistics of 1158 high-quality images’ lightness attributes in different layers. (a) Average lightness. (b) Lightness range. Error bars indicate the standard error of the mean.
VI. Image Enhancement Using the Multi-Layer Lightness Statistics
According to the multi-layer lightness statistics of high-quality images, the expected interval and average of Fi(x, y) are [255 − R̄(i), 255] and L̄(i), respectively. The proposed method modifies Fi(x, y) as:
| (11) |
| (12) |
where the parameter γ is used to tune the low-frequency component to make the average lightness satisfy Equation (9), max(Gi(x, y)) and min(Gi(x, y)) indicate the maximum and minimum values of Gi(x, y), and Equation (11) maps the low-frequency interval to [255 − R̄(i), 255]. Fig. 6 shows the flowchart of the low-frequency mapping.
Fig. 6.
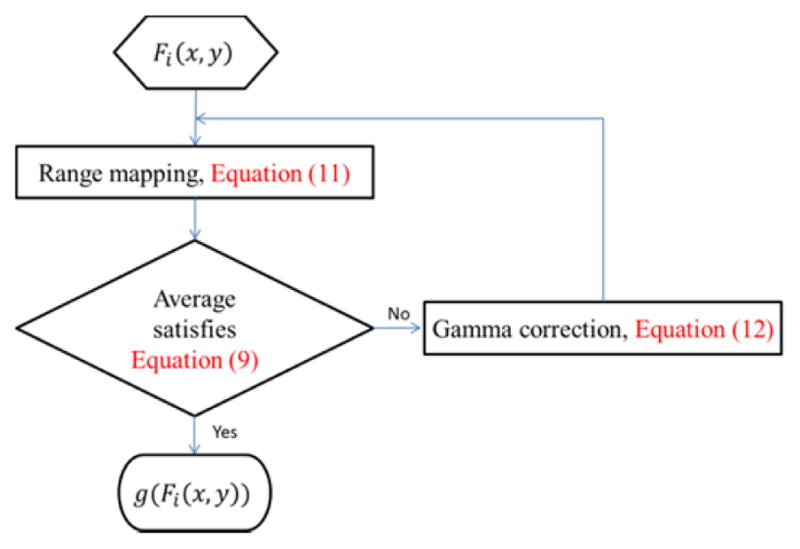
Flowchart of the low-frequency component mapping.
VII. Enhancement Performance Comparison
We compared the proposed method with four state-of-the-art methods: a naturalness preserved enhancement algorithm (NPEA) [4], a multi-scale Retinex-based method (MSR) [21], a generalized unsharp masking method (GUM) [17], and a fast hue and range preserving histogram specification method (FHRPHS) [9]. These methods were chosen because they had different characteristics and their codes were accessible. NPEA is a single-layer method and shares many similarities with NPIE-MLLS. MSR represents the multi-scale methods. GUM enhances details effectively. FHRPHS is good at preserving lightness inequality. The major parameters were set as follows. MSR: the spatial extents of the three Gaussian functions were 20, 80, and 200. GUM: the adaptive gain was utilized with the maximum gain set to 5 and the contrast enhancement factor was 0.005. The parameters of NPEA and FHRPHS were set exactly as given in their papers.
This section first makes a comprehensive comparison, and then demonstrates the performance with several representative images. All these tested images as well as the high-quality images mentioned previously are available to the public at: https://shuhangwang.wordpress.com/2016/09/02/ie.
A. Comprehensive Comparison
The comprehensive assessment was carried out on 131 non-uniformly illuminated images. We first assessed the quality of the enhanced images from three aspects, i.e., lightness inequality preservation, subjective naturalness preservation, and contrast enhancement. Then, a measure that combined naturalness preservation and contrast enhancement was designed to assess the overall image quality. Finally, we conducted a subjective study for the overall image quality assessment. Statistics analyses were conducted using SPSS 11.5. Repeated measure ANOVA was performed, followed by post hoc analysis with Bonferroni correction to compare different methods. A p-value smaller than 0.05 indicates a statistically significant difference.
Lightness inequality preservation
We used the LOE measure to assess the lightness inequality preservation. The LOE value is defined as the average number of pixel pairs, whose lightness inequality is reversed after enhancement [4].
| (13) |
where L(i, j) and Le (x, y) are the pixel lightness before and after image enhancement, m and n indicate the image height and width, U(x, y) is the unit step function, ⊕ is the exclusive-or operator.
According to the definition, the greater LOE value indicates the poorer lightness inequality preservation. The average LOE values for the five methods were 55.9 (MSR), 33.6 (GUM), 23.7 (NPEA), 9.5 (FHRPHS), and 20.9 (NPIE-MLLS). Repeated measure ANOVA revealed that these methods resulted in statistically significant difference in LOE values (F(4, 520)= 249.081, p<0.001). Post hoc tests found that the five methods were significantly different from each other (Table 1). As we can see, the histogram-based method, FHRPHS, is good at preserving the lightness inequality. The proposed NPIE-MLLS is the second best for lightness inequality preservation.
Table 1.
Post hoc tests on the LOE values for different method pairs. All paired comparisons are statistically significant.
| Method (Average) | MSR (55.9) | GUM (33.6) | NPEA (23.7) | FHRPHS (9.5) | NPIE-MLLS (20.9) |
|---|---|---|---|---|---|
| MSR (55.9) | - | p<0.001 | p<0.001 | p<0.001 | p<0.001 |
| GUM (33.6) | - | p<0.001 | p<0.001 | p<0.001 | |
| NPEA (23.7) | - | p<0.001 | p=0.014 | ||
| FHRPHS (9.5) | - | p<0.001 |
Naturalness preservation assessment
Naturalness preservation was assessed based on 24 observers’ preferences. The observers consisted of 12 males and 12 females, in the age range of 20 to 42, and their average age was 30. We explained naturalness preservation to them from three frequently mentioned aspects: 1) no serious artifact was introduced, 2) color and details were perceptually natural, and 3) lightness of the scene was pleasant [5], [6]. The observers were asked to assess the naturalness by their subjective experience and preferences.
In the assessment experiment, each enhanced image was displayed together with its original image in a random order, and observers pressed ‘Y’ or ‘N’, to indicate the enhanced image was natural or not referring to the original image. The naturalness score an observer gives to a method (NS_m) is defined as the percentage of its enhanced results the observer marks as natural. For a particular enhanced image, the naturalness score (NS_i) is defined as the percentage of observers marking it as natural.
The average naturalness scores for the five methods were 0.15 (MSR), 0.14 (GUM), 0.52 (NPEA), 0.30 (FHRPHS), and 0.67 (NPIE-MLLS). Repeated measure ANOVA revealed that these methods resulted in statistically significant difference in naturalness scores (F(4, 88)= 247.868, p<0.001). Post hoc tests found that every two methods, except MSR vs GUM, were significantly different from each other (Table 2). The images enhanced by NPIE-MLLS were rated as natural more frequently than those enhanced by the other four methods.
Table 2.
Post hoc tests on the naturalness scores for different method pairs. Bold p value indicates statistical significance.
| Method (Average) | MSR (0.15) | GUM (0.14) | NPEA (0.52) | FHRPHS (0.30) | NPIE-MLLS (0.67) |
|---|---|---|---|---|---|
| MSR (0.15) | - | p=1.000 | p<0.001 | p<0.001 | p<0.001 |
| GUM (0.14) | - | p<0.001 | p<0.001 | p<0.001 | |
| NPEA (0.52) | - | p<0.001 | p<0.001 | ||
| FHRPHS (0.30) | - | p<0.001 |
Contrast enhancement measurement
For contrast enhancement, many measures have been proposed [42]–[44]. In our experiment, we assessed the contrast of visible edges rather than the difference between pixels. Accordingly, the geometric mean of the ratios of the visibility level (GMRVL) was used to objectively assess the contrast enhancement [45].
The ratio of the visibility level is calculated by comparing the visibility level of the enhanced image to the original image. GMRVL is defined by:
| (14) |
where P is the set of visible edges in the enhanced image, n is the number of visible edges (refer to [45] for the technique to detect the visible edges), VLo and VLe are the visibility levels of the original image and enhanced image, respectively. The visibility level of a target is quantified by the coefficient:
| (15) |
where ΔLthreshold is the threshold of luminance difference at which a target becomes perceptible with a high probability, and ΔLactual is the actual luminance difference between the target and its background [45].
The average GMRVL values for the five methods were 4.1 (MSR), 4.3 (GUM), 2.4 (NPEA), 2.6 (FHRPHS), and 2.8 (NPIE-MLLS). Repeated measure ANOVA revealed that these methods resulted in statistically significant difference in GMRVL values (F(4, 520)= 244.073, p<0.001). Post hoc tests found that MSR and GUM were not significantly different, and the difference between FHRPHS and NPIE-MLLS approached to significance. Except for these two pairs, the other paired comparisons were significantly different (Table 3). The GMRVL value of the proposed method is greater than NPEA and FHRPHS, but lower than MSR and GUM. Since contrast enhancement normally works against naturalness preservation and both of them are important aspects of image enhancement, it is necessary to integrate these two factors to assess the overall image quality.
Table 3.
Post hoc tests on the GMRVL values for different method pairs. Bold p value indicates statistical significance.
| Method (Average) | MSR (4.1) | GUM (4.3) | NPEA (2.4) | FHRPHS (2.6) | NPIE-MLLS (2.8) |
|---|---|---|---|---|---|
| MSR (4.1) | - | p=0.541 | p<0.001 | p<0.001 | p<0.001 |
| GUM (4.3) | - | p<0.001 | p<0.001 | p<0.001 | |
| NPEA (2.4) | - | p=0.013 | p<0.001 | ||
| FHRPHS (2.6) | - | p=0.059 |
Combination of naturalness preservation and contrast enhancement
By sorting the enhanced images in ascending order of the GMRVL value, we define the cumulative naturalness score (CNS) with respect to the contrast of the first n images as:
| (16) |
where GMRVL(i) and NS_i(i) are the GMRVL value and the naturalness score of the ith image, respectively, the minimum image index i is 1, and we set GMRVL(0) = 0.
The CNS describes the naturalness variation with respect to the contrast enhancement. Fig. 7 shows the CNS of the enhancement methods. Ideally, the CNS should maintain upward trend when GMRVL increases. The slope of NPIE-MLLS is the largest, which means that the naturalness is best preserved given a GMRVL value. Additionally, the CNS of NPIE-MLLS is almost linear with respect to GMRVL, which implies that the naturalness is well maintained as the contrast increases, unlike the other enhancement methods, whose CNSs plateau when GMRVL reaches certain levels, i.e. images no longer look natural as the contrast increases.
Fig. 7.
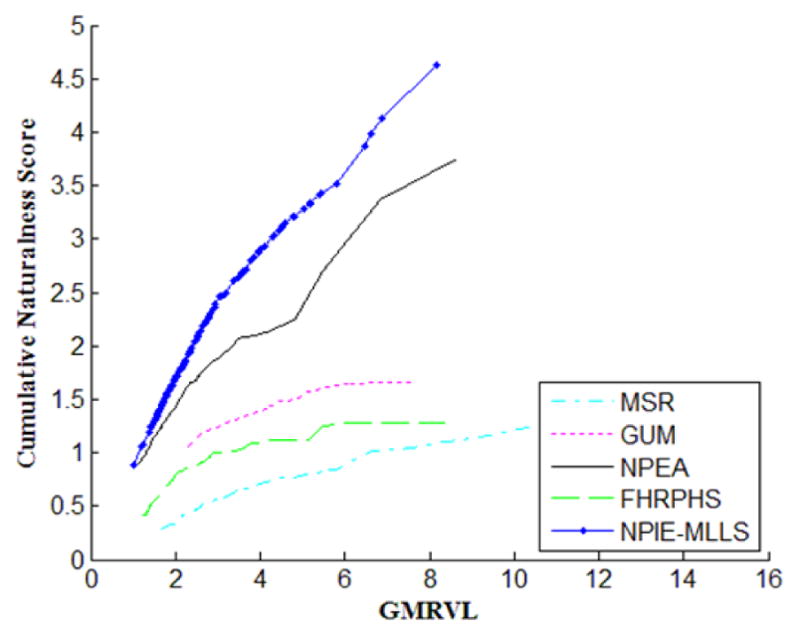
The cumulative naturalness score versus the increasing GMRVL value. NPIE-MLLS maintains upward trend as the GMRVL value increases, but MSR, GUM, and FHRPHS plateau when the GMRVL value reaches certain levels.
Subjective quality assessment
To further assess the performance of the proposed method, we carried out a subjective assessment on the overall quality of the enhanced images with another 24 observers. The observers included 10 males and 14 females, in the age range of 20 to 45, and their average age was 33. The assessment test was designed as: a pair of enhanced images were randomly selected from the five enhancement versions, and shown to an observer in each trial. For a tested image, each version was compared with all the others. The purpose of the experiment was masked to the observers by telling them those images were captured by different cameras, and they needed to select the image with better quality from the two candidates. To avoid misleading the observers, we didn’t give them any specific criterion of image quality. The subjective quality score an observer gave to a method is defined as the percentage of counts its enhanced results were preferred.
The average subjective quality scores for the five methods were 0.38 (MSR), 0.51 (GUM), 0.56 (NPEA), 0.40 (FHRPHS), and 0.64 (NPIE-MLLS). Repeated measure ANOVA revealed that these methods resulted in statistically significant difference in subjective quality scores (F(4, 92)= 20.467, p<0.001). Post hoc tests found that all the paired comparisons, except MSR vs FHRPHS and GUM vs NPEA, were significantly different (Table 4). The images enhanced by NPIE-MLLS were rated as having better quality more frequently than those enhanced by the other four methods.
Table 4.
Post hoc tests on the subjective quality scores for different method pairs. Bold p value indicates statistical significance.
| Method (Average) | MSR (0.38) | GUM (0.51) | NPEA (0.56) | FHRPHS (0.40) | NPIE-MLLS (0.64) |
|---|---|---|---|---|---|
| MSR (0.38) | - | p=0.002 | p<0.001 | p=1.000 | p<0.001 |
| GUM (0.51) | - | p=1.000 | p=0.020 | p=0.024 | |
| NPEA (0.56) | - | p=0.034 | p<0.001 | ||
| FHRPHS (0.40) | - | p<0.001 |
According to the subjective quality assessment, the rank of the five methods is: NPIE-MLLS, NPEA, GUM, FHRPHS, and MSR, which is the same as the rank according to CNS (Fig. 7). This suggests that the quality of an enhanced image can be mainly assessed from two aspects: naturalness preservation and contrast enhancement. It is certainly possible that the result could be slightly different by using different contrast enhancement measures.
B. Representative Comparison
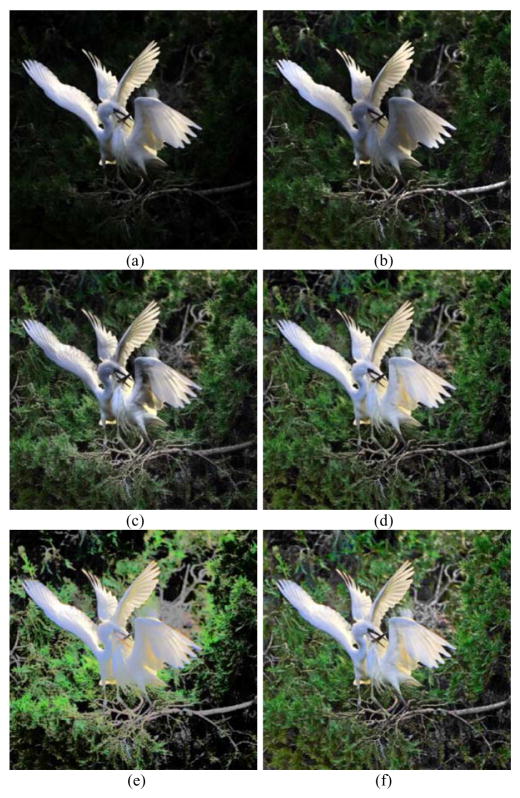
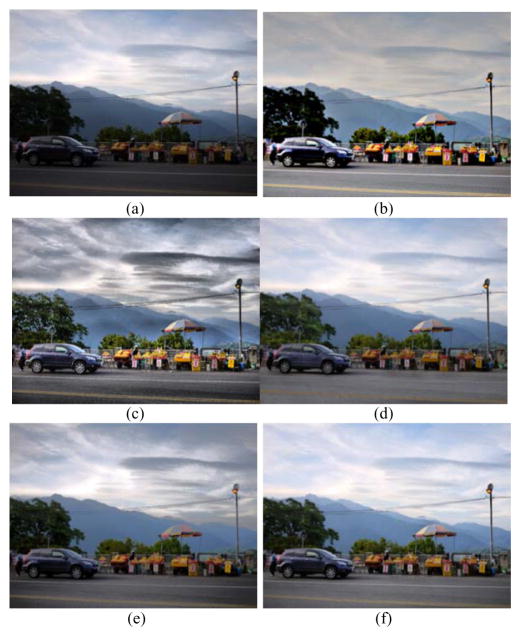
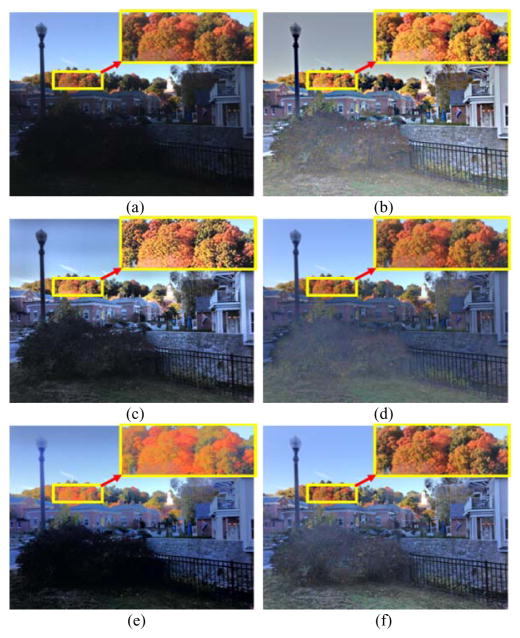
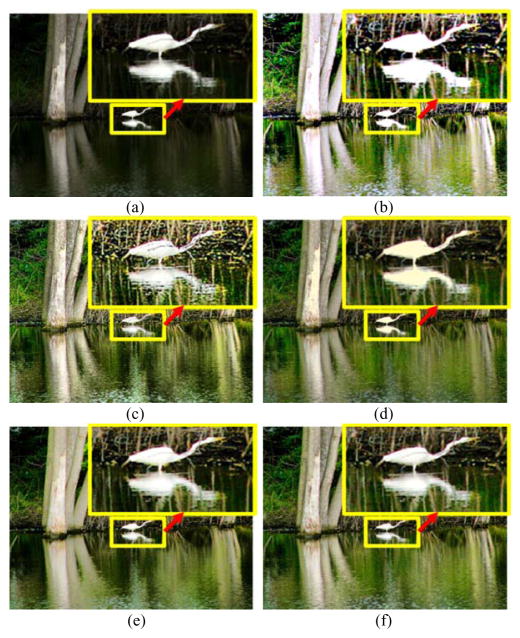
Both MSR and GUM can significantly enhance contrast, but may produce unnatural results. As Fig. 8–Fig. 12(b) show, MSR unnaturally reduces the lightness in large bright areas, such as the sky area, because MSR removes the estimated illumination. GUM is good at enhancing details of different scales, but it causes obvious over-enhancement in some areas, such as the sky area in Fig. 10(c). In comparison, the proposed method does not have these problems.
Fig. 8.
Enhancement result for Bird image. (a) Original image. (b) Enhanced image of MSR. (c) Enhanced image of GUM. (d) Enhanced image of NPEA. (e) Enhanced image of FHRPHS. (f) Enhanced image of NPIE-MLLS.
Fig. 12.
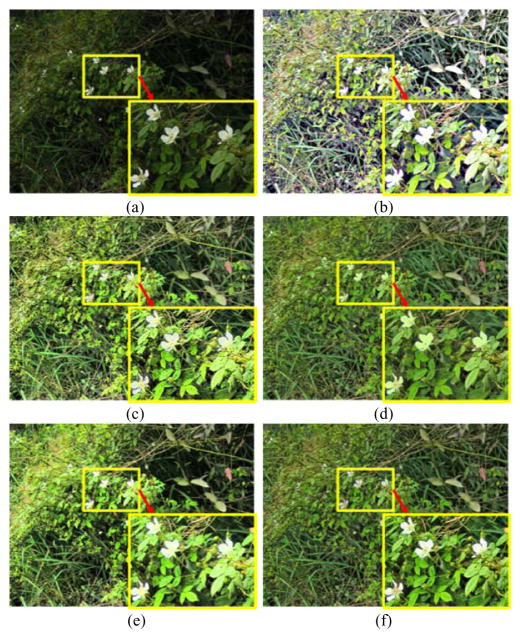
Enhancement results for Small Flowers image. (a) Original image. (b) Enhanced image of MSR. (c) Enhanced image of GUM. (d) Enhanced image of NPEA. (e) Enhanced image of FHRPHS. (f) Enhanced image of NPIE-MLLS.
Fig. 10.
Enhancement result for Lane Markers image. (a) Original image. (b) Enhanced image of MSR. (c) Enhanced image of GUM. (d) Enhanced image of NPEA. (e) Enhanced image of FHRPHS. (f) Enhanced image of NPIE-MLLS.
As a histogram-based method, FHRPHS is effective in preserving the lightness inequality between different local areas. Additionally, FHRPHS is excellent at enlarging the difference between large areas. However, it sometimes cannot enhance small areas with lightness that is much different from the background, such as the marked area and the bush in Fig. 9(e), and the marked area in Fig. 12(e). That is because it may merge similar gray levels together. Comparatively, our method is better at enhancing details of similar gray levels, as shown in Fig. 9(f) and Fig. 12(f).
Fig. 9.
Enhancement result for Autumn image. (a) Original image. (b) Enhanced image of MSR. (c) Enhanced image of GUM. (d) Enhanced image of NPEA. (e) Enhanced image of FHRPHS. (f) Enhanced image of NPIE-MLLS.
NPIE-MLLS and NPEA share many similarities. Both methods can enhance contrast and preserve the naturalness well. Comparatively, NPIE-MLLS performs better at presenting details. As Fig. 10 shows, NPIE-MLLS preserves the lane markers much better than NPEA. The details of the bush in Fig. 9 and the branch covering the bird in Fig. 11 are well preserved with NPIE-MLLS but lost with NPEA. In Fig. 12, NPIE-MLLS preserves the contrast between the white flowers and the background better than NPEA, while NPEA causes contrast loss due to compression of details remaining in the estimated illumination image.
Fig. 11.
Enhancement results for Single Bird image. (a) Original image. (b) Enhanced image of MSR. (c) Enhanced image of GUM. (d) Enhanced image of NPEA. (e) Enhanced image of FHRPHS. (f) Enhanced image of NPIE-MLLS.
In summary, compared with four state-of-the-art methods, the superior performance of the proposed method can be seen from both contrast enhancement and naturalness preservation. This was verified by the combining measure of contrast enhancement and naturalness preservation, as well as the overall subjective image quality assessment.
VIII. Discussion and Conclusion
We have proposed a multi-layer enhancement method for non-uniformly illuminated images. Unlike other enhancement methods that improve contrast empirically, the proposed method modifies multiple components of an image based on a priori multi-layer lightness statistics of high-quality outdoor images. The multi-layer model is effective in extracting details of different frequency bands, and the multi-layer lightness prior is helpful for rendering the low-frequency components. Two human observer assessment studies showed that the proposed method outperformed four other enhancement methods. The reason is probably because the proposed method was able to preserve the naturalness as well as improve the contrast, as we showed that the combination of naturalness preservation and contrast enhancement was in accordance with the overall quality rating by human observers.
The essential concept behind the proposed method is that we assume image details (reflectance) may exist in multiple frequency bands. It is unlikely for a single-layer model to extract details nicely under all different situations. Researchers, for examples, Guo et al. [24] and Fu et al. [25], usually tune their single-layer models for particular applications. Guo et al. [24] focused on low light images, and assumed the estimated illumination should be smooth, while Fu et al. [25] presented their application for daytime images, and their estimated illumination included many details. By testing a number of images, we found that Guo et al.’s method can enhance dark areas better than Fu et al.’s method, while Guo et al.’s method tends to wash out the details in the bright areas. A representative example is shown in Fig. 13. In contrast, our multi-layer model has no clear cut between illumination and reflectance, and it extracts details from different frequency bands. When more layers are used, some details of low frequency are put back to the result images. Thus, image spatial information in different frequency bands can all be preserved to certain degrees (Fig. 13(d)). The multi-layer model is analogous to bell-shaped filter, while the single-layer model is like a brick-wall filter, in terms of details extraction. In our opinion, when different spatial frequency bands are taken into consideration, the multi-layer model may have relatively less chance to fail.
Fig. 13.
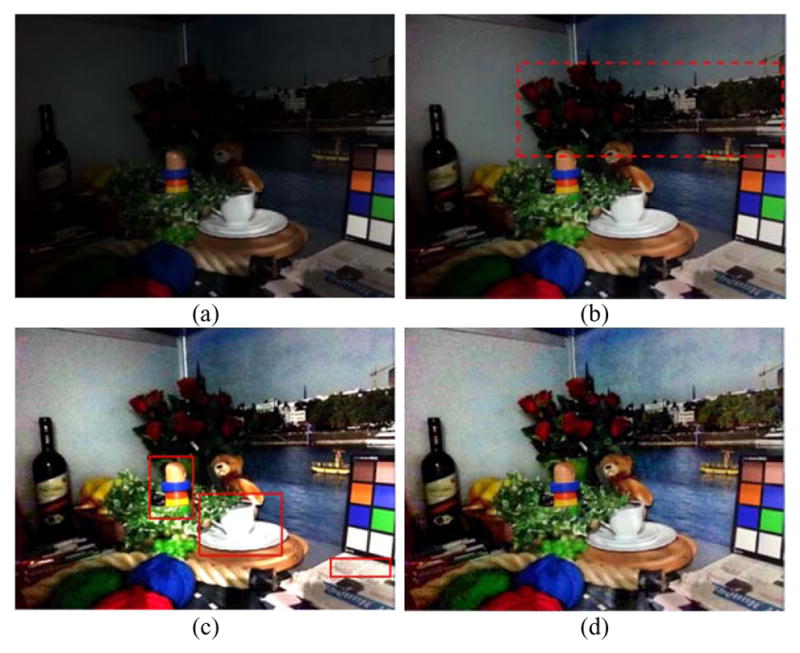
Enhancement results for indoor image. (a) Original image. (b) Enhanced image of Fu et al.’s method [25]. (c) Enhanced image of Guo et al.’s method [24]. (d) Enhanced image of NPIE-MLLS. Fu et al.’s method didn’t enhance the flowers and trees very well, while Guo et al.’s method washed out the details on the cup, the plate, and the newspaper. NPIE-MLLS appeared to handle both dark and bright areas well.
While the proposed method is designed to process outdoor images of non-uniform illumination, it has the potential to be applied to a wide variety of images, as long as the lightness statistics can be established for a given type of high-quality images. This is an area that needs further research.
The proposed multi-layer method doesn’t always perform better than all other methods. Usually that is when the range and the average value of the estimated illumination for each layer happen to be similar to the lightness statistics prior. In this case, if there is a dark area that some observers prefer to enhance (usually not very dark, otherwise the illumination range will not be similar to the high-quality image prior), the multi-layer model may appear to barely enhance the image.
The contrast measure used in this paper is just one of many contrast metrics. It will be of interest to investigate whether other contrast metrics also result in CNS consistent with overall image quality ratings. The findings may help us to understand how contrast is taken into consideration in the perception of image quality.
Acknowledgments
This work was supported by the NIH grant R01 AG041974. The authors thank A. Doherty, S. Pundlik, and the reviewers for their comments on the manuscript.
Biographies
Shuhang Wang Received the B. S. degree from Northwestern Polytechnical University (NPU), Xian, China, in 2009, and the Ph. D. degree from Beihang University, Beijing, China, in 2014. Since 2014, he has been a postdoctoral researcher at Schepens Eye Research Institute, Harvard Medical School, Boston, MA, USA. His current research interests focus on image processing, intelligent transportation, computer vision, and saccadic eye movement.

Gang Luo received his Ph.D degree from Chongqing University, China in 1997. In 2002, he finished his postdoctoral fellow training at Harvard Medical School. He is currently an Associate Professor at Harvard Medical School. His primary research interests include basic vision science, image processing, and technology related to driving assessment, driving assistance, low vision, and mobile vision care.
References
- 1.Moorthy AK, Bovik AC. Blind image quality assessment: from natural scene statistics to perceptual quality. IEEE Trans Image Process. 2011;20(12):3350–64. doi: 10.1109/TIP.2011.2147325. [DOI] [PubMed] [Google Scholar]
- 2.Yeganeh H, Wang Z. Objective quality assessment of tone-mapped images. IEEE Trans Image Process. 2013;22(2):657–667. doi: 10.1109/TIP.2012.2221725. [DOI] [PubMed] [Google Scholar]
- 3.Mante V, Frazor Ra, Bonin V, Geisler WS, Carandini M. Independence of luminance and contrast in natural scenes and in the early visual system. Nat Neurosci. 2005;8(12):1690–1697. doi: 10.1038/nn1556. [DOI] [PubMed] [Google Scholar]
- 4.Wang S, Zheng J, Hu H, Li B. Naturalness Preserved Enhancement Algorithm for Non-Uniform Illumination Images. IEEE Trans Image Process. 2013 Sep;22(9):3538–3548. doi: 10.1109/TIP.2013.2261309. [DOI] [PubMed] [Google Scholar]
- 5.Chen S, Beghdadi A. Natural enhancement of color image. Eurasip J Image Video Process. 2010;2010 [Google Scholar]
- 6.de Ridder H. Naturalness and image quality: saturation and lightness variation in color images of natural scenes. J imaging Sci Technol. 1996;40(6):487–493. [Google Scholar]
- 7.Gonzalez RC. Digital Image Processing. Upper Saddle River, N.J: Prentice Hall; 2008. [Google Scholar]
- 8.Bovik AC. Handbook of Image and Video Processing. Academic press; 2010. [Google Scholar]
- 9.Nikolova M, Steidl G. Fast hue and range preserving histogram specification: Theory and new algorithms for color image enhancement. IEEE Trans Image Process. 2014;23(9):4087–4100. doi: 10.1109/TIP.2014.2337755. [DOI] [PubMed] [Google Scholar]
- 10.Wang C, Ye Z. Brightness preserving histogram equalization with maximum entropy: A variational perspective. IEEE Trans Consum Electron. 2005;51(4):1326–1334. [Google Scholar]
- 11.Ibrahim H, Kong NSP. Brightness preserving dynamic histogram equalization for image contrast enhancement. IEEE Trans Consum Electron. 2007;53(4):1752–1758. [Google Scholar]
- 12.Marx W. Realization of the contrast limited adaptive histogram equalization (CLAHE) for real-time image enhancement. J VLSI signal Process Syst signal, image video Technol. 2004;38(1):35–44. [Google Scholar]
- 13.Sen D, Pal SK. Automatic exact histogram specification for contrast enhancement and visual system based quantitative evaluation. IEEE Trans Image Process. 2011;20(5):1211–1220. doi: 10.1109/TIP.2010.2083676. [DOI] [PubMed] [Google Scholar]
- 14.Abdullah-Al-Wadud M, Kabir M, Akber Dewan M, Chae O. A Dynamic Histogram Equalization for Image Contrast Enhancement. IEEE Trans Consum Electron. 2007;53(2):593–600. [Google Scholar]
- 15.Coltuc D, Bolon P, Chassery JM. Exact histogram specification. IEEE Trans Image Process. 2006;15(5):1143–1152. doi: 10.1109/tip.2005.864170. [DOI] [PubMed] [Google Scholar]
- 16.Arici T, Dikbas S, Altunbasak Y. A Histogram Modification Framework and Its Application for Image Contrast Enhancement. Image Process IEEE Trans. 2009;18(9):1921–1935. doi: 10.1109/TIP.2009.2021548. [DOI] [PubMed] [Google Scholar]
- 17.Deng G. A generalized unsharp masking algorithm. IEEE Trans Image Process. 2011;20(5):1249–1261. doi: 10.1109/TIP.2010.2092441. [DOI] [PubMed] [Google Scholar]
- 18.Polesel A, Ramponi G, Mathews VJ. Image enhancement via adaptive unsharp masking. IEEE Trans Image Process. 2000;9(3):505–510. doi: 10.1109/83.826787. [DOI] [PubMed] [Google Scholar]
- 19.Wang S, Zheng J, Li B. Parameter-adaptive nighttime image enhancement with multi-scale decomposition. Iet Comput Vis. 2016;10(5):425–432. [Google Scholar]
- 20.Land EH, McCann JJ. Lightness and Retinex Theory. J Opt Soc Am. 1971;61(1):1–11. doi: 10.1364/josa.61.000001. [DOI] [PubMed] [Google Scholar]
- 21.Jobson DJ, Rahman ZU, Woodell GA. A multiscale retinex for bridging the gap between color images and the human observation of scenes. IEEE Trans Image Process. 1997;6(7):965–976. doi: 10.1109/83.597272. [DOI] [PubMed] [Google Scholar]
- 22.Hines G, Rahman Z, Jobson D, Woodell G. Single-scale retinex using digital signal processors. 2005 [Google Scholar]
- 23.Liang Z, Liu W, Yao R. Contrast Enhancement by Nonlinear Diffusion Filtering. IEEE Trans Image Process. 2016;25(2):673–686. doi: 10.1109/TIP.2015.2507405. [DOI] [PubMed] [Google Scholar]
- 24.Guo X, Li Y, Ling H. LIME: Low-Light Image Enhancement via Illumination Map Estimation. IEEE Trans Image Process. 2017;26(2):982–993. doi: 10.1109/TIP.2016.2639450. [DOI] [PubMed] [Google Scholar]
- 25.Fu X, Liao Y, Zeng D, Huang Y, Zhang XP, Ding X. A probabilistic method for image enhancement with simultaneous illumination and reflectance estimation. IEEE Trans Image Process. 2015;24(12):4965–4977. doi: 10.1109/TIP.2015.2474701. [DOI] [PubMed] [Google Scholar]
- 26.Mccann J, Parraman C, Rizzi A. Reflectance, illumination, and appearance in color constancy. Front Psychol. 2014;5(January) doi: 10.3389/fpsyg.2014.00005. [DOI] [PMC free article] [PubMed] [Google Scholar]
- 27.Simoncelli EP, Olshausen Ba. Natural image statistics and neural representation. Annu Rev Neurosci. 2001;24:1193–216. doi: 10.1146/annurev.neuro.24.1.1193. [DOI] [PubMed] [Google Scholar]
- 28.Barlow H. Possible principles underlying the transformations of sensory messages. Sens Commun. 1961;6(2):57–58. [Google Scholar]
- 29.Srinivasan MV, Laughlin SB, Dubs A. Predictive coding a fresh view of inhibition in the retina. Proc R Soc London Ser B Biol Sci. 1982;216(1205):427–459. doi: 10.1098/rspb.1982.0085. [DOI] [PubMed] [Google Scholar]
- 30.Vanhateren JH. Theoretical predictions of spatiotemporal receptive fields of fly LMCs, and experimental validation. J Comp Physiol a-Sensory Neural Behav Physiol. 1992;171:157–170. [Google Scholar]
- 31.Párraga CA, Troscianko T, Tolhurst DJ. The human visual system is optimised for processing the spatial information in natural visual images. Curr Biol. 2000;10(1):35–38. doi: 10.1016/s0960-9822(99)00262-6. [DOI] [PubMed] [Google Scholar]
- 32.Field DJ. Relations between the statistics of natural images and the response properties of cortical cells. J Opt Soc Am A. 1987;4(12):2379–2394. doi: 10.1364/josaa.4.002379. [DOI] [PubMed] [Google Scholar]
- 33.Dyakova O, Lee Y-J, Longden KD, Kiselev VG, Nordström K. A higher order visual neuron tuned to the spatial amplitude spectra of natural scenes. Nat Commun. 2015;6(May):8522. doi: 10.1038/ncomms9522. [DOI] [PMC free article] [PubMed] [Google Scholar]
- 34.Tolhurst DJ, Tadmor Y, Chao T. Amplitude spectra of natural images. Ophthalmic Physiol Opt. 1992;12(2):229–32. doi: 10.1111/j.1475-1313.1992.tb00296.x. [DOI] [PubMed] [Google Scholar]
- 35.Van Hateren JH. Spatiotemporal contrast sensitivity of early vision. Vision Res. 1993;33(2):257–267. doi: 10.1016/0042-6989(93)90163-q. [DOI] [PubMed] [Google Scholar]
- 36.Bex PJ, Makous W. Spatial frequency, phase, and the contrast of natural images. J Opt Soc Am A-Optics Image Sci Vis. 2002;19(6):1096–1106. doi: 10.1364/josaa.19.001096. [DOI] [PubMed] [Google Scholar]
- 37.Li B, Wang S, Zheng J, Zheng L. Single image haze removal using content-adaptive dark channel and post enhancement. IET Comput Vis. 2013;8(2):131–140. [Google Scholar]
- 38.Peli E. Contrast in complex images. J Opt Soc Am A. 1990;7(10):2032–2040. doi: 10.1364/josaa.7.002032. [DOI] [PubMed] [Google Scholar]
- 39.Smith AR. Color gamut transform pairs. ACM SIGGRAPH Comput Graph. 1978;12(3):12–19. [Google Scholar]
- 40.Saad MA, Bovik AC, Charrier C. Blind image quality assessment: A natural scene statistics approach in the DCT domain. IEEE Trans Image Process. 2012;21(8):3339–3352. doi: 10.1109/TIP.2012.2191563. [DOI] [PubMed] [Google Scholar]
- 41.Li B, Wang S, Geng Y. Image enhancement based on Retinex and lightness decomposition. 2011 18th IEEE International Conference on Image Processing; 2011. pp. 3417–3420. [Google Scholar]
- 42.Brady N, Field DJ. Local contrast in natural images: Normalisation and coding efficiency. Perception. 2000;29(9):1041–1055. doi: 10.1068/p2996. [DOI] [PubMed] [Google Scholar]
- 43.Majumder A, Irani S. Perception-based contrast enhancement of images. ACM Trans Appl Percept. 2007;4(3):17-es. [Google Scholar]
- 44.Wang S, Ma K, Member S, Yeganeh H. A Patch-Structure Representation Method for Quality Assessment of Contrast Changed Images. IEEE Signal Process Lett. 2015;22(12):2387–2390. [Google Scholar]
- 45.Hautière N, Tarel JP, Aubert D, Dumont É. Blind Contrast Enhancement Assessment By Gradient Ratioing At Visible Edges. Image Anal Stereol. 2008;27(2):87–95. [Google Scholar]


