Abstract
The study aimed to seek potential biomarkers for acute myocardial infarction (AMI) detection and treatment.
The dataset GSE48060 was used, consisting of 52 peripheral blood samples (31 AMI samples and 21 normal controls). By limma package, differentially expressed genes (DEGs) between 2 kinds of samples were identified, followed by enrichment analysis, subpathway analysis, protein–protein interaction (PPI) network analysis, and transcription factor network (TFN) analysis. Weighted gene co-expression network analysis was used to further extract key modules relating to AMI, followed by enrichment and TFN analyses. Expression validation was performed via meta-analysis of 2 datasets, GSE22229 and GSE29111.
A set of 428 DEGs in AMI were screened out, and the upregulated toll-like receptor (TLR) family genes (TLR1, TLR2, and TLR10) were enriched in wound response, immune response and inflammatory response functions, and downregulated genes (GBP5, CXCL5, GZMA, CCL5, and CCL4) were correlated with immune response. CCL5, GZMA, GZMB, TLR2, and formyl peptide receptor 1 (FPR1) were predicted as crucial nodes in the PPI network. Signal transducer and activator of transcription 1 (STAT1) was the key transcription factor (TF) with multiple targets. The grey module was highly related to AMI. Genes in this module were closely related to regulation of macrophage activation, and spermatogenic leucine zipper 1 (SPZ1) was identified as a TF. Expressions of TLR2 and FPR1 were confirmed via the integrated matrix.
Several potential biomarkers for AMI detection were identified, such as GZMB, GBP5, FPR1, TLR2, STAT1, and SPZ1. They might exert their functions via regulation of immune and inflammation responses. Genes in grey module play significant roles in AMI via regulation of macrophage activation.
Keywords: acute myocardial infarction, differentially expressed genes, inflammation response, macrophage activation, weighted gene co-expression network analysis
1. Introduction
Acute myocardial infarction (AMI) is a major cause for death in the world.[1] Although the incidence of myocardial infarction (MI) has a decreased trend between 1997 and 2008 in the United State,[2] approximate 155,000 new asymptomatic silent cases occur annually,[3] and in developing countries, AMI is still a significant health burden.[4] Many advanced approaches have been developed for the management of patients with AMI, such as pharmacological reperfusion therapy and catheter-based interventions. However, AMI remains a major problem worldwide.[5]
Early detection of AMI contributes to early treatment interventions, which can significantly reduce the mortality rate.[6] Many studies have been conducted to seek potential molecular biomarkers for AMI detection. As expected, several genes and proteins such as monocyte-platelet aggregates, heart fatty acid–binding protein, and troponin I have been established as potent markers for AMI diagnosis.[6–8] Moreover, substantial miRNAs have been proposed as crucial markers for management of AMI, such as circulating miR-1, miR-19a, miR-208a (cardiac-specific), and miR-499.[9–12] However, interactions between these molecules and the potentially altered functions and pathways are rarely reported. The pathogenic mechanisms of AMI pathogenesis remain obscure. Suresh et al[13] establish a gene expression profiling by microarray, and compare the differentially expression genes (DEGs) between AMI samples and normal samples, and the dysregulated pathways of these DEGs. However, they only focus on the pathways and recurrent events. The regulatory correlations between these genes are not further investigated. Thus, a recent study by Gao et al[14] reanalyzes this GSE48060 microarray data, and performs protein–protein interaction (PPI) network analysis and transcription factor network (TFN) analysis after identifying DEGs in AMI samples. Although they predict several crucial genes in AMI progression, such as CCL5, BCL3, and NCOA7, the subpathway analysis and coexpression network analysis are not involved.
Weighted Gene Co-expression Network Analysis (WGCNA) is a useful approach that has been widely used for gene expressions to identify key disease-related modules.[15] For instance, using WGCNA, Saris et al[16] select two large co-expressed modules that related to amyotrophic lateral sclerosis. By estimating gene expression patterns, Azuaje et al[17] identify a WGCN in MI, which is used to determine the potential role of Col5a2 and its transcriptional pattern. Therefore, we reanalyzed Suresh's microarray data, GSE48060, and carried out WGCNA for gene expressions, in addition to enrichment analysis, PPI network analysis, and TFN analysis of the DEGs. Moreover, in the aspects of the DEG screening, we applied more rigorous criteria with fold change (FC) >1.2 and P < 0.05, compared with Gao et al[14] with P < 0.01. Furthermore, we performed expression validation of DEGs by using other databases, which could powerfully verify our results from other experimental data. We aimed to reveal molecular underpinnings in AMI development and provide novel biomarkers for the AMI detection and treatment.
2. Methods
2.1. Data resource
The dataset GSE48060,[13] which consisted of 52 microarray expression profiles, was downloaded from the Gene Expression Omnibus (GEO, http://www.ncbi. nlm.nih.gov/geo) database. The gene expression data were derived from the peripheral blood tissues of 31 first-time AMI patients within 48 hours after MI with (n = 5) or without (n = 26) recurrent events (AMI samples) and 21 normal cardiac function controls (control samples). The platform of the dataset was GPL570 (HG-U133_Plus_2, Affymetrix Human Genome U133). The samples were recruited from the Mayo Clinic Rochester echocardiography laboratory, and all participants signed informed consent approved by the Mayo Clinic Rochester Institutional Review Board.
2.2. Data pretreatment and differentially expressed genes selection
Firstly, the series matrix profile that has been undergone pretreatments such as background correction, quantile normalization, and probe summarization was downloaded. Then, the probes did not correspond to gene symbols were eliminated. When multiple probes corresponded to 1 gene symbol, the expression value of gene was adopted to their mean expression values. Thereafter, the Linear Models for Microarray Analysis (limma, http://www.bioconductor.org/packages/3.0/bioc/html/limma.html) package of R was used to identify DEGs between AMI and control samples.[18] The thresholds for DEG screening were the FC > 1.2 (|log2 FC| > 0.263) and P < .05.
2.3. Functional and pathway enrichment analyses, protein–protein interaction network analysis and transcription factors identification
Based on the Database for Annotation, Visualization and Integration Discovery (DAVID, http://david.abcc.Ncifcrf.gov/) online tool,[19] functional and pathway enrichment analyses for the DEGs were conducted. The significant analysis of the enriched go terms and pathways were conducted by using hypergeometric test. The cut-off value for functional enrichment analysis was P < .05, and that for pathway enrichment analysis was adjusted P < .05.
Combining information in the Search Tool for the Retrieval of Interacting Genes (STRING, http://string-db.org/) database with DEG expressions, we explored potential interactions of these DEGs at protein level.[20] PPI score was set as 0.4 to construct a PPI network, which was then visualized by the Cytoscape (http://cytoscape.org/) software.[21] In the network, a node represents a protein encoded by corresponding DEG, and the degree of a node is deemed as the number of interactions with other DEGs. A node with high degree serves as a hub gene in the PPI network.
The Human Transcription Regulation Interaction (HTRI, http://www.lbbc.ibb.unesp.br/htri) is an open-access database that contains experimentally validated human transcriptional interactions.[22] Based on information in HTRI database, we screened out TFs amongst these DEGs, and identified their downstream targets to build the TF-target regulatory network.
2.4. Subpathway analysis
To further elucidate potential pathways of the DEGs, subpathway analysis was carried out for up- and downregulated DEGs, respectively, using the isubpathwayMiner package in R.[23] The cut-off value for significant subpathway was P < .05.
2.5. Construction of weighted gene co-expression network
WGCNA has been widely applied to establish a scale-free network from gene expression data.[24] The WGCNA package in R (http://www.inside-r.org/packages/cran/WGCNA/docs/bicor) was used to construct this network, and to get more genes for WGCNA analysis, the genes with the looser threshold value of P < .05 from results of difference expression analysis between AMI samples and normal samples in GSE48060 were selected. There were 3 steps to construct the WGCNA network: definition of the gene co-expression matrix. In brief, the Pearson correlation coefficient (CC) was calculated for all gene interactions. The correlation between 2 genes, m and n, was deemed as Smn = |cor(m,n)|, based on which the gene co-expressed matrix was built as S = [Smn]; definition of adjacent function. The adjacency coefficient amn was used to determine the correlations of gene interactions, based on the function amn = power (Smn, β)=|Smn|β; determination of parameter in the adjacent function. The weighting coefficient β was determined according to the scale-free principle. Herein, i represents numbers of nodes, and p(i) represents the probability of a node. For WGCNA network construction, it was required that the CC between log (i) and log [p(i)] was at least 0.8.
After the network establishment, the hierarchical average linkage clustering was used to divide different gene co-expression modules.[25] Then the correlations between genes in a module and a disease were recognized according to the following methods:P value of a DEG between 2 kinds of samples was calculated; the log P was defined as the gene significance (GS), and the average GS in a module was deemed as module significance (MS). Commonly, a module with a higher MS indicates a greater possibility to be associated with the disease.
2.6. Expression validation of differentially expressed genes via other datasets
The expression data of 9 blood tissue samples from healthy individuals in the expression dataset GSE22229 (http://www.ncbi.nlm.nih.gov/geo/query/acc.cgi?acc=GSE22229) and 36 blood tissue samples from patients with AMI in the dataset GSE29111 (http://www.ncbi.nlm.nih.gov/geo/query/acc.cgi?acc=GSE29111) were downloaded from the GEO database. The platforms of the 2 datasets were both GPL570 (HG-U133_Plus_2, Affymetrix Human Genome U133).
CONOR package in R, which is available through the CRAN repository (https://cran.r-project.org/web/packages/),[26] was used to perform meta-analysis for the 2 datasets. Then data were normalized using median method, and an integrated expression matrix was obtained as the validation data. Next, limma package was used to select the DEGs between 2 kinds of samples, with the same criteria as aforementioned (|log2 FC| > 0.263 and P < .05). We checked whether DEGs identified in GSE48060 were also differentially expressed in this integrated expression matrix.
3. Results
3.1. Identification of differentially expressed genes between acute myocardial infarction and normal samples
Based on the aforementioned criteria, we obtained a total of 428 DEGs, including 160 upregulated and 268 downregulated genes. Heat map of clustering analysis of gene expression was listed in Figure 1, in which these DEGs could well distinguish the 2 kinds of samples, indicating the DEGs could be used for further analysis.
Figure 1.
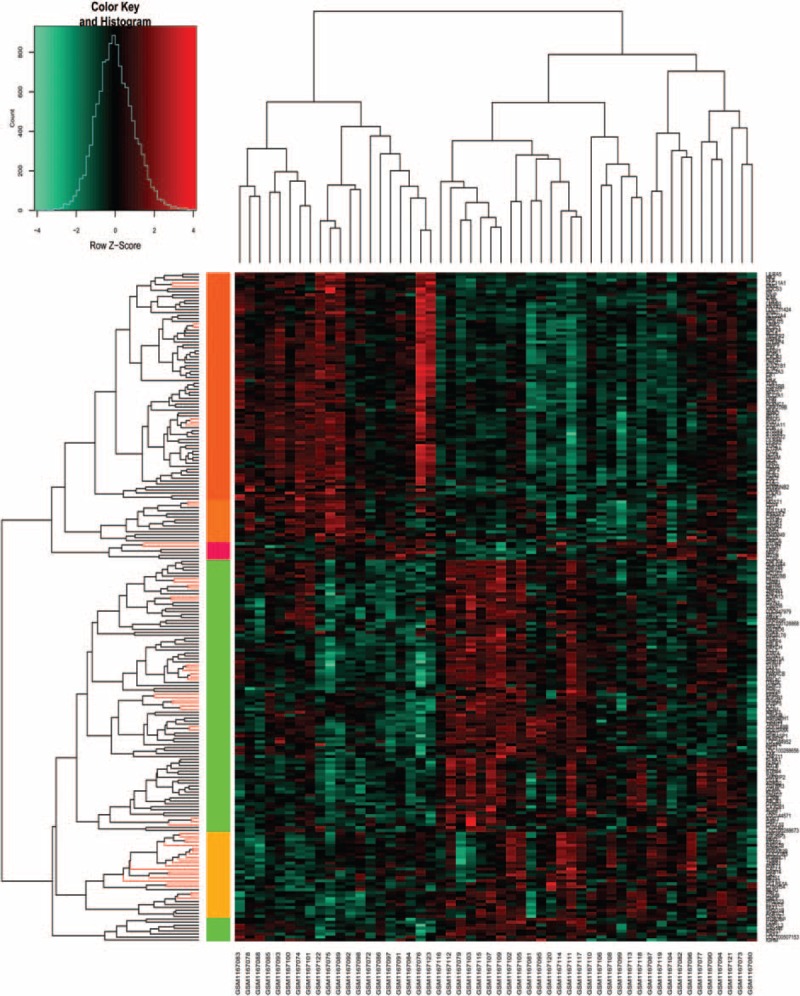
Heat map of clustering analysis of the gene expressions. X-axis represents the names of each sample in dataset GSE48060, and Y-axis represents the clusters of genes. The color toward red represents high expression values, and color toward green represents lower expression values.
3.2. Enrichment and subpathway results
As a result, we found that the upregulated genes were mainly associated with functions such as response to wounding [e.g., toll-like receptor 10 (TLR10), CR1, and TLR2), immune response (e.g., IL1R2, TLR10, and TLR2), and inflammatory response (e.g., TLR10, TLR1, and TLR2). Although the downregulated genes were significantly enriched in immune response (e.g., GBP5, CXCL5, and GZMA), cellular defense response (e.g., KLRC3, CX3CR1, and CCL5), and defense response (e.g., IL15, CCL5, and CCL4) functions (Table 1). In addition, pathways analysis for all the DEGs were significantly associated with IL12-mediated signaling events (e.g., CCL4, GZMA, and GZMB), endogenous TLR signaling (e.g., CD14, TLR1, and TLR2), interferon gamma signaling (e.g., FCGR1B, GBP1, and GBP3), and cytokine–cytokine receptor interaction (e.g., CCL4, CCL5, and CSF2RB) related pathways (Table 2).
Table 1.
Significant function of the differentially expressed genes (top 5).

Table 2.
Significant pathways of the differentially expressed genes.

Moreover, 32 subpathways in the 8 pathways were identified for upregulated DEGs, such as starch and sucrose metabolism (e.g., HK3, PYGL, and MGAM), pantothenate and CoA biosynthesis (e.g., VNN2 and VNN1), and pentose phosphate pathway (e.g., PGD and TKT). For the downregulated DEGs, only 1 subpathway as retinol metabolism was identified (ALDH1A1) (Table 3).
Table 3.
Subpathway analysis results (partly).

3.3. Protein–protein interaction network
According to the STRING database, a PPI network of the DEGs was constructed, containing 205 nodes and 590 interactions. In the network, formyl peptide receptor 1 (FPR1) (degree = 34), CCL5 (degree = 32), GZMA (degree = 32), TLR2 (degree = 31), and GZMB (degree = 30) were the highlighted nodes (Fig. 2).
Figure 2.
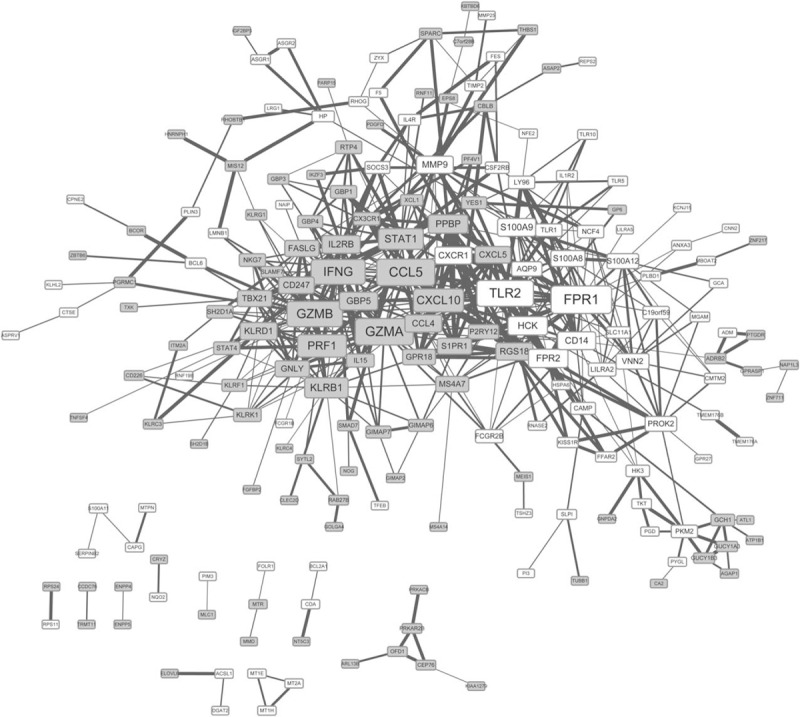
Protein–protein interaction network of the DEGs. The nodes denote the protein product of DEGs, and the lines between 2 proteins denote their correlations. In addition, the grey square-shaped nodes represent downregulated proteins of DEGs, and the white square-shaped nodes represent upregulated proteins of DEGs. The size of each node indicates the number of the interactions with other DEGs, and the boldness of the line is directly proportional to combined score between the proteins. DEG = differentially expressed gene.
3.4. Transcription factors and the corresponding targets
Based on HTRI database, a total of 6 TFs that regulated 42 downstream targets were searched. Among them, signal transducer and activator of transcription 1 (STAT1) was the predominant one with multiple targets (Fig. 3).
Figure 3.
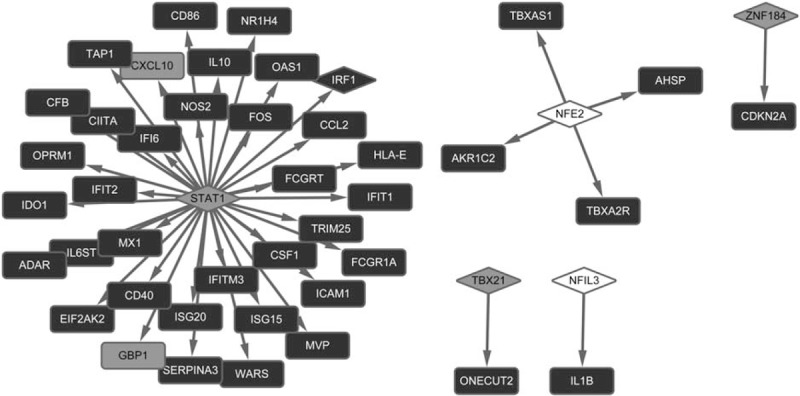
Transcription factor-target regulatory network. Square shape represents target and rhombus represents transcription factors. Arrows between them predict their correlations. In addition, the grey square shape indicates the downregulated gene, and the white square shape indicates the upregulated gene, whereas the black square shape indicates gene with no differential expression.
3.5. Weighted gene co-expression network analysis network and key module selection
A set of 2892 genes (P < .05) from results of difference expression analysis between AMI samples and normal samples in GSE48060 were screened out to establish the WGCNA network. As revealed in the hierarchical clustering tree, there identified a total of 13 modules (Fig. 4), and their correlations with AMI was listed in Table 4. As a result, the grey module has the highest correlation with AMI (CC = 0.88). Therefore, we further analyzed genes in this module, and found that they were significantly related to functions such as multicellular organismal response to stress, regulation of macrophage activation, and spinal cord motor neuron differentiation (Table 5). In addition, spermatogenic leucine zipper 1 (SPZ1) was identified as only 1 TF in the grey module.
Figure 4.
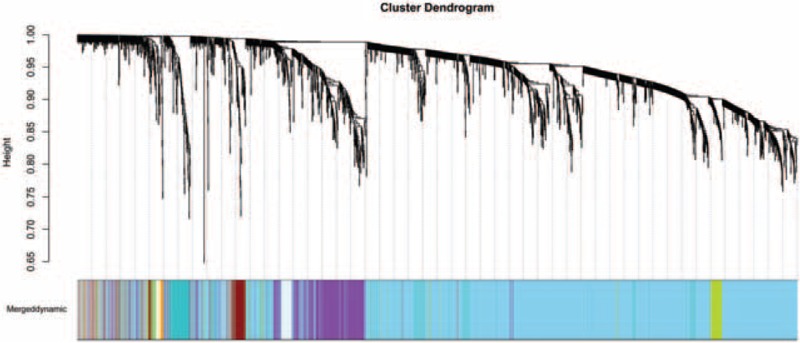
Branches of the cluster dendrogram of the most connected genes in 13 modules. A line in the cluster dendrogram represents one gene, and the height in Y-axis indicates the distance between two genes. Different colors represent different modules.
Table 4.
Correlations between each module and acute myocardial infaction.
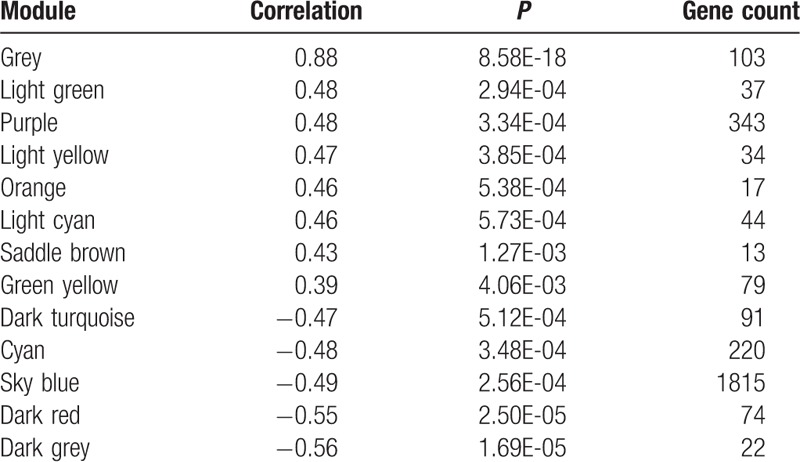
Table 5.
Significant pathways of genes in the grey module.

3.6. Expression validation of differentially expressed genes by other datasets
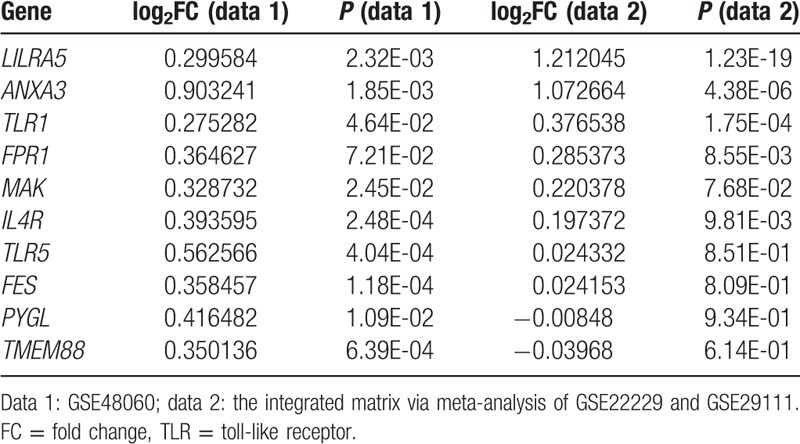
As a result, there identified a total of 6249 DEGs from the validation dataset (GSE22229 and GSE29111), including 3409 upregulated and 2840 downregulated genes. Compared with DEGs in the dataset of GSE48060, we found 147 overlapped DEGs, including 53 upregulated and 10 downregulated genes, were both in the GSE48060 dataset and validation dataset. Especially, we focused on the expression of several genes which were predicted as important nodes in the PPI network, such as FPR1, CCL5, GZMA, TLR2, and GZMB. Interestingly, we found that FPR1 and TLR2 both belonged to the overlapped DEGs (Table 6).
Table 6.
Overlapped differentially expressed genes in GSE48060 and the integrated matrix.
4. Discussion
Via a series of bioinformatics methods, we identified a total of 428 DEGs in AMI, which were mainly enriched in IL12-mediated signaling events (e.g., GZMA and GZMB), endogenous TLR signaling (e.g., TLR1 and TLR2) and cytokine–cytokine receptor interaction (e.g., CCL4 and CCL5)-related pathways. Upregulated TLR family genes (TLR1, TLR2, and TLR10) were significantly associated with wound response, immune response and inflammatory response functions, and downregulated genes (GBP5, CXCL5, GZMA, CCL5, and CCL4) were also correlated with immune response. CCL5, GZMA, GZMB, FPR1, and TLR2 were predicted as crucial nodes in the PPI network. STAT1 was the key TF with multiple targets. By WGCNA, we found the grey module was highly related to AMI, and genes in this module were closely related to regulation of macrophage activation. In addition, SPZ1 was identified as a TF in the grey module. Notably, FPR1 and TLR2 as DEGs in AMI samples were validated in other datasets.
The Granzyme 2, Cytotoxic T-Lymphocyte-Associated Serine Esterase 1 (GZMB) encoded protein is an activate enzyme of caspases, which are involved in the signaling pathways of necrosis and inflammation. Reportedly, GZMB is one of the DEGs enriched in the IL12-mediated signaling events pathway, in the comparison of inflammatory with noninflammatory synovial biopsies.[27] SOCS3 is a vital protein that regulates the immediate response to cytokines. Through the inhibition of IL12-mediated signaling, SOCS3 plays an important role in Th2 development.[28]CCL5 is one of the chemokine genes involved in inflammatory process.[29]GBP5 is an activator of NLRP3 inflammasome assembly that has significant roles in inflammation.[30] In our present study, we found that GZMB, GBP5, and CCL5 were linked in the PPI network, and GZMB was enriched in IL12-mediated signaling events pathway, whereas GBP5 and CCL5 in immune response. Inflammation reaction is an important reaction of immune system,[31] and immune response is often accompanied by inflammation response during the disease progression. Thus, we speculated that IL12-mediated signaling events pathway might associate with inflammation to cause AMI development, and the above 3 genes might work together in regulating these function and pathways.
The protein encoded by TLR2 is a member of TLR family which has a critical role in activating innate immunity. AMI is reported to have close relationship with increased expression of TLR2.[32] During AMI, the high-mobility group box 1 protein can induce myocardial repair, and it can activate NF-κB signaling pathway through the receptors such as TLR2/4/9.[33] A study suggests that sTLR2 might involve in the innate immunity response in pathogenesis of heart failure after AMI.[34] The inflammatory response is reduced by the activation of TLR, and this may badly influence the reperfusion therapy of MI. Arslan et al[35] find that TLR2 regulates myocardial ischemia, and anti-TLR2 antibody causes a pronounced reduction of leukocyte influx and cytokine production. In our study, we discovered TLR family genes (TLR2, TLR10, and TLR1) were crucial DEGs in AMI that enriched in immune response and inflammatory response, suggesting these genes might be closely associated with development of AMI, via involvement of these responses. Moreover, TLR2 was predicted as a hub node in the PPI network. Notably, differential expression of TLR2 in AMI samples was validated by integrating analysis another 2 datasets, and this provided potent evidence that it is an important gene for AMI management and could be used as a therapeutic target.
The FPR1 is one of the FPRs that participant in inflammation reaction. Reportedly, it can protect against myocardial ischemia-reperfusion.[36] In adult rat cardiomyocytes, it is found activation of FPR1 contributes to the Ac-ANX-A12–26 cardioprotective actions.[37] Notably, FPR1 is also identified as a DEG in human AMI blood tissue, compared with normal blood tissue using microarray data.[38] In addition, activation of FPR2, the family member of FPR1, is involved in cardiac repair after MI via mobilization of circulating angiogenic cells.[39] Therefore, the deregulated expression of FPRs might account for the occurrence of AMI. In our study, FPR1 was predicted as a crucial node in the PPI network. More importantly, its altered expression was validated by integrating analysis another 2 datasets, which further confirmed our prediction that it was an important gene for AMI prevention.
Activation of the transcription STAT1 is elevated in primary cardiac myocytes under exposure of simulated ischemia. Deficiency of STAT1 exerts a protective function against MI through the control of autophagy.[40] Absent in melanoma 2 (AIM2) is a protein involved in inflammatory regulation. Reportedly, AIM2 limits the transcription of proinflammatory cytokine in cardiomyocytes via inhibition of STAT1 phosphorylation.[41] In the present study, STAT1 was identified as a critical TF that targeted multiples genes, suggesting its central role in AMI pathology.
Macrophages take part in the progression of various inflammatory-related diseases. The inhibitor of COX-2, whose expression is elevated by macrophage under exposure to proinflammatory stimuli, can increase risk of AMI in patients without cardiovascular risk factors.[42] In mice, deletion of matrix metalloproteinase-28 inhibit M2 macrophage activation, and may aggravate left ventricle dysfunction and rupture after MI.[43] Our findings by WGCNA indicated that the grey module was highly related to AMI and genes in this module were significantly enriched in regulation of macrophage activation, suggesting genes in this module were highly related to AMI, via regulation of macrophage activation.
SPZ1, a bHLH-zip TF, acts as a downstream gene of mitogen-activated protein kinase (MAPKs) and is important in MAPKs signaling pathway via phosphorylated by MAPK1/ERK2 and MAPK3/ERK1.[44] Reportedly, brain MAPK1/ERK2 signaling pathways are activated in AMI rats.[45] In our result, SPZ1 was only 1 TF with significant P value in the grey module and we predicted this is a novel TF might be related to AMI due to no direct relationships between its expression alteration and AMI has been reported.
Despite these valuable findings, there remains a limitation that we did not perform experimental validations in vitro. However, we should note that the sample collections are very hard because they are from blood tissues in patients with AMI. The eligible samples from patients with AMI would be collected in our future studies as much as possible.
Our findings provide important values in prediction of molecular events related to AMI as well as potential biomarkers for detection and prevention. However, the results need to be validated by substantial experiments, as well as the performance of those potential biomarkers such as sensitivity, superiority to the current, cost, and convenience should also be analyzed in our future study. In addition, in our future study, prediction of miRNAs that regulate the DEGs in PPI network, as well as submodule analysis and transcriptional regulatory network construction for the genes in the grey module are still needed to potentially provide a more comprehensive insight into AMI.
In conclusion, several novel potential biomarkers for AMI detection were identified, such as GZMB, GBP5, TLR2, FPR1, STAT1, and SPZ1. They might exert their functions via regulation of immune and inflammation responses. The grey module was most related to AMI, and genes in this module play significant roles via regulation of macrophage activation. However, future experimental verification is still needed to confirm those speculations.
Footnotes
Abbreviations: AIM2 = absent in melanoma 2, AMI = acute myocardial infarction, CC = correlation coefficient, DEGs = differentially expressed genes, FC = fold change, FPR1 = formyl peptide receptor 1, GEO = Gene Expression Omnibus, GS = gene significance, HTRI = Human Transcription Regulation Interaction, MPA = monocyte-platelet aggregates, MS = module significance, PPI = protein–protein interaction, SPZ1 = spermatogenic leucine zipper 1, STAT1 = signal transducer and activator of transcription 1, TFN = transcription factor network, TLR2 = toll-like receptor 2, WGCNA = weighted gene co-expression network analysis.
SZ participated in the conception and design of the research. WL and XL carried out acquisition of data, analysis, and interpretation of data. JQ performed the statistical analysis. CD drafted the manuscript. SZ revised manuscript for important intellectual content. All authors read and approved the final manuscript.
The authors report no conflicts of interest.
References
- [1].Wang Y, Zhang H, Chai F, et al. The effects of escitalopram on myocardial apoptosis and the expression of Bax and Bcl-2 during myocardial ischemia/reperfusion in a model of rats with depression. BMC Psychiatry 2014;14:349. [DOI] [PMC free article] [PubMed] [Google Scholar]
- [2].Rosamond WD, Chambless LE, Heiss G, et al. Twenty-two–year trends in incidence of myocardial infarction, coronary heart disease mortality, and case fatality in 4 US communities, 1987–2008. Circulation 2012;125:1848–57. [DOI] [PMC free article] [PubMed] [Google Scholar]
- [3].Zhang ZM, Rautaharju PM, Prineas RJ, et al. Race and sex differences in the incidence and prognostic significance of Silent myocardial infarction in the atherosclerosis risk in communities (ARIC) study. Circulation 2016;133:2141–8. [DOI] [PMC free article] [PubMed] [Google Scholar]
- [4].Bansal N, Fischbacher CM, Bhopal RS, et al. Myocardial infarction incidence and survival by ethnic group: Scottish Health and Ethnicity Linkage retrospective cohort study. BMJ Open 2013;3:e003415. [DOI] [PMC free article] [PubMed] [Google Scholar]
- [5].Boersma E, Mercado N, Poldermans D, et al. Acute myocardial infarction. Lancet 2003;361:847–58. [DOI] [PubMed] [Google Scholar]
- [6].Furman MI, Barnard MR, Krueger LA, et al. Circulating monocyte-platelet aggregates are an early marker of acute myocardial infarction. J Am Coll Cardiol 2001;38:1002–6. [DOI] [PubMed] [Google Scholar]
- [7].Keller T, Zeller T, Peetz D, et al. Sensitive troponin I assay in early diagnosis of acute myocardial infarction. N Engl J Med 2009;361:868–77. [DOI] [PubMed] [Google Scholar]
- [8].McCann CJ, Glover BM, Menown IB, et al. Novel biomarkers in early diagnosis of acute myocardial infarction compared with cardiac troponin T. Eur Heart J 2008;29:2843–50. [DOI] [PubMed] [Google Scholar]
- [9].Ai J, Zhang R, Li Y, et al. Circulating microRNA-1 as a potential novel biomarker for acute myocardial infarction. Biochem Biophys Res Commun 2010;391:73–7. [DOI] [PubMed] [Google Scholar]
- [10].Wang GK, Zhu JQ, Zhang JT, et al. Circulating microRNA: a novel potential biomarker for early diagnosis of acute myocardial infarction in humans. Eur Heart J 2010;31:659–66. [DOI] [PubMed] [Google Scholar]
- [11].Zhong J, He Y, Chen W, et al. Circulating microRNA-19a as a potential novel biomarker for diagnosis of acute myocardial infarction. Int J Mol Sci 2014;15:20355–64. [DOI] [PMC free article] [PubMed] [Google Scholar]
- [12].Adachi T, Nakanishi M, Otsuka Y, et al. Plasma microRNA 499 as a biomarker of acute myocardial infarction. Clin Chem 2010;56:1183–5. [DOI] [PubMed] [Google Scholar]
- [13].Suresh R, Li X, Chiriac A, et al. Transcriptome from circulating cells suggests dysregulated pathways associated with long-term recurrent events following first-time myocardial infarction. J Mol Cell Cardiol 2014;74:13–21. [DOI] [PMC free article] [PubMed] [Google Scholar]
- [14].Gao Y, Qi GX, Guo L, et al. Bioinformatics analyses of differentially expressed genes associated with acute myocardial infarction. Cardiovasc Ther 2016;34:67–75. [DOI] [PubMed] [Google Scholar]
- [15].Voineagu I, Wang X, Johnston P, et al. Transcriptomic analysis of autistic brain reveals convergent molecular pathology. Nature 2011;474:380–4. [DOI] [PMC free article] [PubMed] [Google Scholar]
- [16].Saris CG, Horvath S, Van Vught PW, et al. Weighted gene co-expression network analysis of the peripheral blood from amyotrophic lateral sclerosis patients. BMC Genomics 2009;10:405. [DOI] [PMC free article] [PubMed] [Google Scholar]
- [17].Azuaje F, Zhang L, Jeanty C, et al. Analysis of a gene co-expression network establishes robust association between Col5a2 and ischemic heart disease. BMC Med Genomics 2013;6:13. [DOI] [PMC free article] [PubMed] [Google Scholar]
- [18].Smyth GK. Limma: Linear Models for Microarray Data. Bioinformatics and Computational Biology Solutions Using R and Bioconductor. 2005;New York, USA: Springer, 397–420. [Google Scholar]
- [19].Dennis G, Jr, Sherman BT, Hosack DA, et al. DAVID: database for annotation, visualization, and integrated discovery. Genome Biol 2003;4:P3. [PubMed] [Google Scholar]
- [20].Szklarczyk D, Franceschini A, Kuhn M, et al. The STRING database in 2011: functional interaction networks of proteins, globally integrated and scored. Nucleic Acids Res 2011;39:D561–8. [DOI] [PMC free article] [PubMed] [Google Scholar]
- [21].Smoot ME, Ono K, Ruscheinski J, et al. Cytoscape 2.8: new features for data integration and network visualization. Bioinformatics 2011;27:431–2. [DOI] [PMC free article] [PubMed] [Google Scholar]
- [22].Bovolenta LA, Acencio ML, Lemke N. HTRIdb: an open-access database for experimentally verified human transcriptional regulation interactions. BMC Genomics 2012;13:405. [DOI] [PMC free article] [PubMed] [Google Scholar]
- [23].Li C, Li X, Miao Y, et al. SubpathwayMiner: a software package for flexible identification of pathways. Nucleic Acids Res 2009;37: e131. [DOI] [PMC free article] [PubMed] [Google Scholar]
- [24].Horvath S, Dong J. Geometric interpretation of gene coexpression network analysis. PLoS Comput Biol 2008;4:e1000117. [DOI] [PMC free article] [PubMed] [Google Scholar]
- [25].Ravasz E, Somera AL, Mongru DA, et al. Hierarchical organization of modularity in metabolic networks. Science 2002;297:1551–5. [DOI] [PubMed] [Google Scholar]
- [26].Taminau J, Meganck S, Lazar C, et al. Unlocking the potential of publicly available microarray data using inSilicoDb and inSilicoMerging R/Bioconductor packages. BMC Bioinformatics 2012;13:335. [DOI] [PMC free article] [PubMed] [Google Scholar]
- [27].Scanzello CR, McKeon B, Swaim BH, et al. Synovial inflammation in patients undergoing arthroscopic meniscectomy: molecular characterization and relationship to symptoms. Arthritis Rheum 2011;63:391–400. [DOI] [PMC free article] [PubMed] [Google Scholar]
- [28].Tan JC, Rabkin R. Suppressors of cytokine signaling in health and disease. Pediatr Nephrol 2005;20:567–75. [DOI] [PubMed] [Google Scholar]
- [29].Yoshida S, Arakawa F, Higuchi F, et al. Gene expression analysis of rheumatoid arthritis synovial lining regions by cDNA microarray combined with laser microdissection: up-regulation of inflammation-associated STAT1, IRF1, CXCL9, CXCL10, and CCL5. Scand J Rheumatol 2012;41:170–9. [DOI] [PMC free article] [PubMed] [Google Scholar]
- [30].Haneklaus M, O’Neill LA, Coll RC. Modulatory mechanisms controlling the NLRP3 inflammasome in inflammation: recent developments. Curr Opin Immunol 2013;25:40–5. [DOI] [PubMed] [Google Scholar]
- [31].Balistreri CR, Candore G, Mirabile M, et al. TLR2 and age-related diseases: potential effects of Arg753Gln and Arg677Trp polymorphisms in acute myocardial infarction. Rejuvenation Res 2008;11:293–6. [DOI] [PubMed] [Google Scholar]
- [32].Van Der Pouw Kraan CTM, Bernink FJP, Baggen JM, et al. Toll like receptor activation during human acute myocardial infarction with ST elevation. Eur Heart J 2013;34(suppl 1):2838. [Google Scholar]
- [33].Limana F, Esposito G, Fasanaro P, et al. Transcriptional profiling of HMGB1-induced myocardial repair identifies a key role for Notch signaling. Mol Ther 2013;21:1841–51. [DOI] [PMC free article] [PubMed] [Google Scholar]
- [34].Ueland T, Espevik T, Kjekshus J, et al. Mannose binding lectin and soluble Toll-like receptor 2 in heart failure following acute myocardial infarction. J Card Fail 2006;12:659–63. [DOI] [PubMed] [Google Scholar]
- [35].Arslan F, Smeets MB, O’Neill LA, et al. Myocardial ischemia/reperfusion injury is mediated by leukocytic toll-like receptor-2 and reduced by systemic administration of a novel anti–toll-like receptor-2 antibody. Circulation 2010;121:80–90. [DOI] [PubMed] [Google Scholar]
- [36].Gavins FN. Are formyl peptide receptors novel targets for therapeutic intervention in ischaemia—reperfusion injury? Trends Pharmacol Sci 2010;31:266–76. [DOI] [PMC free article] [PubMed] [Google Scholar]
- [37].Qin C, Buxton KD, Pepe S, et al. Reperfusion-induced myocardial dysfunction is prevented by endogenous annexin-A1 and its N-terminal-derived peptide Ac-ANX-A12-26. Br J Pharmacol 2013;168:238–52. [DOI] [PMC free article] [PubMed] [Google Scholar]
- [38].Cao Y, Li R, Li Y, et al. Identification of transcription factor-gene regulatory network in acute myocardial infarction. Heart Lung Circ 2016;26:343–53. [DOI] [PubMed] [Google Scholar]
- [39].Heo SC, Kwon YW, Jang IH, et al. Formyl peptide receptor 2 is involved in cardiac repair after myocardial infarction through mobilization of circulating angiogenic cells. Stem Cells 2017;35:654–65. [DOI] [PubMed] [Google Scholar]
- [40].McCormick J, Suleman N, Scarabelli T, et al. STAT1 deficiency in the heart protects against myocardial infarction by enhancing autophagy. J Cell Mol Med 2012;16:386–93. [DOI] [PMC free article] [PubMed] [Google Scholar]
- [41].Furrer A, Hottiger MO, Valaperti A. Absent in Melanoma 2 (AIM2) limits pro-inflammatory cytokine transcription in cardiomyocytes by inhibiting STAT1 phosphorylation. Mol Immunol 2016;74:47–58. [DOI] [PubMed] [Google Scholar]
- [42].Minami M, Shimizu K, Okamoto Y, et al. Prostaglandin E receptor type 4-associated protein interacts directly with NF-κB1 and attenuates macrophage activation. J Biol Chem 2008;283:9692–703. [DOI] [PMC free article] [PubMed] [Google Scholar]
- [43].Ma Y, Halade GV, Zhang J, et al. Matrix metalloproteinase-28 deletion exacerbates cardiac dysfunction and rupture after myocardial infarction in mice by inhibiting M2 macrophage activation. Circ Res 2013;112:675–88. [DOI] [PMC free article] [PubMed] [Google Scholar]
- [44].Hsu SH, Hsieh-Li HM, Huang HY, et al. BHLH-zip transcription factor SPZ1 mediates mitogen-activated protein kinase cell proliferation, transformation, and tumorigenesis. Cancer Res 2005;65:4041–50. [DOI] [PubMed] [Google Scholar]
- [45].Yu Y, Wei SG, Zhang ZH, et al. ERK1/2 MAPK signaling in hypothalamic paraventricular nucleus contributes to sympathetic excitation in rats with heart failure after myocardial infarction. Am J Physiol Heart Circ Physiol 2016;310:H732–9. [DOI] [PMC free article] [PubMed] [Google Scholar]


