1 Introduction
The high variability in disease presentation and course is a hallmark of cancer [1], and intratumor heterogeneity or diversity has been associated with tumor progression/aggressiveness [2–4]. It is therefore of great interest to reveal the characteristics in tumor heterogeneity in various aspects including structure, function, and genetics. For example, tissue oxygenations measured under clinical settings were more heterogeneous in tumors than in normal tissue, and the intertumor variability of tissue oxygenation was more pronounced than intratumor heterogeneity; furthermore, variations of pO2 measured by needle electrodes within breast tumors did not correlate with the measuring site (tumor center versus periphery) [5, 6].
Our previous work showed mitochondrial redox state and its heterogeneity in tumor tissue provide sensitive and potentially diagnosis-useful characteristics for differentiating among five human melanoma mouse xenografts and between two breast tumor mouse xenografts with different metastatic potentials [7, 8]. In those studies, the aggressive human cancer mouse xenografts have localized areas where higher Fp redox ratio, Fp/(Fp + NADH) exists (usually in their cores), resulting in a bi-modal distribution of Fp redox ratio in the histogram of a tumor section image. These results suggest that the redox state of the oxidized tumor core could be used to grade tumor aggressiveness of human melanoma and breast cancer. However, the tumors in those studies were only imaged for two to nine sections with various tissue depths less than ~4 mm.
To aid our full understanding of the tumor redox state, it would be very informative to quantitatively reveal how mitochondrial redox state varies in 3D within an entire tumor. In the present study, we report our preliminary results of mapping intratumor heterogeneity in mitochondrial redox state at a high spatial resolution (50 μm in-plane resolution with a section thickness down to 20 μm achievable) of the entire tumor for three human breast cancer lines having ascending order of aggressiveness: MCF-7 < MDA-MB-468 ≤ 231? (see Discussion section).
2 Methods
Three human breast cancer xenografts MCF-7, MDA-MB-468, and MDA-MB-231 were allowed to grow to 6–10 mm in diameter. The tumor-bearing mice under anesthesia were snap-frozen with liquid nitrogen to maintain the in vivo mitochondrial redox state for the ex vivo redox scanning. The preparation of samples for redox scanning were previously described [8, 9]. Briefly, the excised frozen tumors were embedded with chilled mounting buffer (ethanol–glycerol–water in 10:30:60). Frozen reference standards (one for NADH and one for Fp with known concentrations) were quickly mounted adjacent to the tissue.
The low-temperature redox scanner [10–12] was employed to obtain multi-slice fluorescence images NADH and Fp. The tumor samples (N = 1 for each tumor line) were scanned section by section with a total of 11–14 sections per tumor at different depths (d) with 400 μm spacing. The scanning matrix was 64 × 64 with a step size of 200 μm. The nominal concentrations of NADH and Fp in tissue were interpreted using reference standards and used to calculate the Fp redox ratio, Fp/(NADH + Fp), representing the mitochondrial redox state.
3 Results
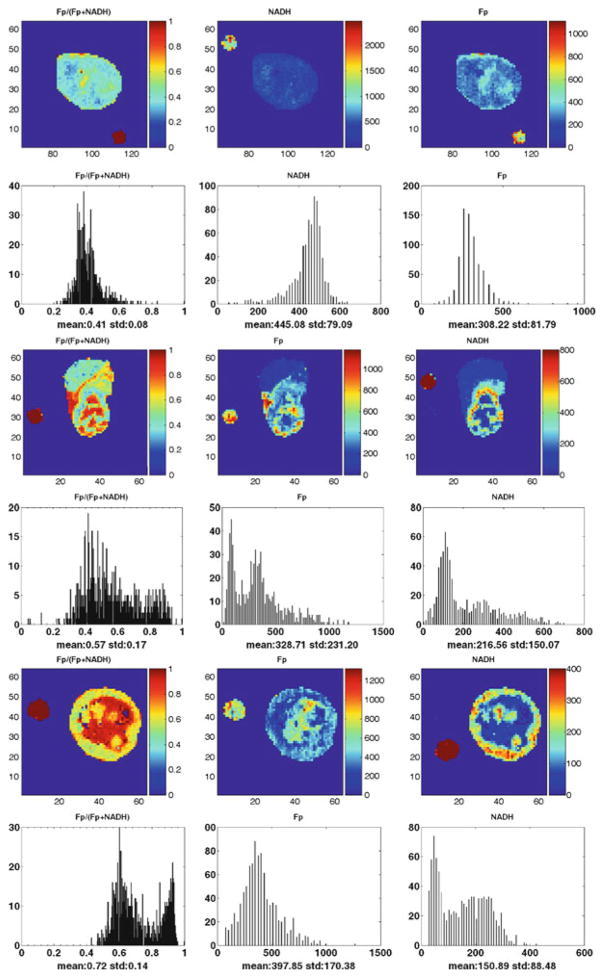
The results (typical ones are shown in Fig. 25.1) revealed that both aggressive tumor tissues (MDA-MB-231 and MDA-MB-468) displayed distinct heterogeneity in the distributions of NADH, Fp and Fp redox ratio in each section, with a localized area (usually tumor core) exhibiting much higher Fp redox ratio than other regions (usually tumor rim); the indolent MCF-7 tumor displayed a relatively less heterogeneous distribution in Fp, NADH, and Fp redox ratio in each section, with lower Fp redox ratios on average than those oxidized regions of aggressive tumors.
Fig. 25.1.
Typical images of redox scanning of the mouse xenografts of MCF-7 (top two rows, d = 1,400 μm); MDA-MB-468 (middle two rows, d = 1,400 μm); MDA-MB-231 (bottom two rows, d = 3,600 μm) tumor lines. The Fp or NADH redox ratio ranges between 0 and 1; the Fp or NADH images are in the unit of μM in reference to the corresponding standards. The x-axes of the corresponding histograms represent the Fp redox ratio or concentration. The y-axes represent the number of pixels in the tumor sections having a specific value of Fp redox ratio or concentration. The small round spots outside the tumor sections are the images of Fp or NADH reference standards. The image matrix was 64 × 64 with a resolution of 200 μm
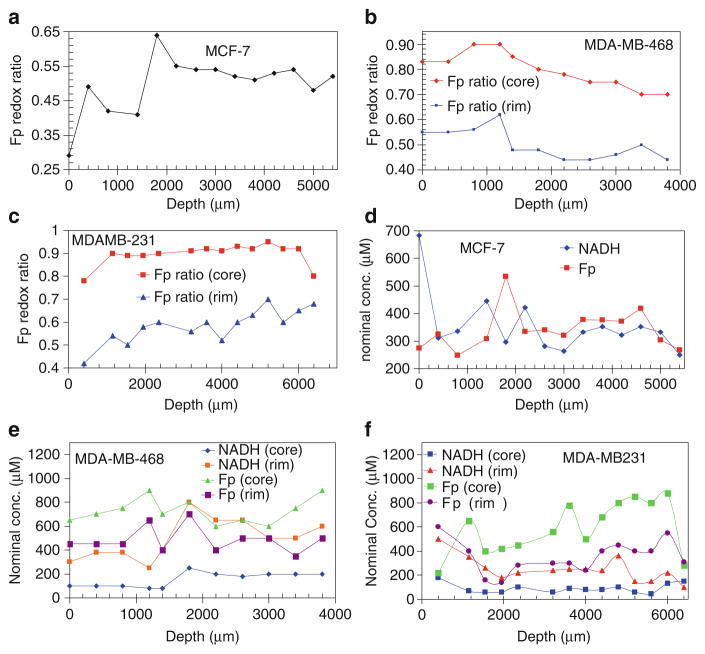
Figure 25.2 depicts the depth-dependence of the three redox indices in the three tumors. Table 25.1 presents the mean values of the redox indices. The heterogeneities between tumor sections are shown.
Fig. 25.2.
Depth-dependent redox indices. The Fp redox ratios (a–c) and the Fp and NADH nominal concentrations in μM (d–e) at different depths of the three tumors: MCF-7, MDA-MB-468, and MDA-MB-231
Table 25.1.
Mean values of the redox indices, where Fp and NADH are nominal concentrations in μM in reference of the respective solution standards
| Fp redox ratio (core) | Fp redox ratio (rim) | Fp (core) | Fp (rim) | NADH (core) | NADH (rim) | |
|---|---|---|---|---|---|---|
| * MCF-7 | 0.53 ± 0.06 | 0.53 ± 0.06 | 359 ± 72 | 359 ± 72 | 332 ± 61 | 332 ± 61 |
| MDA-MB-468 | 0.78 ± 0.07 | 0.50 ± 0.06 | 727 ± 106 | 486 ± 105 | 154 ± 62 | 492 ± 169 |
| MDA-MB-231 | 0.91 ± 0.04 | 0.61 ± 0.05 | 636 ± 203 | 343 ± 112 | 87 ± 32 | 215 ± 69 |
MCF-7 tumor had no core-rim difference therefore the overall averages were provided instead
4 Discussion
As revealed in our previous studies, mitochondrial redox state in tumor tissue was associated with melanoma and breast tumor metastatic potentials [7, 8]. Imaging intratumor heterogeneity in mitochondrial redox state in tumor tissue may provide useful information for understanding tumor aggressiveness. This is the first study to reveal the 3D distribution of the mitochondrial redox state and Fp and NADH nominal concentration in an entire breast tumor xenograft. This study allows the comparison among the redox images of three breast cancer xenografts with ascending aggressiveness MCF-7 < MDA-MB-468 < MDA-MB-231 according to cancer literatures. Both MDA-MB-468 and MDA-MB-231 cells are triple-negative cells [13–15] and they belong to aggressive tumors. Although MDA-MB-468 cells are not as aggressive as MDA-MB-231 cells as determined by the Boyden Chamber method [16, 17], under chemotaxis condition the MDA-MB-468 cells become much invasive [17]. Thus the result in this study is consistent with what we obtained in our previous studies: aggressive tumors exhibit more oxidized redox state in some tumor regions.
5 Conclusions
In this paper, we reported the preliminary results on 3D high-resolution mapping of mitochondrial redox state of three breast tumor xenografts MCF-7, MDA-MB-468, and MDA-MB-231 having ascending aggressiveness. Heterogeneity in mitochondrial redox state in entire tumors was revealed for the first time. The work is in progress to study more breast tumor xenografts and identify imaging biomarkers that may benefit basic research, clinical diagnosis, and therapy of breast cancer.
Acknowledgments
This work was supported by the Susan G. Komen Foundation Grant KG081069 (PI: L.Z. Li), NIH (R01 CA155348, PI: L.Z. Li) the Center for Magnetic Resonance and Optical Imaging - a NIH supported research resource RR02305 (PI: R. Reddy), the SAIR grant 2U24-CA083105 (PI: J.D. Glickson and L.A. Chodosh).
Contributor Information
H.N. Xu, Department of Radiology, School of Medicine, University of Pennsylvania, 423 Guardian Drive, Philadelphia, PA 19014, USA
S. Nioka, Department of Biochemistry and Biophysics, School of Medicine, University of Pennsylvania, Philadelphia, PA, USA
B. Chance, Department of Biochemistry and Biophysics, School of Medicine, University of Pennsylvania, Philadelphia, PA, USA
L.Z. Li, Department of Radiology, School of Medicine, University of Pennsylvania, 423 Guardian Drive, Philadelphia, PA 19014, USA
References
- 1.Heppner GH, Miller FR. The cellular basis of tumor progression. Int Rev Cytol. 1998;177:1–56. doi: 10.1016/s0074-7696(08)62230-5. [DOI] [PubMed] [Google Scholar]
- 2.Heppner GH. Tumor heterogeneity. Cancer Res. 1984;44:2259–2265. [PubMed] [Google Scholar]
- 3.Allred DC, Wu Y, Mao S, et al. Ductal carcinoma in situ and the emergence of diversity during breast cancer evolution. Clin Cancer Res. 2008;14:370–378. doi: 10.1158/1078-0432.CCR-07-1127. [DOI] [PubMed] [Google Scholar]
- 4.Park SY, Lee HE, Li H, et al. Heterogeneity for stem cell-related markers according to tumor subtype and histologic stage in breast cancer. Clin Cancer Res. 2010;16:876–887. doi: 10.1158/1078-0432.CCR-09-1532. [DOI] [PMC free article] [PubMed] [Google Scholar]
- 5.Vaupel P, Hockel M, Mayer A. Detection and characterization of tumor hypoxia using pO2 histography. Antioxid Redox Signal. 2007;9:1221–1235. doi: 10.1089/ars.2007.1628. [DOI] [PubMed] [Google Scholar]
- 6.Vaupel P, Schlenger K, Knoop C, et al. Oxygenation of human tumors: evaluation of tissue oxygen distribution in breast cancers by computerized O2 tension measurements. Cancer Res. 1991;51:3316–3322. [PubMed] [Google Scholar]
- 7.Li LZ, Zhou R, Xu HN, et al. Quantitative magnetic resonance and optical imaging biomarkers of melanoma metastatic potential. Proc Natl Acad Sci U S A. 2009;106:6608–6613. doi: 10.1073/pnas.0901807106. [DOI] [PMC free article] [PubMed] [Google Scholar]
- 8.Xu HN, Nioka S, Glickson JD, et al. Quantitative mitochondrial redox imaging of breast cancer metastatic potential. J Biomed Opt. 2010;15:036010. doi: 10.1117/1.3431714. [DOI] [PMC free article] [PubMed] [Google Scholar]
- 9.Xu HN, Wu B, Nioka S, et al. Calibration of redox scanning for tissue samples. Proceedings of Biomedical Optics; San Jose, CA. Jan. 24; 2009. pp. 7174–71742F. Ed SPIE. [Google Scholar]
- 10.Chance B, Schoener B, Oshino R, et al. Oxidation-reduction ratio studies of mitochondria in freeze-trapped samples NADH and flavoprotein fluorescence signals. J Biol Chem. 1979;254:4764–4771. [PubMed] [Google Scholar]
- 11.Gu Y, Qian Z, Chen J, et al. High-resolution three-dimensional scanning optical image system for intrinsic and extrinsic contrast agents in tissue. Rev Sci Instrum. 2002;73:172–178. [Google Scholar]
- 12.Li LZ, Xu HN, Ranji M, et al. Mitochondrial redox imaging for cancer diagnostic and therapeutic studies. J Innov Opt Health Sci. 2009;2:325–341. doi: 10.1142/S1793545809000735. [DOI] [PMC free article] [PubMed] [Google Scholar]
- 13.Köster F, Engel J, Schally A, et al. Triple-negative breast cancers express receptors for growth hormone-releasing hormone (GHRH) and respond to GHRH antagonists with growth inhibition. Breast Cancer Res Treat. 2009;116:273. doi: 10.1007/s10549-008-0120-4. [DOI] [PubMed] [Google Scholar]
- 14.Bartholomeusz C, Gonzalez-Angulo AM, Kazansky A, et al. PEA-15 inhibits tumorigenesis in an MDA-MB-468 triple-negative breast cancer xenograft model through increased cytoplasmic localization of activated extracellular signal-regulated kinase. Clin Cancer Res. 2010;16:1802–1811. doi: 10.1158/1078-0432.CCR-09-1456. [DOI] [PubMed] [Google Scholar]
- 15.Anders C, Carey LA. Understanding and treating triple-negative breast cancer. Oncology (Williston Park) 2008;22:1233–1239. discussion 1239–40, 1243. [PMC free article] [PubMed] [Google Scholar]
- 16.Freund A, Chauveau C, Brouillet JP, et al. IL-8 expression and its possible relationship with estrogen-receptor-negative status of breast cancer cells. Oncogene. 2003;22:256–265. doi: 10.1038/sj.onc.1206113. [DOI] [PMC free article] [PubMed] [Google Scholar]
- 17.Thompson EW, Paik S, Brunner N, et al. Association of increased basement membrane invasiveness with absence of estrogen receptor and expression of vimentin in human breast cancer cell lines. J Cell Physiol. 1992;150:534–544. doi: 10.1002/jcp.1041500314. [DOI] [PubMed] [Google Scholar]


