Hematopoietic-specific miR-142 is a critical regulator of various blood cell lineages including CD4+ dendritic cells1 and platelet biogenesis in megakaryocytes.2 Furthermore, we recently reported that miR-142 is required in order to maintain the biconcave shape of erythrocytes, their structural resilience and lifespan, through a mechanism that involves actin filament homeostasis.3 Here, we used a mouse loss of function allele to characterize a new axis, where miR-142 functions upstream of Rac1 in regulating erythropoiesis.
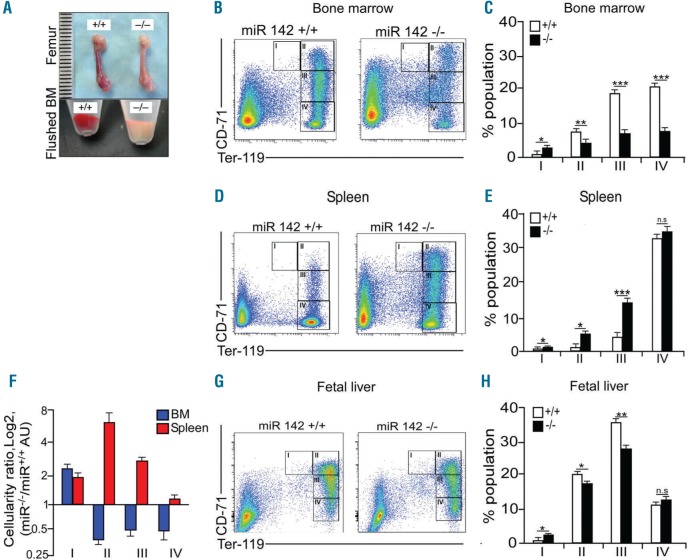
The expression of the two mature miRNAs, miR-142-3p and miR-142-5p, emerging from the miR-142 precursor (pre-miR-142) is completely nullified in the hematopoietic lineages of the mouse model that we developed,2 including in circulating blood cells (Online Supplementary Figure S1A) and in red blood cells (Online Supplementary Figure S1B). miR-142-deficient mice suffer from mild anemia that is associated with a shorter lifespan of adult red blood cells and with reticulocytosis.3 Therefore, we hypothesized that compensatory erythropoiesis takes place at the bone marrow (BM). Unexpectedly, macroscopic examination of femurs and of freshly isolated BMs revealed erythroid hypoplasia in the BM in miR-142−/− animals, relative to controls (Figure 1A). The reduced BM cellularity is probably not due to fibrosis, since reticulin staining was distributed in the expected pattern, in both wild-type (WT) and miR-142−/− bones (Online Supplementary Figure S2).
Figure 1.
Ineffective erythropoiesis in miR-142−/− animals. (A) Macroscopic appearance of freshly dissected wild-type WT, +/+ and miR-142 deficient (−/−) femurs, or flushed bone marrow (BM). (B) Representative flow cytometry profiles of WT (+/+) and miR-142 deficient (−/−) BM erythorid cell populations and (C) quantification (n=3 mice, per group). Roman numerals indicate developmentally defined subpopulations: I-Ter119MEDCD71HI, pro-erythroblasts; II- Ter119HICD71HI, basophilic erythroblasts; III- Ter119HICD71MED, polychromatophilic erythroblasts; IV-Ter119HICD71NEG, orthochromatophilic erythroblasts to mature erythrocytes. (D) Representative flow cytometry profiles of WT (+/+) and miR-142 deficient (−/−) spleen erythroid populations and (E) quantification (n=3 animals per group). (F) Relative spleen (red) and bone marrow (blue) cellularity, presented as log2 of miR-142−/− value divided by miR-142+/+ value. (G) Representative flow cytometry profiles of WT (+/+) or miR-142 deficient (−/−) erythroid populations from fetal liver and (H) quantification (n=3 mice, per group). Two-tailed Student t-test, Error bars, mean ± Standard Error of Mean, *P<0.05; **P<0.01; ***P<0.001; ns: not significant.
We then characterized erythropoiesis directly by erythroid precursor cytometry, using antibodies against the surface markers CD71 and TER119, which showed impairment in the normoblast series (Figure 1B and C). Therefore, erythropoiesis is impaired in miR-142 knockout animals.
miR-142−/− mice exhibit splenomegaly and disorganized spleen parenchyma; smaller white pulp nodules and red pulp expansion (Online Supplementary Figure S3A and B) are consistent with our previous report.2 In theory, splenomegaly could have resulted from exacerbated destruction of erythrocytes; however, flow cytometry of splenic populations revealed that miR-142−/− animals exhibited extramedullary erythropoiesis (Figure 1D and E). Exploring the proportions of normoblast subpopulations in spleen and BM for miR-142−/− values divided by wild-type values revealed that a miR-142-deficient spleen is more active than a WT spleen, and it is plausible that the spleen compensates for BM insufficiency (Figure 1F).
To test spleen function in a miR-142 null model directly, we surgically excised the spleen. Splenectomized miR-142−/− mice showed more severe anemia and limited reticulocytosis compared to WT splenectomized mice (Online Supplementary Figure S3C–J). Therefore, spleen erythropoiesis probably compensates for reduced BM erythropoiesis, faster destruction of circulating miR-142 deficient erythrocytes, or both.
Flow cytometry of E13.5 FL revealed impairments in embryonic erythropoiesis that are comparable with those observed in adult BM (Figure 1G and H). The similarity between the defects caused by loss of miR-142 in embryogenesis and in adulthood suggests a constitutive requirement for miR-142 activity in the life of the organism.
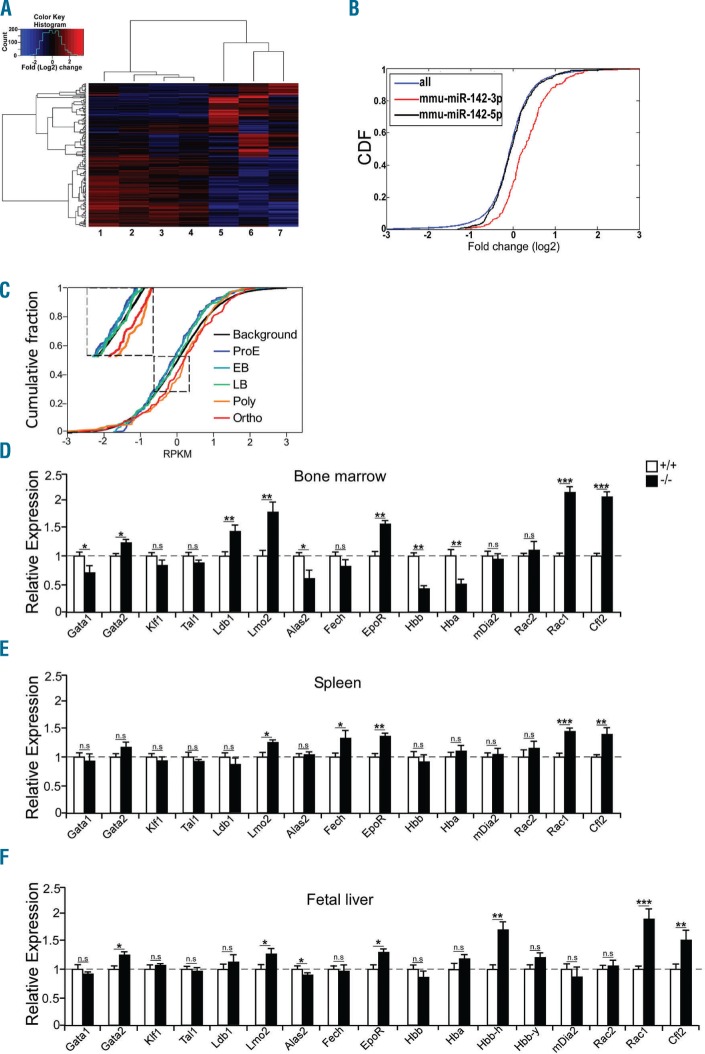
To determine the mechanism by which miR-142 controls erythroid differentiation, we compared mRNA expression profiles of miR-142 deficient and WT FL erythroid burst and colony-forming units (BFUe/CFUe). Genome-wide transcriptome analysis via next generation sequencing revealed a signature of hundreds of mRNAs whose differential expression distinguishes miR-142−/− erythroblasts from WT counterparts (Figure 2A and Online Supplementary Table S1).
Figure 2.
The widespread molecular signature of miR-142 on the transcriptome in mouse and human erythropoiesis. (A) Hierarchical heat map gene clustering of 200 differentially expressed CFUe mRNAs of miR-142 deficient (samples 1–4) and control wild-type (WT, samples 5–7). Log2 fold-change of differential values. (B) Cumulative distribution function (CDF) plot reveals de-repression (upregulation) of transcripts with miR-142-3p binding sites in miR-142-deficient CFUe (red), relative to background gene expression of all transcripts (blue) or to predicted miR-142-5p targets (black). (C) CDF plot of miR-142-3p.1 targets (TargetScan,4 167 genes), in five human-erythroid differentiation stages. Reanalysis of global transcriptome data (n=3 experimental repeats per stage; GEO accession GSE53983).5 Log2 of RPKM values. Normalized CDF of all 9800 expressed mRNAs (background), were similar in the five differentiation stages and presented as a single black line. ProE: proerythroblast; EB: early basophilic; LB: late basophilic; Poly: polychromatic; Ortho: orthochromatic. qPCR analysis of miR-142 targets and erythropoiesis marker mRNAs in TER119+ cells from miR-142 deficient or WT bone marrow (D), spleen (E) or fetal liver (F), normalized to HPRT (n=3 mice, per group). Two-tailed Student t-test. Error bars, mean ± Standard Error of Mean, *P<0.05; **P<0.01; ***P<0.001; n.s: not significant.
Cumulative distribution function (CDF) analysis demonstrated that dozens of mRNAs that harbor miR-142-3p binding sites in their 3′-UTR and are predicted miR-142-3p targets (TargetScan4) were significantly up-regulated in miR-142−/− CFUe compared to the reference (Figure 2B). However, such signature was not observed for the sister miRNA, miR-142-5p, suggesting that miR-142-3p is the active guide miRNA from the pre-miR-142 hairpin in erythroid cells.
We extended the investigation of miR-142 transcriptomic effect to human erythropoiesis, by interrogating an RNA-Seq dataset of the Gallagher lab5 for changes in target expression at different stages of human erythropoiesis. We uncovered a conjoint de-repression pattern of 167 mRNAs in human polychromatic and orthochromatophilic normoblasts whose only common characteristic is that they harbor a conserved miRNA recognition element for miR-142 at the 3′UTR. This signature was specific for miR-142-3p targets, and was neither seen in the target-set of miR-142-5p, nor in 9800 other mRNAs that lack miR-142 binding sites (Figure 2C). Furthermore, similar analyses of targets predicted for miR-451 and miR-191 did not show similar trends (data not shown). These data from unmanipulated human cells underpin the role of miR-142 in erythropoiesis and suggest that it plays comparable roles in humans.
We sorted erythroid cells by FACS, extracted RNA, and performed a quantitative real time PCR (qPCR) study to characterize 15 mRNAs that illustrate facets of erythropoiesis. Hemoglobin mRNAs (Hbb-b1, Hba-a1) and the heme synthesis enzyme Alas2 were reduced by approximately 50% in RNA from miR-142 deficient BM cells compared to control (Figure 2D). This is a signature of apparent immaturity that is aligned with the reported structural defects in adult red blood cells.3 It might also be linked to reduced expression of Gata1 and up-regulated levels of Gata2, Ldb1and Lmo2.6 The molecular block in BM erythroid differentiation is compensated by spleen erythropoiesis that is consistently less affected by loss of miR-142 (Figure 2E).
While key genes were dysregulated to different extents in FL, BM and spleen erythroid cells, upregulation of Rac1 and Cfl2 was consistent across all miR-142-deficient samples (Figure 2D–F). Rac GTPases play important roles in controlling actin cytoskeleton organization,7,8 erythropoiesis,9 and enucleation10 (reviewed by Kalfa and Zheng11) reminiscent of miR-142 loss of function phenotypes.
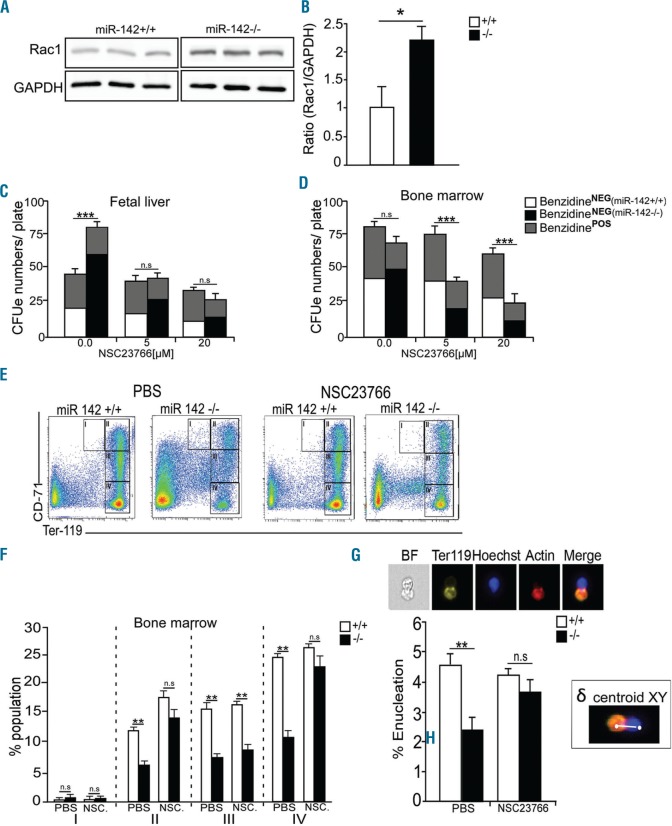
Because there is evidence that Rac1 is a target of miR-142 in hepatocellular carcinoma cell lines12 or T cells,13 and since perturbed Rac phenotypes are reminiscent of miR-142 activity, we hypothesized that Rac1 functions as a key effector of miR-142 in erythropoiesis. To test this hypothesis further, we quantified RAC1 protein levels, and found it to be up-regulated approximately 2 fold in miR-142−/− BM (Figure 3A and B).
Figure 3.
Rac1 functions downstream of miR-142-3p in regulating erythropoiesis. (A) Western blot study of Rac1 and GAPDH (loading control) in cell lysates from wild-type (WT) (+/+) and miR-142 deficient (−/−) bone marrow and (B) bar graph quantification of Rac1/GAPDH ratio (n=3 animals per group). Quantification of miR-142 deficient (−/−) BFUe / CFUe, with different concentrations of Rac1 inhibitor, NSC23766, in fetal liver (C) or bone marrow (D). Upper bars (gray) represent the numbers of differentiating colonies, which were stained with benzidine, from total colony numbers. (E) Representative flow cytometry of erythroid bone marrow subpopulations and (F) percentile quantification after in vivo administration of carrier (PBS) or NSC23766 (2.5 mg/kg/day, intraperitoneally, for 10 days) to WT and miR-142 deficient animals (n=4 animals per group. NSC - NSC23766). Roman numerals indicate developmentally defined sub-populations: I-Ter119MEDCD71HI: pro-erythroblasts; II- Ter119HICD71HI: basophilic erythroblasts; III- Ter119HICD71MED: polychromatophilic erythroblasts; IVTer119HICD71NEG, orthochromatophilic erythroblasts to mature erythrocytes. (G) Representative images of bone marrow cells, stained with Ter119-PE (yellow), Hoechst (nucleus, blue) and 647-Phalloidin (F-actin, red) and percentile quantification of enucleation in WT and mutant miR-142−/− bone marrow, by ImageSteramX cytometry (n=3 mice, per group). White bar depicts the measurement of δ centroid XY signal in a micrograph of an enucleating erythroblast with highly eccentric Ter119 - Hoechst signal. Parameters described in Online Supplementary Methods and Online Supplementary Figure S4. Two-tailed Student t-test, Error bars, mean± Standard Error of Mean, *P<0.05; **P<0.01; ***P<0.001; n.s: non significant.
We next analyzed erythropoiesis ex vivo in fetal liver, BM or spleen cells cultured on methylcellulose under conditions that promote erythroid cell colony formation. Quantification of BFUe / CFUe revealed higher number of colonies, larger colony size, and reduced differentiation (benzidine staining) in FL and spleen, but not in BM culture, compared to controls (Figure 3C and D, and Online Supplementary Figure S4). Therefore, miR-142 KO BFUe/CFUe exhibit higher proliferation rates and reduced differentiation.
NSC23766 is a known Rac1 inhibitor,14 and we introduced this to dissociated FL, BM or spleen cells in methylcellulose cultures. Rac1 inhibition normalized CFUe colony numbers suggesting that Rac1 functions downstream of miR-142 in regulating erythroid proliferation / differentiation (Figure 3C and D). We then pursued in vivo evidence for the activity of Rac1 downstream of miR-142. Treatment of miR-142−/− mice with Rac1 inhibitor (NSC23766; 2.5 mg/Kg/day for 10 days) partially recovered bone marrow erythropoiesis, including basophilic (II), orthochromatophilic (IV), and erythroblast populations (Figure 3E and F). Additional evidence for amelioration of disease burden included reduced spleen size, alleviation of compensatory spleen erythropoiesis, and improved blood cell counts in the circulation (Online Supplementary Figure S5A–F).
Interestingly, constitutively active and dominant negative forms of Rac1, or Rac2, significantly decreased enucleation, suggesting that Rac1 expression should be tightly maintained for normal enucleation.10,15 We assessed enucleation in miR-142-deficient BM. Enucleating cells exhibit eccentric Ter119- Hoechst Δ centroid signal, which can be quantified by ImageStreamX flow cytometer, following McGrath et al.16 (Online Supplementary Figure S6A–C). The bone marrow miR-142−/− erythroblasts possessed reduced enucleation capacity compared to controls. However, after treatment of miR-142−/− BM with Rac1 inhibitor, enucleation capacity was recovered (Figure 3G).
Our data here and those in a previous report3 reveal that miR-142 controls several red blood cell properties, including erythropoiesis and cytoskeleton organization.3 Rac proteins and miR-142 regulate several related functions, primarily Actin cytoskeleton homeostasis and erythrocyte membrane mechanics,3,7 suggesting that a shared miR-142- Rac1 pathway underpins miR-142 function. Rac1 is a direct target of miR-142-3p and pharmacological inhibition of Rac in miR-142−/− mice improves BM erythropoiesis and ameliorated extramedullary spleen erythropoiesis. The conceivable evidence for functional epistasis in vivo is further supported by a fascinating phenotype similarity: both Rac proteins and miR-142 control homeostatic erythropoiesis and CFUe proliferation,9 and their activity is primarily restricted to the BM, while only marginally affecting extramedullary spleen erythropoiesis.7 Furthermore, gain (or loss) of Rac activity impairs enucleation, in accordance with the phenotypes reported here for the miR-142 allele.10,15
In summary, our studies uncover a critical role for miR-142 in erythropoiesis, upstream of Rac1. Lineage-specific miRNAs expose new dimensions in erythroid regulatory networks and highlight the involvement of a novel miR-142-Rac1 pathway in regulating erythro-proliferation and differentiation.
Supplementary Material
Acknowledgments
The authors would like to thank Ofira Higfa and Yehudah Melamed for veterinary services and husbandry, and Dr. Joseph Lotem for helpful discussions, Diana Rashkovan Varol and Tegest Aychek for technical assistance, Gil Hornung for bioinformatics.
Footnotes
Funding: the work is funded by the Minerva Foundation and Minna-James-Heineman Stiftung through Minerva. Work at the Hornstein Lab is further funded by an ERC consolidator program (617351), Israel Science Foundation, the Legacy-Heritage program, Bruno and Ilse Frick Foundation for Research on ALS, the ALS Therapy Alliance, the Motor Neurone Disease Association (UK), the Thierry Latran Foundation for ALS research, the ERA-Net for Research Programmes on Rare Diseases (FP7), A. Alfred Taubman through IsrALS; Teva Pharmaceutical Industries Ltd. as part of the Israeli National Network of Excellence in Neuroscience (NNE); Yeda-Sela, Yeda-CEO, Israel Ministry of Trade and Industry, Y. Leon Benoziyo Institute for Molecular Medicine, the Kekst Family Institute for Medical Genetics, the David and Fela Shapell Family Center for Genetic Disorders Research, the Crown Human Genome Center, the Nathan, Shirley, Philip and Charlene Vener New Scientist Fund, Julius and Ray Charlestein Foundation, the Fraida Foundation, the Wolfson Family Charitable Trust, the Adelis Foundation, MERCK (UK), Maria Halphen, and the Estates of Fannie Sherr, Lola Asseof and Lilly Fulop. Izraeli lab is supported by Department of Defense (W81XWH-15-1-0227), Israel Science Foundation, Giorgio & Donna Shapiro and the Dotan centers for hematological malignancies at Tel Aviv University. EH is incumbent of the Mondry Family Professorial Chair and the Hornstein lab is supported by Dr. Sydney Brenner.
Information on authorship, contributions, and financial & other disclosures was provided by the authors and is available with the online version of this article at www.haematologica.org.
References
- 1.Mildner A, Chapnik E, Manor O, et al. Mononuclear phagocyte miRNome analysis identifies miR-142 as critical regulator of murine dendritic cell homeostasis. Blood. 2013;121(6):1016–1027. [DOI] [PubMed] [Google Scholar]
- 2.Chapnik E, Rivkin N, Mildner A, et al. miR-142 orchestrates a network of actin cytoskeleton regulators during megakaryopoiesis. Elife. 2014;3:e01964. [DOI] [PMC free article] [PubMed] [Google Scholar]
- 3.Rivkin N, Chapnik E, Mildner A, et al. Erythrocyte survival is controlled by microRNA-142. Haematologica. 2017;102(4):676–685. [DOI] [PMC free article] [PubMed] [Google Scholar]
- 4.Agarwal V, Bell GW, Nam JW, Bartel DP. Predicting effective microRNA target sites in mammalian mRNAs. Elife. 2015;4. [DOI] [PMC free article] [PubMed] [Google Scholar]
- 5.An X, Schulz VP, Li J, et al. Global transcriptome analyses of human and murine terminal erythroid differentiation. Blood. 2014; 123(22):3466–3477. [DOI] [PMC free article] [PubMed] [Google Scholar]
- 6.Hattangadi SM, Wong P, Zhang L, Flygare J, Lodish HF. From stem cell to red cell: regulation of erythropoiesis at multiple levels by multiple proteins, RNAs, and chromatin modifications. Blood. 2011; 118(24):6258–6268. [DOI] [PMC free article] [PubMed] [Google Scholar]
- 7.Kalfa TA, Pushkaran S, Mohandas N, et al. Rac GTPases regulate the morphology and deformability of the erythrocyte cytoskeleton. Blood. 2006;108(12):3637–3645. [DOI] [PMC free article] [PubMed] [Google Scholar]
- 8.Gu Y, Filippi MD, Cancelas JA, et al. Hematopoietic cell regulation by Rac1 and Rac2 guanosine triphosphatases. Science. 2003;302(5644):445–449. [DOI] [PubMed] [Google Scholar]
- 9.Kalfa TA, Pushkaran S, Zhang X, et al. Rac1 and Rac2 GTPases are necessary for early erythropoietic expansion in the bone marrow but not in the spleen. Haematologica. 2010;95(1):27–35. [DOI] [PMC free article] [PubMed] [Google Scholar]
- 10.Ji P, Jayapal SR, Lodish HF. Enucleation of cultured mouse fetal erythroblasts requires Rac GTPases and mDia2. Nat Cell Biol. 2008;10(3):314–321. [DOI] [PubMed] [Google Scholar]
- 11.Kalfa TA, Zheng Y. Rho GTPases in erythroid maturation. Curr Opin Hematol. 2014;21(3):165–171. [DOI] [PMC free article] [PubMed] [Google Scholar]
- 12.Wu L, Cai C, Wang X, Liu M, Li X, Tang H. MicroRNA-142-3p, a new regulator of RAC1, suppresses the migration and invasion of hepatocellular carcinoma cells. FEBS Lett. 2011;585(9):1322–1330. [DOI] [PubMed] [Google Scholar]
- 13.Liu J, Li W, Wang S, et al. MiR-142-3p attenuates the migration of CD4(+) T cells through regulating actin cytoskeleton via RAC1 and ROCK2 in arteriosclerosis obliterans. PLoS One. 2014;9(4):e95514. [DOI] [PMC free article] [PubMed] [Google Scholar]
- 14.Gao Y, Dickerson JB, Guo F, Zheng J, Zheng Y. Rational design and characterization of a Rac GTPase-specific small molecule inhibitor. Proc Natl Acad Sci USA. 2004;101(20):7618–7623. [DOI] [PMC free article] [PubMed] [Google Scholar]
- 15.Wang C, Wu X, Shen F, Li Y, Zhang Y, Yu D. Shlnc-EC6 regulates murine erythroid enucleation by Rac1-PIP5K pathway. Dev Growth Differ. 2015;57(6):466–473. [DOI] [PubMed] [Google Scholar]
- 16.McGrath KE, Bushnell TP, Palis J. Multispectral imaging of hematopoietic cells: where flow meets morphology. J Immunol Methods. 2008;336(2):91–97. [DOI] [PMC free article] [PubMed] [Google Scholar]
Associated Data
This section collects any data citations, data availability statements, or supplementary materials included in this article.


