

Abstract
We screened DNA sequence variants on an exome-focused genotyping array in >300,000 participants with replication in >280,000 participants and identified 444 independent variants in 250 loci significantly associated with total cholesterol (TC), high-density lipoprotein cholesterol (HDL-C), low-density lipoprotein cholesterol (LDL-C), and/or triglycerides (TG). At two loci (JAK2 and A1CF), experimental analysis in mice revealed lipid changes consistent with the human data. We utilized mapped variants to address four clinically relevant questions and found the following: (1) beta-thalassemia trait carriers displayed lower TC and were protected from coronary artery disease; (2) outside of the CETP locus, there was not a predictable relationship between plasma HDL-C and risk for age-related macular degeneration; (3) only some mechanisms of lowering LDL-C seemed to increase risk for type 2 diabetes; and (4) TG-lowering alleles involved in hepatic production of TG-rich lipoproteins (e.g., TM6SF2, PNPLA3) tracked with higher liver fat, higher risk for type 2 diabetes, and lower risk for coronary artery disease whereas TG-lowering alleles involved in peripheral lipolysis (e.g., LPL, ANGPTL4) had no effect on liver fat but lowered risks for both type 2 diabetes and coronary artery disease.
Plasma lipid levels are modifiable risk factors for atherosclerotic cardiovascular disease. Genome-wide association studies (GWAS) testing common DNA sequence variation have uncovered 175 genetic loci affecting lipid levels1 in the population2–8. These findings have informed biology of lipoproteins and elucidated the causal roles of lipid levels on cardiovascular disease9–12. Here, we build on these previous efforts to: 1) perform an exome-wide association screen for plasma lipids in >300,000 individuals; 2) evaluate discovered alleles experimentally; and 3) test the inter-relationship of mapped lipid variants with coronary artery disease (CAD), age-related macular degeneration (AMD), fatty liver, and type 2 diabetes (T2D).
We tested the association of genotypes from the HumanExome BeadChip (i.e., exome array) with lipid levels in 73 studies encompassing >300,000 participants (Supplementary Material, Supplementary Tables 1–3) across several ancestries with the maximal sample sizes being 237,050 for European, 16,935 for African, 37,613 for South Asian, and 5,082 for Hispanic or other. A companion manuscript describes results for 47,532 East Asian participants13. A total of 242,289 variants were analyzed after quality control, about one-third of which are non-synonymous with minor allele frequency (MAF) < 0.1% (Supplementary Table 4).
Single-variant association statistics and linkage disequilibrium information summarized across 1 megabase sliding windows were generated from each cohort using RAREMETALWORKER or RVTESTS14,15 software. Meta-analyses of single variant and gene-level association tests were performed using rareMETALS (version 6.0). Genomic control values for meta-analysis results were between 1.09 and 1.14 for all four traits (Supplementary Figure 1), suggesting that population structure in our analysis is well-controlled4,16.
We identified 1,445 single variants associated at P<2.1×10⁻⁷ (Bonferroni correction of 242,289 variants analyzed) (Supplementary Figures 2–5). Full association results are available (see URLs). Of these, 75 were ‘novel’ [i.e. located at least 1 megabase from previously reported GWAS signals]: 35 of these were protein-altering variants and 40 were non-coding variants (Table 1, Supplementary Tables 5–7). The MAF of the lead variant was >5% at 61 of these 75 loci. European ancestry participants provided the most significant associations for the 75 novel loci, with the exception of two LDL associated variants (rs201148465 and rs147032017) which were driven by the South Asian participants (Supplementary Table 8). Gene-level association analyses revealed an additional five genes where the signal was driven by multiple rare variants (P <4.2×10⁻⁷, Bonferroni correction threshold for performing 5 tests on ~20,000 genes, Supplementary Table 9).
Table 1.
Protein-altering variants at novel loci associated with lipid levels
| Chromosome:position (hg19) | rs ID | Alleles (reference/alternative) | Gene | Protein change | N | Frequency alternative allele | Trait | P value | Beta | SE |
|---|---|---|---|---|---|---|---|---|---|---|
| Total Cholesterol | ||||||||||
| 2:101627925 | rs1062062 | C/T | TBC1D8 | p.Gly954Arg | 292898 | 0.12 | TC | 1×10⁻⁷ | −0.021 | 0.0040 |
| 4:69343287 | rs976002 | A/G | TMPRSS11E | p.Tyr303Cys | 293961 | 0.23 | TC LDL-C |
5×10⁻²⁰ 3×10⁻¹² |
0.029, 0.023 |
0.0031, 0.0033 |
| 4:155489608 | rs6054 | C/T | FGB | p.Pro206Leu | 307997 | 0.0038 | TC TG |
5×10⁻¹² 3×10⁻¹¹ |
0.14, 0.14 |
0.021, 0.021 |
| 9:5073770 | rs77375493 | G/T | JAK2 | p.Val617Phe | 188412 | 0.0011 | TC LDL-C |
1×10⁻¹¹ 2×10⁻⁹ |
−0.32, −0.30 |
0.047, 0.049 |
| 9:117166246 | rs2274159 | A/G | DFNB31 | p.Val400Ala | 319677 | 0.48 | TC | 2×10⁻⁷ | 0.013 | 0.0026 |
| 17:8216468 | rs871841 | T/C | ARHGEF15 | p.Leu277Pro | 298725 | 0.52 | TC | 2×10⁻⁸ | 0.015 | 0.0026 |
| 19:18304700 | rs874628 | A/G | MPV17L2 | p.Met72Val | 319677 | 0.26 | TC | 2×10⁻⁷ | 0.015 | 0.0029 |
| LDL Cholesterol | ||||||||||
| 1:155106227 | rs4745 | A/T | EFNA1 | p.Asp137Val | 291361 | 0.49 | LDL-C | 5×10⁻⁸ | −0.015 | 0.0027 |
| 4:187120211 | rs13146272 | C/A | CYP4V2 | p.Gln259Lys | 295826 | 0.62 | LDL-C | 1×10⁻⁷ | −0.015 | 0.0027 |
| 5:176520243 | rs351855 | G/A | FGFR4 | p.Gly388Arg | 233058 | 0.29 | LDL-C | 4×10⁻⁸ | −0.018 | 0.0033 |
| 9:139368953 | rs3812594 | G/A | SEC16A | p.Arg1039Cys | 293723 | 0.24 | LDL-C | 2×10⁻⁸ | −0.018 | 0.0031 |
| 10:118397971 | rs10885997 | A/G | PNLIPRP2 | p.Gln387Arg | 258146 | 0.41 | LDL-C | 9×10⁻⁸ | 0.015 | 0.0029 |
| 10:124610027 | rs1891110 | G/A | FAM24B | p.Pro2Leu | 295826 | 0.55 | LDL-C TC |
8×10⁻¹⁵ 2×10⁻¹³ |
0.021, 0.019 |
0.0026, 0.0025 |
| 12:72179446 | rs61754230 | C/T | RAB21 | p.Ser224Phe | 292762 | 0.015 | LDL-C | 1×10⁻⁷ | 0.057 | 0.011 |
| 14:94844947 | rs28929474 | C/T | SERPINA1 | p.Glu366Lys | 290263 | 0.015 | LDL-C TC |
4×10⁻¹⁴ 6×10⁻¹⁴ |
0.081, 0.078 |
0.011, 0.010 |
| 17:26694861 | rs704 | G/A | VTN | p.Thr400Met | 295826 | 0.49 | LDL-C TC |
6×10⁻¹⁶ 1×10⁻⁸ |
0.021, 0.015 |
0.0026, 0.0025 |
| 19:42584958 | rs201596848 | C/T | ZNF574 | p.Arg734Cys | 273744 | 0.0014 | LDL-C | 5×10⁻¹² | −0.255 | 0.037 |
| Triglycerides | ||||||||||
| 2:202122995 | rs3769823 | A/G | CASP8 | p.Lys14Arg | 295956 | 0.69 | TG | 1×10⁻⁹ | 0.017 | 0.0028 |
| 5:131008194 | rs26008 | T/C | FNIP1 | p.Gln620Arg | 305699 | 0.92 | TG | 5×10⁻⁹ | −0.028 | 0.0048 |
| 10:52573772 | rs41274050 | C/T | A1CF | p.Gly398Ser | 299984 | 0.0072 | TG TC |
4×10⁻¹¹ 1×10⁻⁷ |
0.10, 0.08 |
0.015, 0.015 |
| 13:45970147 | rs138358301 | A/G | SLC25A30 | p.Phe280Leu | 301087 | 0.0035 | TG | 3×10⁻¹¹ | 0.15 | 0.022 |
| 15:40751555 | rs3803357 | C/A | BAHD1 | p.Gln298Lys | 305699 | 0.55 | TG | 1×10⁻¹⁰ | −0.017 | 0.0026 |
| 17:17409560 | rs7946 | C/T | PEMT | p.Val212Met | 304420 | 0.67 | TG | 1×10⁻⁸ | −0.016 | 0.0029 |
| 20:56140439 | rs41302559 | G/A | PCK1 | p.Arg483Gln | 299984 | 0.0021 | TG | 9×10⁻⁸ | −0.154 | 0.029 |
| 22:17625915 | rs35665085 | G/A | CECR5 | p.Thr149Met | 302582 | 0.050 | TG | 5×10⁻⁸ | 0.032 | 0.0059 |
| HDL Cholesterol | ||||||||||
| 2:272203 | rs11553746 | C/T | ACP1 | p.Thr95Ile | 313148 | 0.33 | HDL-C | 5×10⁻⁸ | 0.015 | 0.0027 |
| 2:54482553 | rs17189743 | G/A | TSPYL6 | p.Arg246Cys | 314415 | 0.029 | HDL-C | 2×10⁻⁷ | 0.040 | 0.0076 |
| 2:179309165 | rs75862065 | G/A | PRKRA | p.Pro116Leu | 105490 | 0.29 | HDL-C | 2×10⁻⁷ | 0.026 | 0.0050 |
| 3:48229366 | rs146179438 | C/A | CDC25A | p.Gln25His | 288306 | 0.020 | HDL-C | 3×10⁻¹¹ | −0.063 | 0.0095 |
| 5:176637576 | rs28932178 | T/C | NSD1 | p.Ser457Pro | 310567 | 0.17 | HDL-C | 8×10⁻⁹ | 0.020 | 0.0035 |
| 11:64031241 | rs35169799 | C/T | PLCB3 | p.Ser778Leu | 314415 | 0.060 | HDL-C TG |
4×10⁻¹³, 3×10⁻¹² |
−0.039, 0.038 |
0.0054, 0.0055 |
| 11:68703959 | rs622082 | A/G | IGHMBP2 | p.Thr671Ala | 316391 | 0.31 | HDL-C | 6×10⁻¹⁰ | −0.017 | 0.0028 |
| 16:4755108 | rs78074706 | G/A | ANKS3 | p.Arg286Trp | 315298 | 0.022 | HDL-C | 1×10⁻⁹ | −0.053 | 0.0087 |
| 16:69385641 | rs76116020 | A/G | TMED6 | p.Phe6Leu | 310822 | 0.033 | HDL-C | 7×10⁻⁹ | −0.041 | 0.0071 |
| 17:40257163 | rs2074158 | T/C | DHX58 | p.Gln425Arg | 244331 | 0.19 | HDL-C | 1×10⁻⁷ | −0.020 | 0.0038 |
We sought replication in up to 286,268 independent participants from three studies – Nord-Trøndelag Health Study17, (HUNT; max n = 62,168), Michigan Genomics Initiative (MGI; max n = 6,411, see URLs) and the Million Veteran Program18 (MVP; max n = 218,117). Of the novel primary trait associations, 73/73 associations were directionally consistent (Supplementary Table 10); two SNPs were not available for replication (rs201148465, rs75862065). Furthermore, we were able to replicate the associations of 66/73 (90%) at α=0.05.
At any given genetic locus, multiple variants may independently contribute to plasma lipid levels. We quantified this phenomenon by iteratively performing association analyses conditional on the top variants at each locus. We identified 444 variants independently associated with one or more of the four lipid traits in 75 novel and 175 previously implicated loci (Supplementary Figure 6; Supplementary Table 11–12).
The identification of lipid-associated coding variants may help refine association signals at previously identified GWAS loci. We were able to evaluate this possibility in 131 of the 175 previously reported GWAS loci where the index or proxy variant was available on the exome array, and associated with lipids levels with P<2.1×10⁻⁷ (Supplementary Table 13–14). For example, an intronic SNP (rs11136341, close to the PLEC gene) associated with LDL-C was the original lead SNP in its GWAS locus (P=2×10⁻¹³). In the current study, a protein-altering variant in PARP10 is the top variant in the same locus (rs11136343; Leu395Pro; P=7×10⁻²⁶). After conditioning on PARP10 Leu395Pro, the evidence for rs11136341 diminished (P = 0.02); in contrast, PARP10 Leu395Pro remained significant (P=9×10⁻¹³) after conditioning on rs11136341. PARP10 has been shown to affect the hepatic secretion of apolipoprotein B (apoB) in human hepatocytes19; these results prioritize PARP10 as a causal gene at this locus.
Experimental analysis of discovered mutations in model systems is a powerful approach to validate the results of a human genetics analysis. We prioritized two coding mutations for experimental analysis: JAK2 (Janus Kinase 2) p.Val617Phe and A1CF (APOBEC1 complementation factor) p.Gly398Ser.
JAK2 p.Val617Phe is a recurrent somatic mutation arising in hematopoietic stem cells which can lead to myeloproliferative disorders or clonal hematopoiesis of indeterminate potential20–24. We recently showed that carriage of p.Val617Phe increases with age and confers higher risk for CAD25. Surprisingly, the 617Phe allele which increases risk for CAD is associated with lower LDL-C. Mice knocked in for Jak2 p.Val617Phe were created as reported previously26. Hypercholesterolemia-prone mice that were engrafted with bone marrow obtained from Jak2 p.Val617Phe transgenic mice displayed lower total cholesterol than mice that had received control bone marrow (Supplementary Figure 7). This is consistent with our human genetic observations. The mechanism by which JAK2 p.Val617Phe leads to lower plasma TC and LDL-C but higher risk for CAD requires further study.
Another new association to emerge from genetic analyses was between A1CF p.Gly398Ser and TG [MAF 0.7%, 0.10-standard deviation (SD) increase in TG per copy of alternate allele, P=4×10⁻¹¹]; this variant was also associated with increased circulating TC (P=4×10⁻⁷) and nominally associated with increased risk of CAD (OR=1.12; P=0.02). A1CF encodes APOBEC1 complementation factor, an RNA-binding protein which facilitates the RNA-editing action of APOBEC1 on the APOB transcript27,28. We performed CRISPR-Cas9 deletion, rescue, and knock-in experiments to assess whether A1CF p.Gly398Ser is a causal mutation that alters TG metabolism.
CRISPR-Cas9-induced deletion of A1CF led to 72% and 65% reduction in secreted APOB100 compared to control cells in Huh7 and HepG2 human hepatoma cells, respectively (Figure 1A–1C; Supplementary Figure 8). These findings are consistent with previous studies in rat primary hepatocytes that also showed significantly decreased apoB secretion after RNAi-based depletion of A1CF29. Additionally, cellular APOB100 levels were significantly reduced in A1CF-deficient cells (Supplementary Figure 8B and 8C). A subsequent “rescue” experiment involving overexpression of wild-type or A1CF p.Gly398Ser in Huh7 cells with or without endogenous A1CF expression confirmed that higher APOB100 secretion in cell lines expressing A1CF p.Gly398Ser (Figure 1D).
Figure 1. A1CF p.Gly398Ser mutant leads to increased APOB100 secretion.
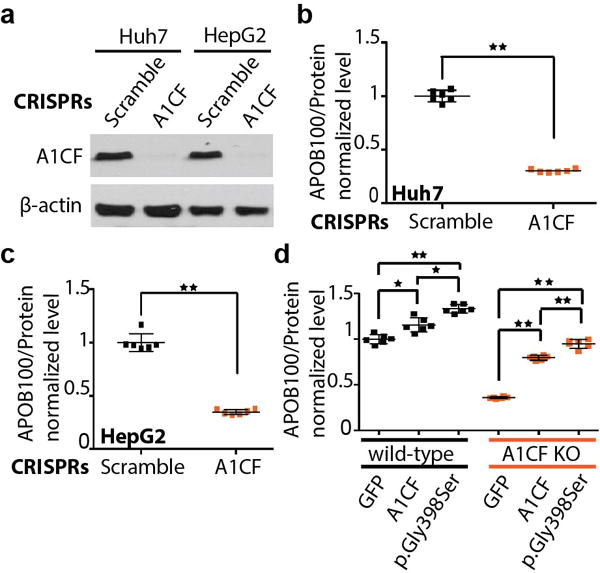
a, Western blot showing the depletion of endogenous A1CF levels via CRISPR/Cas9 system in both Huh7 and HepG2 cells. b and c, Lack of A1CF leads to reduced APOB100 secretion in Huh7 (b) and HepG2 (c) human hepatoma cells. d, Recombinantly overexpressed A1CF p.Gly398Ser variant led to significantly increased APOB100 secretion compared to A1CF or GFP control in both Huh7 wild-type and A1CF knockout cells (labeled as A1CF KO), respectively. The bars of mean value and error bars of SD are showed in b, c and d from experiments with biological replicates, N=6. Statistically significant differences are marked (*p<0.05, **p<0.01).
We sought to further validate the A1CF gene and the p.Gly398Ser variant through the use of CRISPR-Cas9 to generate knock-in mice. Using a guide RNA targeting A1cf exon 9, the site of the codon for p.Gly398, and a 162-nucleotide single-strand DNA oligonucleotide repair template containing the p.Gly398Ser variant as well as extra synonymous changes to prevent re-cleavage by CRISPR-Cas9, we generated mice of the C57BL/6J inbred background with an A1cf Gly398Ser allele (hereafter referred to as KI) (Supplementary Figure 9A, 9B). We bred the KI allele to homozygosity and found that KI/KI mice were viable and healthy. We compared wild-type and KI/KI colony mates (n=9, 8) with respect to TG levels (Supplementary Figure 9C, 9D). We found that KI/KI mice had 46% increased TG compared to wild-type mice (P=0.05). In sum, these results indicate that A1CF is a causal gene for TG in humans and that the p.Gly398Ser variant is a causal mutation, with possible relevance to CAD.
Next, we used the 444 identified DNA sequence variants to address four clinical questions. First, a rare null mutation in the beta-globin gene (HBB; c.92+1G>A, rs33971440) associated with lower total cholesterol (Supplementary Table 15) with the strongest total cholesterol-lowering effect after null mutations in PCSK9; this raised the question of the relationship between beta-thalassemia and risk for CAD. Approximately 80 to 90 million individuals worldwide are estimated to carry a heterozygous loss-of-function HBB mutation, termed beta-thalassemia trait30. Observational epidemiologic studies showed that beta-thalassemia trait associates with lower blood cholesterol level31,32. We find that HBB c.92+1G>A is associated with a 17 mg/dl decrease in LDL-C (95% CI: −23, −11; P=2.7×10⁻⁸) and a 21 mg/dl decrease in TC (95% CI: −27, −14; P=8.9×10⁻¹¹) (Supplementary Figure 10). In an analysis of 31,156 CAD cases and 65,787 controls, carriers of loss-of-function variants in HBB were protected against CAD (odds ratio for CAD, 0.70; 95% CI 0.54, 0.90; P=0.005, Supplementary Figure 11). Of note, in Supplementary Table 15, we provide results for null mutations where association P<0.001 for any of the four lipid traits.
Second, DNA sequence variants in the CETP gene which associate with higher HDL-C also correlate with higher risk for AMD, a leading cause of blindness33–37; here, we ask if any way of increasing plasma HDL-C will predictably lead to increased AMD risk. Across 168 independent HDL-C variants with MAF > 1%, we tested the association of each HDL-C variant with AMD risk. The effect size of variant on HDL-C was positively correlated with its effect on AMD risk (correlation in effect sizes, r=0.41, P=4.4×10⁻⁸; Supplementary Table 16, Supplementary Figure 12). However, this effect was driven by the 10 independent HDL-C associated variants in CETP (heterogeneity across the different HDL-C-raising mechanisms (τ2 = 0.91, Phet=1.8×10⁻¹⁵) (Supplementary Table 17). When these 10 CETP variants were removed, there was no longer a relationship between genetically-altered HDL-C and AMD risk (P=0.17). These results suggest that outside of the CETP locus, there is not a predictable relationship between plasma HDL-C and risk for AMD.
Third, will lowering LDL-C with lipid-modifying medicines always increase risk for T2D? This question is motivated by the fact that in randomized controlled trials, statin therapy increases risk for T2D26,27 and recent reports of PCSK9 variants associating with higher risk for T2D38–40. We confirmed the association of PCSK9 p.Arg46Leu (R46L) with risk for T2D among 222,877 participants (Supplementary Table 18). We found that the 46Leu allele associated with lower LDL-C confers a 13% increased risk for T2D (OR 1.13; 95% CI 1.06–1.20; P=6.96×10⁻⁵) (Supplementary Figure 13). In addition, across 113 independent LDL-C variants at 90 distinct loci, we compared each variant’s effect on LDL-C with its subsequent effect on risk for T2D. Across the 113 variants, there is a weak inverse correlation between a variant’s effects on LDL-C and T2D (r=−0.21, p=0.025); however, there is evidence for heterogeneity in this relationship (τ2=0.50, Phet=2.5×10⁻⁹). Five LDL-C lowering genetic mechanisms had the most compelling evidence for association with higher risk for T2D (TM6SF2 p.Glu167Lys, APOE chr19:4510002, HNF4A p.Thr136Ile, PNPLA3 p.Ile148Met, and GCKR p.Leu446Pro) (P<4.0×10⁻⁴ for each, Bonferroni correction threshold for performing tests at 113 variants, Supplementary Table 19; Supplementary Figure 14). These results suggest that only some ways of lowering LDL-C are likely to increase risk for T2D.
Finally, two key processes – hepatic production and peripheral lipolysis – contribute to the blood level of TG. We asked how genes involved in hepatic production of TG-rich lipoproteins (PNPLA3, TM6SF2) differed from lipolysis pathway genes (LPL, ANGPTL4) in their impact on related metabolic traits - blood lipids, fatty liver, T2D, and CAD (Table 2). The alternative alleles at PNPLA3 p.Ile148Met, TM6SF2 p.Glu167Lys, LPL p.Ser474Ter, and ANGTPL4 p.Glu40Lys all associated with lower blood triglycerides and reduced risk for CAD. However, the blood TG-lowering alleles at PNPLA3 and TM6SF6 led to more fatty liver and higher risk for T2D. In contrast, the blood triglyceride-lowering alleles at LPL and ANGPTL4 were neutral with respect to fatty liver and led to lower risk for T2D. We confirmed the LPL observation using a phenome-wide association study in the UK Biobank (Supplementary Table 20). In UK Biobank, a one-SD decrease in TG mediated by LPL variants reduced risks for both T2D and CAD (Figure 2).
Table 2.
Impact of genes involved in hepatic production of triglyceride-rich lipoproteins (PNPLA3, TM6SF2) versus lipolysis pathway genes (LPL, ANGPTL4) on related metabolic traits - blood lipids, fatty liver, type 2 diabetes, and coronary artery disease.
| Gene | LPL | ANGPTL4 | PNPLA3 | TM6SF2 |
|---|---|---|---|---|
| Variant | p.Ser474Ter | p.Glu40Lys | p.Ile148Met | p.Glu167Lys |
| Effect Allele Frequency |
Ter 10% |
Lys 2% |
Met 23% |
Lys 7% |
| Blood triglycerides | ||||
| Effect Direction | ↓ | ↓ | ↓ | ↓ |
| Beta (CI) P |
−0.18 (−0.19,−0.17) P < 1 × 10−323 |
−0.27 (−0.29,−0.25) P = 4 × 10−175 |
−0.018 (−0.024,−0.012) P = 4 × 10⁻⁹ |
−0.12 (−0.13,−0.11) P = 4 × 10−125 |
| Blood LDL cholesterol | ||||
| Effect Direction | – | ↓ | ↓ | ↓ |
| Beta (CI) P |
0.013 (0.0052,0.021) P = 0.005 |
−0.004 (−0.024,0.016) P = 0.70 |
−0.018 (−0.024,−0.012) P = 1 × 10⁻⁸ |
−0.103 (−0.11,−0.093) P = 7 × 10−93 |
| Fatty liver | ||||
| Effect Direction | – | – | ↑ | ↑ |
| Beta* (CI) P |
0.026 (−0.035,0.087) P = 0.41 |
0.112 (−0.021,0.25) P = 0.10 |
−0.25 (−0.29,−0.2) P = 2 × 10⁻³⁰ |
−0.25 (−0.32,−0.18) P = 5 × 10⁻¹² |
| Type 2 diabetes | ||||
| Effect Direction | ↓ | ↓ | ↑ | ↑ |
| OR (CI) P |
0.95 (0.93,0.97) P = 7 × 10⁻⁹ |
0.91 (0.83,0.99) P = 1 × 10⁻⁴ |
1.04 (1.03,1.05) P = 2 × 10⁻¹⁰ |
1.07 (1.05,1.09) P = 5 × 10⁻¹² |
| Coronary artery disease | ||||
| Effect Direction | ↓ | ↓ | ↓ | ↓ |
| OR (CI) P |
0.93 (0.9,0.96) P = 4 × 10⁻⁷ |
0.85 (0.8,0.9) P = 2 × 10⁻¹⁰ |
0.96 (0.94,0.97) P = 4 × 10⁻⁸ |
0.95 (0.93,0.98) P = 3 × 10⁻⁴ |
Figure 2. Association of genetically-lowered triglycerides by LPL variants with a range of phenotypes.
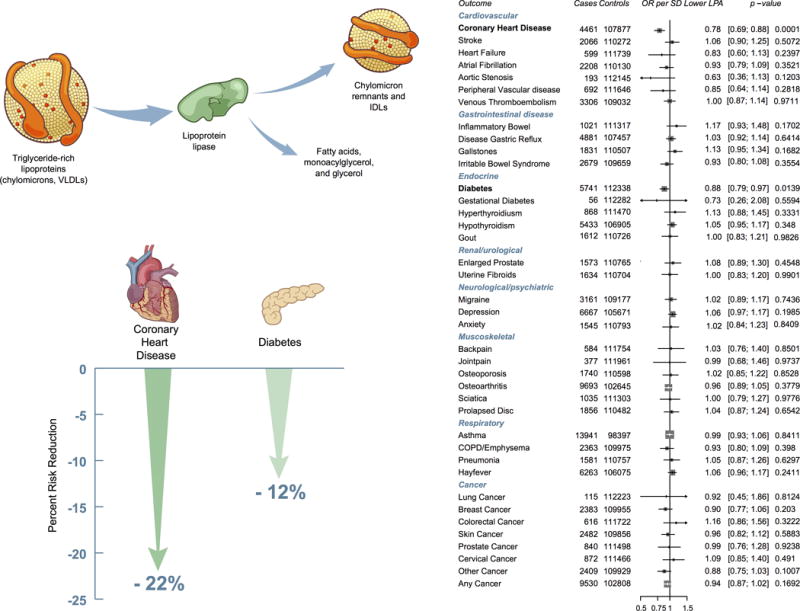
Estimates were derived in UK Biobank using logistic regression, adjusting for age, sex, ten principal components of ancestry and an indicator variable for array type. Effect estimates are for a 1 standard deviation lower plasma triglycerides. Definitions for all outcomes are provided in Supplementary Table 20.
In summary, combining large-scale human genetic analysis with experimental evidence, we demonstrate: (1) 444 independent coding and non-coding variants at 250 loci as associated with plasma lipids; (2) the use of mouse models and genome editing to pinpoint causal genes and protein-altering variants; and (3) that LPL activation can be expected to lower triglycerides and reduce risks for both CAD and T2D without increasing liver fat and thus be advantageous for patients with metabolic risk factors.
ONLINE METHODS
Study samples and phenotypes
Seventy-three studies contributed association results for exome chip genotypes and plasma lipid levels. The outcomes were fasting lipid values in mg/dl [TC, HDL-C, LDL-C, TG] from the baseline, or earlier exam with fasting measures. If a study only had non-fasting levels, then it contributed only to the TC and HDL-C analyses. LDL-C and TG analyses were only performed on fasting lipid values. Lipid-lowering therapy with statins was not routinely used prior to the publication of the 4S study in 1994 which demonstrated the clinical benefit of statin therapy. Therefore, for data collected before 1994, no lipid medication adjustment was applied. For data collected after 1994, we adjusted the TC values for individuals on lipid medication by replacing their total cholesterol values by TC/0.8; this adjustment estimates the effect of statins on TC values. No adjustment was made on HDL-C or TG. LDL-C was calculated using the Friedewald equation for those with TG < 400 mg/dl (LDL-C = TC – HDL-C – (TG/5)). If TC was modified as described above for medication use after 1994, then modified TC was used in this formula. If only measured LDL-C was available in a study, we used LDL/0.7 for those on lipid-lowering medication when data were collected after 1994. TG values were natural log transformed. For each phenotype, residuals were obtained after accounting for age, age2, sex, principal components (as needed by each study, up to four), and inverse normal transform residuals were created for analysis. For studies ascertained on CAD case/control status, the two groups were modeled as separate studies.
Genotyping and quality control
All studies assayed the Illumina or Affymetrix Human Exome array v1 or v1.1. Genotypes were determined from Zcall43 or joint calling44. Individual studies performed the following quality control: call rate, heterozygosity, gender discordance, GWAS discordance (if GWAS data available), fingerprint concordance, if available, and PCA outliers.
Association analyses
Each contributing cohort analyzed the ancestries within their cohorts separately and studies collected on case/control status analyzed cases separately from the controls. We performed both single variant and gene-level association tests. In the association analysis, we obtain residuals after controlling for sex, age, age2 and up to 4 principal components as covariates. Studies that had related samples analyzed the association using linear mixed models with relatedness estimated from genome-wide SNPs or from pedigrees.
From each study, we collected single variant score statistics and their covariance matrix for variants in sliding windows across the genome. Summary association test statistics were generated using RAREMETALWORKER or RVTESTS. Using summary association statistics collected from each study, we performed meta-analysis of single variant association tests using the Mantel-Haenszel test and constructed burden, SKAT and variable threshold tests using the approach by Liu et al15. For burden and SKAT, we used minor allele frequency thresholds of 1% and 5% and for VT, we applied minor allele frequency threshold of 5%. In the SKAT test, variants are weighted according to their minor allele frequencies, using the beta kernel β (1,25).
Using covariance matrices between single variant association statistics, we were also able to perform conditional association analyses centrally, which distinguishes genuine signals from “shadows” of known loci. Details of the methods can be found in Liu et al15.
We centrally performed quality control for the data. We aligned study reported reference and alternative alleles with alleles reported in the NHLBI Exome Sequencing Project45 and remove mis-labelled variant sites that can be strand ambiguous. For variant sites in each study, we removed variants that had call rate < 0.9 or had Hardy Weinberg P values <1×10⁻⁷. Finally, as additional checks, we visually inspected for each study the scatter plot of variant allele frequency against frequencies from ethnicity-matched populations in the 1000 Genomes Project46, and made sure that the strand and allele labels were well calibrated between studies.
Single variant associations with P < 2.1 × 10⁻⁷ (0.05/242,289 variants analyzed) and gene-based associations with P < 4.2 × 10⁻⁷ (0.05/[20,000 genes * 6 tests]) were considered significant. Novel loci were defined as being not within 1 megabase of a known lipid GWAS SNP. Additionally, linkage disequilibrium information was used to determine independent SNPs where a locus extended beyond 1 megabase. All novel loci reported in this manuscript are > 1 megabase from any previously reported locus and independent (r2 < 0.2 was required for variants within 3 megabases).
Sequential forward selection
To identify independently associated variants for each known and newly identified locus, we performed sequential forward selection. We initialized the set of independently associated variants (denoted by Φ), starting with the top association signal in the locus. For each iteration, conditioning on variants in Φ, we performed conditional association analyses for all remaining variants. If the top association signal after the conditional analysis remained significant, we added the top variant to the set Φ, and then repeated the conditional association analysis. If the top variant after the conditional analysis was no longer significant, we stopped and reported variants in the set Φ as the final set of independent variants for that locus. We used the same single variant significance threshold (P < 2.1 × 10⁻⁷) to determine statistical significance with the sequential forward selection results (Supplementary Figure 3).
Annotation
Sequence variants were annotated according to refSeq version 1.9, using the SEQMINER software (version 5.7)47. Transcript level annotations were obtained and prioritized. When multiple transcript level annotations were available, they were prioritized according to their functionality and deleteriousness. To implement gene-level association tests, the annotation with the highest priority was used (along with other filtering criteria such as minor allele frequencies) to determine the set of variants that are included.
Heritability and proportion of variance explained estimates
We estimated the proportion of variance explained by the set of 444 independently associated variants. The joint effects of variants in a locus were approximated by , where is the single variant score statistics and is the covariance matrix between them. The covariance between single variant genetic effects was approximated by the inverse of the variance-covariance matrix of score statistics, i.e. . The phenotypic variance explained by the independently associated variants in a locus is given by , where G is the genotypes of the analyzed variants.
Refinement of genome-wide association signals
We sought to quantify what proportion of GWAS loci might be due to a protein-altering variant and, therefore, directly identify a functional gene. We made the assumption that a protein-altering variant is the most likely causal variant for each region if it is the top signal, explains the signal, or is independent of the original signal. To identify putative functional coding variants accounting for the effects at known lipid loci, we performed reciprocal conditional analyses to control for the effects of known lipid GWAS or coding variants within 500kb, as this was the maximum distance for variants within the covariance matrix. Loci where coding variants are the most significant signals were considered as “coding as top”. Loci where the initial GWAS variants had conditional P > 0.01 were considered to be explained by the coding variants. Loci where the coding variants had conditional P < 2.1 × 10⁻⁷ were considered to be independent of the initial GWAS signals.
JAK2 p.Val617Phe and plasma cholesterol in a mouse model
Jak2 p.Val617Phe MxCre mice were created and reported previously26. Bone marrow cells from the WT or JAK2 p.Val617Phe MxCre mice, both treated with poly I:C, were transplanted into irradiated Ldlr−/− recipients. After four weeks of recovery, the Ldlr−/− recipient mice were fed a Western diet (TD88137, Harlan Teklad) for 8 weeks. Plasma was collected and 250 microliter of polled plasma from 7 WT→Ldlr−/− or 7 Jak2 Val617Phe→Ldlr−/− recipient was subjected to fast protein liquid chromatography on Sepharose CL-6B size exclusion column. Total cholesterol content in each fraction was assessed by Cholesterol E kit (Wako Diagnostics).
Validation of A1CF with CRISPR-Cas9 in human cells
To knock out A1CF in Huh7 and HepG2 human hepatoma cells, three CRISPRs (Supplementary Table 21) targeting exon 4 of the A1CF gene were constructed by using the lentiviral vector lentiGuide-Puro. Packaged viruses were used to transduce the cells expressing Cas9 for 16 hours. Subsequently, cells were cultured in the presence of 5 μg/ml puromycin for five days before splitting for assays. Cells for APOB secretion assay were cultured for 18 hours in serum-free medium, then the amount of APOB100 in medium was measured using an ELISA kit (MABTECH) according to the manufacturer’s instructions.
In a rescue experiment, to avoid cutting of the A1CF coding region on the recombinant plasmids by previously designed exon-targeting CRISPRs, four new CRISPRs targeting introns flanking exon 4 were applied to deplete endogenous A1CF. The sequences for those sgRNAs are available in Supplementary Table 21. The A1CF p.Gly398Ser variant was generated by using overlapping PCR and confirmed by Sanger sequencing. Both wild-type and the A1CF p.Gly398Ser variant were constructed into lentiviral plasmids, respectively. After transduction, cells were cultured for 48 hours in the presence of 100 ng/ml doxycycline to induce recombinant expression of A1CF or p.Gly398Ser variant before performing different assays.
A1cf p.Gly390Ser knock-in mice
All procedures used for animal studies were approved by Harvard University’s Faculty of Arts and Sciences Institutional Animal Care and Use Committee and were consistent with local, state, and federal regulations as applicable. Knock-in mice were generated using a guide RNA designed to target the orthologous site of the A1CF p.Gly390Ser variant. In vitro transcribed Cas9 mRNA (100 ng/μL; TriLink BioTechnologies) and guide RNA (50 ng/μL) were co-injected with 100 ng/μL single-strand DNA oligonucleotide (Integrated DNA Technologies): (Supplementary Table 21) into the cytoplasm of fertilized oocytes from C57BL/6J mice. Genomic DNA samples from founder mice were screened for knock-in mutations by PCR and confirmed by Sanger sequencing. Positive mice were bred with C57BL/6J mice to generate wild-type and homozygous knock-in mice. Male colony mates at 12 weeks of age were used for lipid measurements. Blood samples were collected from the lateral tail vein following an overnight fast. Plasma triglyceride levels were measured using Infinity Triglycerides Reagent (Thermo Fisher) according to the manufacturers’ instructions.
Intersection of lipid association signals with AMD, CAD, and T2D
To estimate the association of loss-of-function variants in HBB with cholesterol levels, participants from the following two consortia were studied: the Global Lipids Genetics Consortium and the Myocardial Infarction Genetics Consortium (MIGen, 27,939 participants in 12 cohorts). A rare loss-of-function variant in HBB (c.92+1G>A, rs33971440) was genotyped in participants from the Global Lipids Genetics Consortium Exome consortium. This variant was pooled with sequence data for the HBB gene in MIGen, available in 19,434 participants with blood cholesterol measurements. The association of loss-of-function variants with cholesterol was estimated using linear regression with adjustment for age, sex and up to five principal components of ancestry. Estimates from genotyped and sequence data were pooled using inverse variance weighted fixed effects meta-analysis.
To estimate the association of loss-of-function variants in HBB with CAD, participants from the following two consortia were studied: the CARDIoGRAM Exome Consortium (69,087 participants from 20 studies) and MIGen (12,384 CAD cases and 15,547 controls from 12 studies). 69,086 individuals who were genotyped for the c.92+1G>A variant in CARDIoGRAM Exome were pooled with sequence data for HBB from 27,931 individuals in MIGen. The association of loss-of-function variants with CAD was estimated using logistic regression with adjustment for age, sex and up to five principal components of ancestry. Estimates were pooled using inverse variance weighted fixed effects meta-analysis. To estimate the association of loss of function variants in HBB with hemoglobin and hematocrit levels, estimates from an exome chip analysis of red blood cell traits (24,814 individuals) were used8.
For 168 variants independently and significantly associated with HDL-C and a MAF > 1%, we looked up the association evidence in 16,144 AMD cases and 17,832 controls with exome chip genotypes48.
For 132 independently and significantly associated LDL-C variants and MAF > 1%, we looked up the association evidence in: (1) up to 120,575 individuals with and without CAD and exome chip genotypes (42,335 cases and 78,240 controls)42; and (2) up to 69,870 individuals with and without type 2 diabetes. Only 113 of the 132 LDL variants were available in the type 2 diabetes results. We used a Bonferroni correction for 132 variants to determine significance of the results (alpha = 4.0 × 10⁻⁴).
Association of PCSK9 R46L with type 2 diabetes
For evaluating the association of PCSK9 R46L with risk of type 2 diabetes, we considered a total of 42,011 type 2 diabetes cases and 180,834 controls from 30 studies from populations of European ancestry (Supplementary Table 18). The variant was directly genotyped in all studies using the Metabochip or the Exome array. Sample and variant quality control was performed within each study as described previously49–52. Within each study, the variant was tested for association with type 2 diabetes under an additive model after adjustment for study-specific covariates, including principal components to adjust for population structure. Association summary statistics for the variant for each study was corrected for residual population structure using the genomic control inflation factor as described previously49–51. We then combined association summary statistics for the variant across studies via fixed-effects inverse-variance weighted meta-analysis.
TG variants, lipids, fatty liver, type 2 diabetes, and CAD
Exome chip results for four variants (LPL p.Ser474Ter [rs328], ANGPTL4 p.Glu40Lys [rs116843064], PNPLA3 p.Ile148Met [rs738409], and TM6SF2 p.Glu167Lys [rs58542926]) were obtained from the following sources:
lipids: current analysis
fatty liver: Between 2002 and 2005, 1,400 individuals from the Framingham Offspring Study and 2,011 individuals from third generation underwent multi-detector computed tomograms (CT) on which we evaluated liver attenuation as previously described53. We tested the association of TG variants with CT liver fat after inverse normal transformation. Covariates in the regression models included age, age2, and gender. A similar analysis was conducted in 3,293 participants of European ancestry from BioImage study54. Association results for liver attenuation from the Framingham and BioImage studies were combined through fixed-effects inverse-variance weighted meta-analysis.
type 2 diabetes: ExTexT2D Consortium41
CAD: published results from the Myocardial Infarction Genetics and CARDIoGRAM Exome Consortia study42 and analysis of the UK Biobank combined through meta-analysis.
Supplementary Material
Acknowledgments
Dajiang J Liu is partially supported by R01HG008983, R21DA040177, and R01DA037904. Gina M Peloso is supported by the National Heart, Lung, and Blood Institute of the National Institutes of Health under Award Number K01HL125751. Aniruddh P. Patel is recipient of research fellowship from Stanley J. Sarnoff Cardiovascular Research Foundation. Hayato Tada is supported by a grant from the Japanese Circulation Society to study in the United States. The research was supported by the National Institute for Health Research (NIHR) Exeter Clinical Research Facility, and ERC grant to Timothy M. Frayling 323195; SZ-245 50371-GLUCOSEGENES-FP7-IDEAS-ERC. EKS is supported by NIH grants R01 DK106621, R01 DK107904, The University of Michigan Biological Sciences Scholars Program, and The University of Michigan Department of Internal Medicine. Tim Spector is holder of an ERC Advanced Principal Investigator award. Andrew P Morris is a Wellcome Trust Senior Fellow in Basic Biomedical Science (grant number WT098017). Y. Eugene Chen is supported by HL117491 and HL129778. Santhi K. Ganesh is supported by HL122684. Paul L. Auer was supported by NHLBI R21 HL121422-02. Claudia Langenberg, Nick J. Wareham, and Robert A. Scott acknowledge funding from the Medical Research Council, UK (MC_UU_12015/1). John Danesh is a British Heart Foundation Professor, European Research Council Senior Investigator, and National Institute for Health Research (NIHR) Senior Investigator. Cristen J. Willer is supported by HL094535 and HL109946. SK is supported by a research scholar award from the Massachusetts General Hospital, the Donovan Family Foundation, and R01 HL127564; he has received grants from Bayer Healthcare, Aegerion Pharmaceuticals, and Regeneron Pharmaceuticals; and consulting fees from Merck, Novartis, Sanofi, AstraZeneca, Alnylam Pharmaceuticals, Leerink Partners, Noble Insights, Quest Diagnostics, Genomics PLC, and Eli Lilly and Company; and holds equity in San Therapeutics and Catabasis Pharmaceuticals.
The views expressed in this manuscript are those of the authors and do not necessarily represent the views of the National Heart, Lung, and Blood Institute; the National Institutes of Health; or the U.S. Department of Health and Human Services.
This research has been conducted using the UK Biobank Resource.
All other authors have reported that they have no relationships relevant to the contents of this paper to disclose.
Funding support for participating studies in the meta-analysis can be found in the Supplemental Material.
Footnotes
URLs
1. Full meta-analysis results are available at http://csg.sph.umich.edu/abecasis/public/lipids2017/
2. Michigan Genomics Initiative (www.michigangenomics.org)
Author Contributions:
All authors contributed to and approved the results and comments on the manuscript.
Writing Group: C.J.W., D.J.L, G.M.P, G.A, P.D., X.L, S.K.
Study supervision: S.K.
Primary Analysis: D.J.L, G.M.P
Secondary Analysis: A.K, A.Mahajan, C.M.M, C.E, D.J.R, D.R, D.P, .E.K.S, E.M.S, J.B.M, J.Wessel, L.F, M.G, M.I.M, M.Boehnke, N.Stitziel, R.S.S, S.Somayajula, X.L
Functional Characterization: A.R.T, C.Cowan, H.Yu, K.M, N.W, X.W
Contributed to Study Specific Analysis: A.B, A.C.A, A.C.M, A.D, A.F, A.K.M, A.Langsted, A.Linneberg, A.Malarstig, A.Manichaikul, A.Maschio, A.Metspalu, A.Mulas, A.P, A.P.M, A.P.P, A.P.R, A.R, A.T, A.U.J, A.V, A.V.S, A.Y.C, B.G.N, B.H.S, B.M.P, C.Christensen, C.G, C.H, C.J.O, C.J.W, C.L, C.L.K, C.M.B, C.M.S, C.NA.P, C.P, D.Alam, D.Arveiler, D.C.L, D.I.C, D.J.L, D.K, D.M.R, D.S, E.B, E.C, E.d.A, E.M, E.P.B, E.Z, F.B, F.C, F.G, F.Karpe, F.Kee, F.R, G.B.J, G.Davies, G.Dedoussis, G.E, G.M.P, G.P, H.A.K, H.G, H.M.S, H.R.W, H.Tada, H.Tang, H.Yaghootkar, H.Z, I.B, I.F, I.J.D, I.R, J.W.B, J.C.B, J.C.C, J.C.D, J.D, J.D.R, J.F, J.G.W, J.H, J.I.R, J.J, J.K, J.M.C, J.M.H, J.M.J, J.M.O, J.M.S, J.N, J.N.H, J.S.K, J.Tardif, J.Tuomilehto, J.V, J.Weinstock, J.W.J, K.D.T, K.E.S, K.H, K.K, K.S, K.S.S, L.A.C, L.A.L, L.E.B, L.G, L.J.L, L.S, M.Benn, M.Brown, M.C, M.D, M.E.G, M.E.J, M.Ferrario, M.F.F, M.Fornage, M.J, M.J.N, M.L, M.L.G, M.M, M.O, M.P, M.W, M.X, M.Z, N.G, N.G.M, N.J.S, N.J.W, N.P, N.R.R, N.R.v.Z, N.Sattar, N.S.Z, O.L.H, O.M, O.Pedersen, O.Polasek, P.A, P.B.M, P.D, P.E.W, P.F, P.L.A, P.Mäntyselkä, P.M.R, P.Muntendam, P.R.K, P.Sever, P.S.T, P.Surendran, P.W.F, P.W.W, R.A.S, R.C, R.F, R.J.L, R.M, R.R, R.Y, S, S.F.N, S.J, S.Kanoni, S.Kathiresan, S.K.G, S.M.D, S.Sanna, S.Sivapalaratnam, S.S.R, S.T, T.B.H, T.D.S, T.Ebeling, T.E.c, T.Esko, T.H, T.L.A, T.Lakka, T.Lauritzen, T.M.F, T.V.V, U.B, V.F, V.G, V.S, W.G, W.Zhang, W.Zhou, X.S, Y.E.C, Y.H, Y.I.C, Y.L, Y.Zhang, Y.Zhou
Data Availability Statement
The meta-analysis summary association statistics that support the findings of this study are available from http://csg.sph.umich.edu/abecasis/public/lipids2017/
References
- 1.Loh PR, et al. Efficient Bayesian mixed-model analysis increases association power in large cohorts. Nat Genet. 2015;47:284–90. doi: 10.1038/ng.3190. [DOI] [PMC free article] [PubMed] [Google Scholar]
- 2.Teslovich TM, et al. Biological, clinical and population relevance of 95 loci for blood lipids. Nature. 2010;466:707–13. doi: 10.1038/nature09270. [DOI] [PMC free article] [PubMed] [Google Scholar]
- 3.Asselbergs FW, et al. Large-scale gene-centric meta-analysis across 32 studies identifies multiple lipid loci. Am J Hum Genet. 2012;91:823–38. doi: 10.1016/j.ajhg.2012.08.032. [DOI] [PMC free article] [PubMed] [Google Scholar]
- 4.Global Lipids Genetics Consortium et al. Discovery and refinement of loci associated with lipid levels. Nat Genet. 2013;45:1274–83. doi: 10.1038/ng.2797. [DOI] [PMC free article] [PubMed] [Google Scholar]
- 5.Albrechtsen A, et al. Exome sequencing-driven discovery of coding polymorphisms associated with common metabolic phenotypes. Diabetologia. 2013;56:298–310. doi: 10.1007/s00125-012-2756-1. [DOI] [PMC free article] [PubMed] [Google Scholar]
- 6.Peloso GM, et al. Association of low-frequency and rare coding-sequence variants with blood lipids and coronary heart disease in 56,000 whites and blacks. American Journal of Human Genetics. 2014;94:223–232. doi: 10.1016/j.ajhg.2014.01.009. [DOI] [PMC free article] [PubMed] [Google Scholar]
- 7.Surakka I, et al. The impact of low-frequency and rare variants on lipid levels. Nat Genet. 2015;47:589–97. doi: 10.1038/ng.3300. [DOI] [PMC free article] [PubMed] [Google Scholar]
- 8.Tang CS, et al. Exome-wide association analysis reveals novel coding sequence variants associated with lipid traits in Chinese. Nat Commun. 2015;6:10206. doi: 10.1038/ncomms10206. [DOI] [PMC free article] [PubMed] [Google Scholar]
- 9.Musunuru K, et al. From noncoding variant to phenotype via SORT1 at the 1p13 cholesterol locus. Nature. 2010;466:714–9. doi: 10.1038/nature09266. [DOI] [PMC free article] [PubMed] [Google Scholar]
- 10.Burkhardt R, et al. Trib1 is a lipid- and myocardial infarction-associated gene that regulates hepatic lipogenesis and VLDL production in mice. J Clin Invest. 2010;120:4410–4. doi: 10.1172/JCI44213. [DOI] [PMC free article] [PubMed] [Google Scholar]
- 11.Voight BF, et al. Plasma HDL cholesterol and risk of myocardial infarction: a mendelian randomisation study. Lancet. 2012;380:572–80. doi: 10.1016/S0140-6736(12)60312-2. [DOI] [PMC free article] [PubMed] [Google Scholar]
- 12.Do R, et al. Common variants associated with plasma triglycerides and risk for coronary artery disease. Nat Genet. 2013;45:1345–52. doi: 10.1038/ng.2795. [DOI] [PMC free article] [PubMed] [Google Scholar]
- 13.Lu X, et al. Exome chip meta-analysis identifies novel loci and East Asian-specific coding variants contributing to lipid levels and coronary artery disease. Nature Genetics. 2017 doi: 10.1038/ng.3978. [DOI] [PMC free article] [PubMed] [Google Scholar]
- 14.Feng S, Liu D, Zhan X, Wing MK, Abecasis GR. RAREMETAL: fast and powerful meta-analysis for rare variants. Bioinformatics. 2014;30:2828–9. doi: 10.1093/bioinformatics/btu367. [DOI] [PMC free article] [PubMed] [Google Scholar]
- 15.Liu DJ, et al. Meta-analysis of gene-level tests for rare variant association. Nat Genet. 2014;46:200–4. doi: 10.1038/ng.2852. [DOI] [PMC free article] [PubMed] [Google Scholar]
- 16.Locke AE, et al. Genetic studies of body mass index yield new insights for obesity biology. Nature. 2015;518:197–206. doi: 10.1038/nature14177. [DOI] [PMC free article] [PubMed] [Google Scholar]
- 17.Holmen OL, et al. Systematic evaluation of coding variation identifies a candidate causal variant in TM6SF2 influencing total cholesterol and myocardial infarction risk. Nat Genet. 2014;46:345–51. doi: 10.1038/ng.2926. [DOI] [PMC free article] [PubMed] [Google Scholar]
- 18.Klarin D et al. Genetics of lipids in >300,000 participants in the Million Veteran Program. Under Review [Google Scholar]
- 19.Shen X, et al. Identification of genes affecting apolipoprotein B secretion following siRNA-mediated gene knockdown in primary human hepatocytes. Atherosclerosis. 2012;222:154–7. doi: 10.1016/j.atherosclerosis.2012.02.012. [DOI] [PubMed] [Google Scholar]
- 20.Baxter EJ, et al. Acquired mutation of the tyrosine kinase JAK2 in human myeloproliferative disorders. Lancet. 2005;365:1054–61. doi: 10.1016/S0140-6736(05)71142-9. [DOI] [PubMed] [Google Scholar]
- 21.James C, et al. A unique clonal JAK2 mutation leading to constitutive signalling causes polycythaemia vera. Nature. 2005;434:1144–8. doi: 10.1038/nature03546. [DOI] [PubMed] [Google Scholar]
- 22.Kralovics R, et al. A gain-of-function mutation of JAK2 in myeloproliferative disorders. N Engl J Med. 2005;352:1779–90. doi: 10.1056/NEJMoa051113. [DOI] [PubMed] [Google Scholar]
- 23.Levine RL, et al. Activating mutation in the tyrosine kinase JAK2 in polycythemia vera, essential thrombocythemia, and myeloid metaplasia with myelofibrosis. Cancer Cell. 2005;7:387–97. doi: 10.1016/j.ccr.2005.03.023. [DOI] [PubMed] [Google Scholar]
- 24.Jaiswal S, et al. Age-related clonal hematopoiesis associated with adverse outcomes. N Engl J Med. 2014;371:2488–98. doi: 10.1056/NEJMoa1408617. [DOI] [PMC free article] [PubMed] [Google Scholar]
- 25.Jaiswal S, et al. Clonal hematopoiesis and risk of atherosclerotic cardiovascular disease. N Engl J Med. 2017;377:111–121. doi: 10.1056/NEJMoa1701719. [DOI] [PMC free article] [PubMed] [Google Scholar]
- 26.Mullally A, et al. Physiological Jak2V617F expression causes a lethal myeloproliferative neoplasm with differential effects on hematopoietic stem and progenitor cells. Cancer Cell. 2010;17:584–96. doi: 10.1016/j.ccr.2010.05.015. [DOI] [PMC free article] [PubMed] [Google Scholar]
- 27.Lellek H, et al. Purification and molecular cloning of a novel essential component of the apolipoprotein B mRNA editing enzyme-complex. J Biol Chem. 2000;275:19848–56. doi: 10.1074/jbc.M001786200. [DOI] [PubMed] [Google Scholar]
- 28.Mehta A, Kinter MT, Sherman NE, Driscoll DM. Molecular cloning of apobec-1 complementation factor, a novel RNA-binding protein involved in the editing of apolipoprotein B mRNA. Mol Cell Biol. 2000;20:1846–54. doi: 10.1128/mcb.20.5.1846-1854.2000. [DOI] [PMC free article] [PubMed] [Google Scholar]
- 29.Galloway CA, Ashton J, Sparks JD, Mooney RA, Smith HC. Metabolic regulation of APOBEC-1 complementation factor trafficking in mouse models of obesity and its positive correlation with the expression of ApoB protein in hepatocytes. Biochim Biophys Acta. 2010;1802:976–85. doi: 10.1016/j.bbadis.2010.06.003. [DOI] [PMC free article] [PubMed] [Google Scholar]
- 30.Galanello R, Origa R. Beta-thalassemia. Orphanet J Rare Dis. 2010;5:11. doi: 10.1186/1750-1172-5-11. [DOI] [PMC free article] [PubMed] [Google Scholar]
- 31.Fessas P, Stamatoyannopoulos G, Keys A. Serum-cholesterol and thalassemia trait. Lancet. 1963;1:1182–3. doi: 10.1016/s0140-6736(63)92478-4. [DOI] [PubMed] [Google Scholar]
- 32.Sidore C, et al. Genome sequencing elucidates Sardinian genetic architecture and augments association analyses for lipid and blood inflammatory markers. Nat Genet. 2015;47:1272–81. doi: 10.1038/ng.3368. [DOI] [PMC free article] [PubMed] [Google Scholar]
- 33.Chen W, et al. Genetic variants near TIMP3 and high-density lipoprotein-associated loci influence susceptibility to age-related macular degeneration. Proc Natl Acad Sci U S A. 2010;107:7401–6. doi: 10.1073/pnas.0912702107. [DOI] [PMC free article] [PubMed] [Google Scholar]
- 34.Neale BM, et al. Genome-wide association study of advanced age-related macular degeneration identifies a role of the hepatic lipase gene (LIPC) Proc Natl Acad Sci U S A. 2010;107:7395–400. doi: 10.1073/pnas.0912019107. [DOI] [PMC free article] [PubMed] [Google Scholar]
- 35.Wang YF, et al. CETP/LPL/LIPC gene polymorphisms and susceptibility to age-related macular degeneration. Sci Rep. 2015;5:15711. doi: 10.1038/srep15711. [DOI] [PMC free article] [PubMed] [Google Scholar]
- 36.Cheng CY, et al. New loci and coding variants confer risk for age-related macular degeneration in East Asians. Nat Commun. 2015;6:6063. doi: 10.1038/ncomms7063. [DOI] [PMC free article] [PubMed] [Google Scholar]
- 37.Momozawa Y, et al. Low-frequency coding variants in CETP and CFB are associated with susceptibility of exudative age-related macular degeneration in the Japanese population. Hum Mol Genet. 2016;25:5027–5034. doi: 10.1093/hmg/ddw335. [DOI] [PubMed] [Google Scholar]
- 38.Lotta LA, et al. Association between low-Density lipoprotein cholesterol-lowering genetic variants and risk of type 2 diabetes: A meta-analysis. JAMA. 2016;316:1383–1391. doi: 10.1001/jama.2016.14568. [DOI] [PMC free article] [PubMed] [Google Scholar]
- 39.Schmidt AF, et al. PCSK9 genetic variants and risk of type 2 diabetes: a mendelian randomisation study. Lancet Diabetes Endocrinol. 2016 doi: 10.1016/S2213-8587(16)30396-5. [DOI] [PMC free article] [PubMed] [Google Scholar]
- 40.Ference BA, et al. Variation in PCSK9 and HMGCR and risk of cardiovascular disease and diabetes. N Engl J Med. 2016;375:2144–2153. doi: 10.1056/NEJMoa1604304. [DOI] [PubMed] [Google Scholar]
- 41.Mahajan A, et al. Refining the accuracy of validated target identification through coding variant fine-mapping in type 2 diabetes. bioRxiv. 2017 doi: 10.1038/s41588-018-0084-1. [DOI] [PMC free article] [PubMed] [Google Scholar]
- 42.Myocardial Infarction Genetics & CARDIoGRAM Exome Consortia Investigators. Coding variation in ANGPTL4, LPL, SVEP1 and the risk of coronary disease. N Engl J Med. 2016;374:1134–44. doi: 10.1056/NEJMoa1507652. [DOI] [PMC free article] [PubMed] [Google Scholar]
- 43.Goldstein JI, et al. zCall: a rare variant caller for array-based genotyping: genetics and population analysis. Bioinformatics. 2012;28:2543–5. doi: 10.1093/bioinformatics/bts479. [DOI] [PMC free article] [PubMed] [Google Scholar]
- 44.Grove ML, et al. Best practices and joint calling of the HumanExome BeadChip: The CHARGE Consortium. PLoS One. 2013;8:e68095. doi: 10.1371/journal.pone.0068095. [DOI] [PMC free article] [PubMed] [Google Scholar]
- 45.Tennessen JA, et al. Evolution and functional impact of rare coding variation from deep sequencing of human exomes. Science. 2012;337:64–9. doi: 10.1126/science.1219240. [DOI] [PMC free article] [PubMed] [Google Scholar]
- 46.1000 Genomes Project Consortium et al. An integrated map of genetic variation from 1,092 human genomes. Nature. 2012;491:56–65. doi: 10.1038/nature11632. [DOI] [PMC free article] [PubMed] [Google Scholar]
- 47.Zhan X, Liu DJ. SEQMINER: An R-Package to Facilitate the Functional Interpretation of Sequence-Based Associations. Genet Epidemiol. 2015;39:619–23. doi: 10.1002/gepi.21918. [DOI] [PMC free article] [PubMed] [Google Scholar]
- 48.Fritsche LG, et al. A large genome-wide association study of age-related macular degeneration highlights contributions of rare and common variants. Nat Genet. 2016;48:134–43. doi: 10.1038/ng.3448. [DOI] [PMC free article] [PubMed] [Google Scholar]
- 49.Morris AP, et al. Large-scale association analysis provides insights into the genetic architecture and pathophysiology of type 2 diabetes. Nat Genet. 2012;44:981–90. doi: 10.1038/ng.2383. [DOI] [PMC free article] [PubMed] [Google Scholar]
- 50.Gaulton KJ, et al. Genetic fine mapping and genomic annotation defines causal mechanisms at type 2 diabetes susceptibility loci. Nat Genet. 2015;47:1415–25. doi: 10.1038/ng.3437. [DOI] [PMC free article] [PubMed] [Google Scholar]
- 51.Fuchsberger C, et al. The genetic architecture of type 2 diabetes. Nature. 2016;536:41–7. doi: 10.1038/nature18642. [DOI] [PMC free article] [PubMed] [Google Scholar]
- 52.The UK Biobank. Genotyping and quality control of UK Biobank, a large-scale, extensively phenotyped prospective resource. 2015 http://www.ukbiobank.ac.uk/wp-content/uploads/2014/04/UKBiobank_genotyping_QC_documentation-web.pdf.
- 53.Speliotes EK, et al. Genome-wide association analysis identifies variants associated with nonalcoholic fatty liver disease that have distinct effects on metabolic traits. PLoS Genet. 2011;7:e1001324. doi: 10.1371/journal.pgen.1001324. [DOI] [PMC free article] [PubMed] [Google Scholar]
- 54.Baber U, et al. Prevalence, impact, and predictive value of detecting subclinical coronary and carotid atherosclerosis in asymptomatic adults: the BioImage study. J Am Coll Cardiol. 2015;65:1065–74. doi: 10.1016/j.jacc.2015.01.017. [DOI] [PubMed] [Google Scholar]
Associated Data
This section collects any data citations, data availability statements, or supplementary materials included in this article.