

Abstract
Purpose
To develop a spectral-spatial (SPSP) excitation RF pulse for simultaneous water and lipid suppression in proton (1H) magnetic resonance spectroscopic imaging (MRSI) of body extremities.
Methods
An SPSP excitation pulse is designed to excite Creatine (Cr) and Choline (Cho) metabolite signals while suppressing the overwhelming water and lipid signals. The SPSP pulse is designed using a recently proposed multidimensional Shinnar-Le Roux (SLR) RF pulse design method. A minimum-phase spectral selectivity profile is used to minimize signal loss from T2* decay.
Results
The performance of the SPSP pulse is evaluated via Bloch equation simulations and phantom experiments. The feasibility of the proposed method is demonstrated using three-dimensional, short repetition-time, free induction decay-based 1H-MRSI in the thigh muscle at 3 T.
Conclusion
The proposed SPSP excitation pulse is useful for simultaneous water and lipid suppression. The proposed method enables new applications of high-resolution 1H-MRSI in body extremities.
Keywords: Water suppression, Lipid suppression, Spectral-spatial pulse, Multidimensional SLR pulse, 1H-MRSI
1. Introduction
Proton (1H) magnetic resonance spectroscopic imaging (MRSI) is a non-invasive method that maps concentrations of hydrogen-bound metabolites, providing useful biomarkers to various pathological conditions. In body extremities, 1H-MRS has been widely used to study triglyceride [1,2] and its relationship to insulin sensitivity [3,4], energy metabolism [5], and muscle fiber orientation [6]. Creatine (Cr) and Choline (Cho) signals have been shown useful for diagnosis of many diseases such as eosinophilia-myalgia syndrome [7], myopathia/myositis/irradiation damage [8], and tumor [9–11]. Recently, 1H-MRSI has been used to assess the response to radiation therapy in soft-tissue-sarcoma patients, where Cr and Cho signals are combined with 2-deoxy-2-[fluorine-18]-fluoro-d-glucose positron emission tomography (18F-FDG PET) signals to distinguish viable tumor from normal tissue, inflammation, and necrosis [12,13].
One of the major challenges of 1H-MRSI is the suppression of the overwhelming water and lipid signals (i.e., orders of magnitude higher than metabolite signals). The problem becomes even more difficult for 1H-MRSI in body extremities since lipids not only exist in the subcutaneous layer but also within the muscle, in the form of interstitial adipose tissue [i.e., extra-myocellular lipids (EMCL)] and liquid droplets within the cytoplasm of non-adipose cells close to mitochondria [i.e., intra-myocellular lipids (IMCL)] [14]. For instance, the outer-volume suppression (OVS) method [15,16] and localized excitation [17–24] can only suppress the lipids in the subcutaneous layer. Inversion recovery-based methods [25–27] can suppress all lipid signals at the cost of signal-to-noise ratio (SNR), scan time and specific absorption rate (SAR). In addition, most post-processing based lipid removal methods [28–32] rely on the spatial support information of the lipid signals and become less efficient in removing EMCL and IMCL signals.
Alternative solution to this issue is to use spectral-spatial (SPSP) pulses [33–37]. SPSP pulses allow simultaneous spatially-localized excitation and spectrally selective suppression of undesirable signal, making them highly suitable for 1H-MRSI in body extremity applications. SPSP refocusing pulses have been used for water suppression and slice-selection, showing robustness to both B0 and B1 inhomogeneities [26,38]. Adiabatic SPSP refocusing pulses have been developed for the same purpose with improved robustness to B1 inhomogeneities and chemical shift displacement errors [39–41]. Dual-band SPSP refocusing pulses have been proposed for simultaneous suppression of water and lipid signals [42]. A recent study has used SPSP pulses with spiral in-out gradients in a water suppression enhanced through T1 effects (WET) module for robustness to B1 inhomogeneities and lower SAR [43].
In this work, we propose a new SPSP excitation pulse for simultaneous water and lipid suppression in 1H-MRSI of body extremities. Instead of using SPSP pulses in a long-duration suppression module (e.g., duration of 100–200 ms in WET), the proposed SPSP excitation pulse not only provides robustness to B1 inhomogeneity and T1 recovery effects but also enables high-resolution MRSI through short-repetition time (TR) free induction decay (FID) acquisition (e.g., TR ≤ 300 ms). Previously developed multidimensional Shinnar-Le Roux (MD-SLR) RF pulse design method [44] is used to design the proposed pulse. A minimum-phase spectral selectivity profile is used in the proposed pulse to reduce the signal loss due to T2* decay. The performance of the proposed SPSP excitation pulse has been evaluated via Bloch equation simulations and phantom experiments. The feasibility of the proposed method has been demonstrated for the detection of Cho and Cr (i.e., the singlet at 3.0 ppm) signals using 1H-MRSI in human thigh muscle at 3 T. Potential usefulness of the proposed method is also discussed.
2. Methods
2.1. SPSP RF pulse design
The proposed SPSP excitation pulse was designed using the previously described multidimensional SLR RF pulse design method [44]. Fig. 1 illustrates the target spectral profile of the proposed pulse. The target passband width was 2.0 ppm (i.e., 250 Hz at 3 T) and was centered at 3.1 ppm, to selectively excite signals from metabolites including Cr (i.e., resonance at 3.0 ppm) and Cho (i.e., resonance at 3.2 ppm). The proposed pulse was designed to simultaneously suppress water (e.g., resonance at 4.7 ppm) and lipid [i.e., the dominant resonance at 1.3 ppm arising from the methylene group −(CH2)n] signals by placing them in the stopband. A minimum-phase spectral-selectivity profile was used to reduce the signal loss due to T2* decay [45]. A fly-back echo planar gradient waveform was used along with the designed SPSP pulse for slice-selection. The desired passband and stopband ripple levels were set to be 5% and 1% (i.e., 100-fold or 40 dB suppression), respectively. As an example for three-dimensional (3D) 1H-MRSI, an SPSP excitation pulse was designed with a target slab thickness of 60 mm. The maximum gradient and gradient slew rate were set to be 4 G and 14,000 G/cm/s, respectively.
Fig. 1.

Schematic diagram illustrating the spectral profile of the minimum-phase SPSP excitation RF pulse. The passband (blue), stopbands (green), and transition bands (red) are denoted with the stopband/passband ripple levels of 1/5%. The inverted triangles denote the resonance locations of water (i.e., 4.7 ppm), Cho (i.e., 3.2 ppm), Cr (i.e., 3.0 ppm), and major lipid (i.e., 1.3 ppm) peak signals. (For interpretation of the references to color in this figure legend, the reader is referred to the web version of this article.)
The RF and gradient waveforms of the designed SPSP pulse are shown in Fig. 2. The designed pulse consisted of twenty-one 0.84 ms long subpulses. The total length of the designed pulse was 17.6 ms. The time-bandwidth product of the slice-selective subpulse was 4.0. The time-bandwidth product of the spectral selective pulse was 4.4. The resultant excitation profile of the SPSP pulse is shown in Fig. 3. The excitation pattern in the z-f plane (Fig. 3a) well represented the intended spectral-selectivity and spatial-selectivity. The passband and transition bandwidth of the spectral-selectivity profile (Fig. 3b) was 2.0 ppm and 0.67 ppm (i.e., 250 Hz and 82 Hz at 3 T), respectively. The distance between the water (i.e., resonance at 4.7 ppm or 0 Hz as reference) and the starting point of the transition band was 0.25 ppm (i.e., 31 Hz). The distance between the major lipid (i.e., resonance at 1.3 ppm or 419 Hz from water resonance) and the starting point of the transition band was 0.45 ppm (i.e., 56 Hz). This provided an effective bandwidth of 88 Hz (i.e., 0.7 ppm) for both water and lipid suppression, which, as shown later, made the designed pulse useful for 1H-MRSI in body extremities in in vivo experiment at 3 T. The spatial profile (Fig. 3c) of the designed SPSP pulse showed spatial-selectivity with passband width of 60 mm.
Fig. 2.
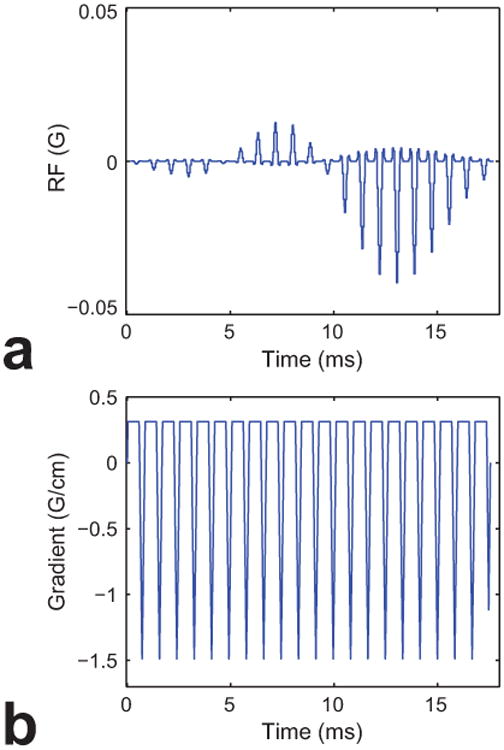
Design of the minimum-phase SPSP excitation RF pulse. RF (a) and gradient (b) waveforms of the SPSP pulse are shown. Note that fly-back echo-planar gradient waveform is used along the z-gradient.
Fig. 3.

Excitation profile of the designed minimum-phase SPSP RF pulse. a: Excitation pattern of the minimum-phase SPSP RF pulse. b: Spectral profile across the red-dashed line in (a). The inverted triangles denote the resonance locations of water (i.e., 4.7 ppm), Cho (i.e., 3.2 ppm), Cr (i.e., 3.0 ppm), and major lipid (i.e., 1.3 ppm) peak signals. c: Spatial profile along the z-axis across the blue-dotted line in (a). (For interpretation of the references to color in this figure legend, the reader is referred to the web version of this article.)
2.2. Simulation study
Bloch equation simulation studies were performed to examine the performance of the designed SPSP pulse. Although a minimum-phase profile was used during the RF pulse design, the signal loss of the designed 17.6 ms pulse due to T2* decay can still be a concern. To study this issue, a series of Bloch equation simulations were performed over a range of T2* values: 30, 40, 50, 60, 80, 100, 120, 140, 160, 180, and 200 ms. The signal loss of the designed minimum-phase SPSP pulse was also compared with a linear-phase SPSP pulse designed with the same parameters and a conventional slice-selective sinc pulse of 5 ms duration.
2.3. Experimental study
All experiments were performed on a 3 T PET/MR scanner (mMR Biograph, Siemens Healthcare, Erlangen, Germany). In vivo 3D 1H-MRSI data of the thigh were acquired from a healthy subject. The study protocol was approved by our local Institutional Review Board (IRB).
For the phantom study, a 3D echo-planar spectroscopic imaging (EPSI) sequence was modified to use the designed SPSP pulse or the conventional sinc pulse for excitation. A uniform water phantom was imaged. Careful shimming was first carried out to minimize the effects of background B0 inhomogeneity (i.e., full-width at half-maximum of the FID signal < 10 Hz). Then a 0.02 G/cm gradient was added to the shimming gradient along the spatial x-axis, correlating the spatial location along the x-axis linearly with the resonance frequency offset [i.e., corresponding to a spectral bandwidth of 1703.8 Hz for the given field-of-view (FOV)]. 3D EPSI images were acquired using the designed pulse and conventional sinc pulse with the following imaging parameters: FOV = 200 × 200 × 120 mm3, spatial encoding matrix size = 72 × 72 × 24, number of echoes = 64, echo-spacing (bi-polar acquisition) = 1.9 ms, readout bandwidth = 100 kHz, TR/TE = 120/5 ms, flip angle = 43°, and total acquisition time = 3.5 min.
For the in vivo study, the subject laid in a supine position. The body coil of the scanner was used for transmission. The spine matrix coil within the patient table and a phased-array surface coil were used for receiving. 3D EPSI images were acquired using the designed SPSP pulse and slice-selective sinc pulse. The general imaging parameters were: FOV=256×256×80mm3, spatial encoding matrix size = 32 × 32 × 10, number of echoes = 350, echo-spacing (bi-polar acquisition) = 1.1 ms, readout bandwidth = 68 kHz, TR = 300 ms, and flip angle = 43°. The imaging parameters specific to the acquisition with the designed SPSP pulse were: nominal TE = 2 ms, number of signal averages = 4, and total acquisition time = 6.5 min. The imaging parameters specific to the acquisition with the sinc pulse were: nominal TE = 3.5 ms, number of signal averages = 4, and total acquisition time = 6.5 min. Eight OVS saturation slabs [15,16] were included to suppress subcutaneous lipid signals. Two navigator signals were additionally acquired using readout with the same and opposite gradient polarities, respectively, in the absence of phase-encoding gradients to correct for the phase mismatch between the odd and even echoes of the EPSI acquisition. Between the two EPSI acquisitions, a double-echo gradient recalled-echo (GRE) sequence was used to acquire anatomical structure reference images and B0 maps with the following imaging parameters: FOV = 256 × 256 mm2, spatial encoding matrix size = 128 × 128, number of slices = 40, slice thickness = 3.0 mm, and TR/TE1/TE2 = 500/4.77/7.23 ms.
3. Results
Fig. 4 shows the results from the simulation study. The usage of linear-phase SPSP pulse of 17.6 ms duration resulted in great signal loss from T2* decay, showing signal loss of 21.7, 15.9, 12.2, 9.6, 6.3, 4.3, 2.9, 1.8, 1.1, 0.5, and 0% for T2* values of 30, 40, 50, 60, 80, 100, 120, 140, 160, 180, and 200 ms, respectively (red solid line in Fig. 4). The usage of minimum-phase SPSP pulse of 17.6 ms duration mitigated this effect significantly, showing signal loss of 10.7, 7.7, 5.8, 4.6, 3.0, 2.0, 1.3, 0.9, 0.5, 0.2, and 0% for T2* values of 30, 40, 50, 60, 80, 100, 120, 140, 160, 180, and 200 ms, respectively (blue dashed line in Fig. 4). The signal loss from using minimum-phase SPSP pulse of 17.6 ms duration was comparable to those from using sinc pulse of 5 ms duration, which resulted in signal loss of 8.2, 5.9, 4.4, 3.5, 2.2, 1.5, 1.0, 0.6, 0.4, 0.2, and 0% for T2* values of 30, 40, 50, 60, 80, 100, 120, 140, 160, 180, and 200 ms, respectively (blue dashed line and black dotted line in Fig. 4).
Fig. 4.

Simulation of T2* relaxation effects. a: T2* relaxation effects of sinc pulse with 5 ms duration (black dotted line), minimum-phase SPSP pulse with 17.6 ms duration (blue dashed line), and linear-phase SPSP pulse with 17.6 ms duration (red solid line) are shown. (For interpretation of the references to color in this figure legend, the reader is referred to the web version of this article.)
Figs. 5 and 6 show the results from the phantom experiment. The first and second rows of Fig. 5 show the images and excitation profiles of the phantom obtained using the sinc pulse and the proposed SPSP pulse, respectively. Compared to the images (Fig. 5a and e) and excitation profiles (Fig. 5b and f) in the y-f plane, the usage of SPSP pulse clearly showed the expected spectral-selectivity with passband full-width half-maximum of 252.7 Hz. Note that the variations of the signal intensities in Fig. 5 were largely due to the receive B1 inhomogeneity. Fig. 6 shows the image and profile of the suppression ratio in dB, which were calculated by dividing Fig. 5a and b by Fig. 5e and f, respectively. As can be seen, the proposed SPSP pulse achieved the expected 40 dB suppression in the stopband. Regarding slice-selection, the excitation pattern obtained by the proposed SPSP pulse showed less sharp slice profile (Fig. 5h) than that by the sinc pulse (Fig. 5d). This is presumed to be due to the time-bandwidth product difference between sinc pulse (i.e., 8.75) and the subpulse of the SPSP pulse (i.e., 4.4) which is the result of limits on maximum gradient slew rate.
Fig. 5.

Phantom experiment results of excitation profile. a–d: Excitation pattern of sinc pulse. The acquired image across the y-f (a) and z-y (c) planes and the corresponding spectral and spatial profiles along the red dashed lines are shown in (b) and (d), respectively. e–h: Excitation pattern of minimum-phase SPSP pulse. The acquired image across the y-f (e) and z-y (g) planes and the corresponding spectral and spatial profiles along the red dashed lines are shown in (f) and (h), respectively. (For interpretation of the references to color in this figure legend, the reader is referred to the web version of this article.)
Fig. 6.

Phantom experiment results of suppression effect from minimum-phase SPSP RF pulse. Suppression image across the y-f plane (a) and the corresponding spectral profile along the red dashed line (b) are shown. Note that the horizontal spatial-axis in (a) is correlated with spectral information due to the addition of 0.2 mT/m to the shimming gradient. (For interpretation of the references to color in this figure legend, the reader is referred to the web version of this article.)
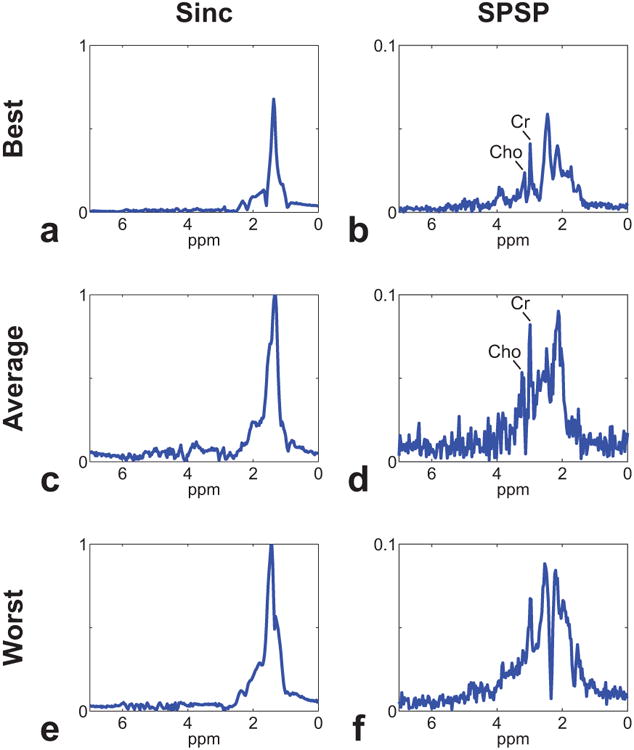
Figs. 7, 8 and 9 shows the results from the in vivo experiment. The anatomical reference GRE image is shown in Fig. 7a. The B0 map showed off-resonance frequency shifts of < 50 Hz across the whole 3D imaging volume (Fig. 7b). The second and third rows in Fig. 7 show the water and lipid signals obtained from using the sinc pulse and the proposed SPSP pulse, respectively. Compared to the usage of sinc pulse (Fig. 7c–d), both water and lipid signals were greatly suppressed with the usage of the proposed SPSP RF excitation pulse (Fig. 7e–f) (note the 20-fold scale difference between Fig. 7c–d and e–f). The water and lipid signal suppression was further clearly shown from the spectral profiles with (Fig. 8) and without (Fig. 9) water removal (i.e., via Hankel singular value decomposition method [46]), respectively. Compared to the usage of sinc pulse, usage of SPSP pulse resulted in over 50- and 10-fold signal suppression of water and lipid signals, respectively (Figs. 8 and 9). This resulted in successfully revealing individual Cr and Cho signals with clear distinction in regions with low levels of B0 inhomogeneity (location denoted by red dot in Fig. 7a) (Figs. 8b and 9b). The usage of SPSP pulse also successfully detected individual Cr and Cho signals in regions with moderate levels of B0 inhomogeneity (location denoted by blue dot in Fig. 7a), with increased noise in the spectral profile (Fig. 9d). However, individual Cr and Cho signals were not clearly distinguishable in regions with relatively high B0 inhomogeneity (location denoted by green dot in Fig. 7a), presumably due to insufficient signal suppression with the usage of the SPSP pulse (Figs. 8f and 9f).
Fig. 7.

In vivo experiment results. a: GRE image. The representative spectra locations for best (red dot), average (blue dot), and worst (green dot) case scenarios are indicated in the image. b: B0 inhomogeneity map. c–d: Water (c) and lipid (d) maps from sinc pulse. e–f: Water (e) and lipid (f) maps from SPSP pulse. Note the 20-fold lower scale difference compared to the results obtained using sinc pulse. (For interpretation of the references to color in this figure legend, the reader is referred to the web version of this article.)
Fig. 8.

In vivo experiment results of spectra. Representative spectra from best (a, b), average (c, d), and worst (e, f) case scenarios are shown for sinc (a, c, e) and SPSP (b, d, f) pulses.
Fig. 9.
In vivo experiment results of spectra after water removal. Representative spectra from best (a, b), average (c, d), and worst (e, f) case scenarios are shown for sinc (a, c, e) and SPSP (b, d, f) pulses. Note the obvious suppression of lipid signal with the usage of SPSP pulse.
4. Discussion
We present a new minimum-phase SPSP excitation RF pulse for simultaneous water and lipid suppression in 1H-MRSI of body extremities. We have validated the efficiency of the proposed method using Bloch equation simulation, phantom and in vivo studies on a 3 T scanner. Compared to the inversion recovery-based methods [25–27], the proposed SPSP pulse suppresses both the subcutaneous lipids, EMCL, and IMCL without comprising SNR and TR. The use of an SPSP excitation pulse for water suppression also removes long-duration water suppression preparation modules (e.g., duration of 100–200 ms in WET) [47–49] and enables short-TR FID-based MRSI acquisition (e.g., TR ≤ 300 ms). Compared to the conventional spin-echo based MRSI acquisition, short-TR FID-based MRSI acquisition not only achieves higher SNR efficiency (i.e., defined as SNR per voxel divided by the square root of total acquisition time) [50] but also enables high-resolution MRSI possible within a clinically feasible scan time especially at ultra-high field MRI [51,52]. The proposed SPSP pulse could be combined with the subspace based method [53–55] to achieve high-resolution 3D MRSI of body extremities even at clinical MRI scanners (e.g., 3 T), which is under investigation and will be reported in future publications.
Using SPSP pulse for selective signal suppression can be sensitive to B0 inhomogeneity. In this study, the representative best-, average-, and worst-case scenarios were chosen from the in vivo data at regions of calf muscle with low, moderate, and high B0 inhomogeneity levels, respectively (Fig. 7). The spectrum results from the best-case condition shows the case when the effects from B0 inhomogeneity is minimal, and the spectrum results from the worst-case condition shows the case when the proposed SPSP pulse can fail to distinguish the target metabolite signals of Cho and Cr clearly, presumably due to insufficient signal suppression of lipid signals from the effects of B0 inhomogeneity (Figs. 8 and 9). Theoretically, robustness to B0 inhomogeneity of an SPSP pulse can be improved by designing the spectral-selectivity of the pulse with sharper transition band at the cost of prolonged pulse duration. In practice, the inherent tradeoff between the sharpness of the transition band and the duration of the RF pulse should be application dependent for optimal performance. In 1H-MRSI of body extremities, only Cr (i.e., resonance at 3.0 ppm) and Cho (i.e., resonance at 3.2 ppm) are the main metabolites of interest, making it possible to design a 17.6 ms SPSP pulse with an effective bandwidth of 88 Hz (i.e., 0.7 ppm) for water and lipid suppression. As shown in the in vivo results in Figs. 7, 8 and 9, the designed SPSP pulse achieved robust water and lipid suppression across the entire 3D imaging volume.
The excitation pattern produced by the proposed method has periodic repetitions along the frequency axis determined by the subpulse duration τ (i.e., f = 1/τ). For the SPSP pulse designed in this work, the subpulse duration was 0.84 ms and thus the repetition period along the frequency axis was 1190 Hz (i.e., 9.6 ppm at 3 T) (Sup. Fig. S1). Since most of the detectable metabolite signals reside between 0.9 and 5.3 ppm [56,57], the sidelobes will not become a concern as long as the repetition period (f = 1/τ) along the frequency axis of the designed SPSP pulse is larger than 4.4 ppm (assuming no effects from B0 inhomogeneity). This requirement is easier to satisfy at a lower field strength and more difficult to fulfill at a higher field strength. However, systematic evaluation of the performance of the proposed pulse at different field strengths is beyond the scope of this work.
In this work, the proposed SPSP pulse was designed neglecting the effects of shift in the slice-selection profile due to off-resonance excitation for the simplicity of calculation. As a result, the slice-selection profile of the designed SPSP pulse slightly shifted along the spatial axis as the resonant frequency moved away from the center (Sup. Fig. S2). The offset between the slice-selection profiles obtained from the edges of the passband along the frequency axis was ∼1.4 mm for the designed SPSP pulse, which was ∼2.3% of the desired slice thickness of 60 mm. Such offset can be further reduced by increasing the bandwidth of each slice-selective subpulses.
The proposed SPSP pulse has been designed to suppress the major lipid signal (i.e., resonance at 1.3 ppm) only. Lipid is known to resonate at multiple frequencies of 1.3, 0.9, 2.0, 5.3, and 2.8 ppm in decreasing order of intensity [58], therefore moderate amount of residual lipid signal can still be present at other resonance locations (Fig. 9) after the application of the proposed SPSP pulse. Thus, lipid signals originating from other resonance locations should be properly handled via postprocessing. In this work, passband and stopband ripple levels of 5% and 1% were used in the design of the SPSP pulse, respectively, for sufficient suppression of water and lipid signals to reveal Cr and Cho signals. However, strong suppression of water or lipid signals may not be always desirable, since both water and lipid signals can be used to provide useful information in body extremities. For instance, water signal can be used to estimate the B0 field map or signal loss from T2 decay. Lipids such as IMCL are known to provide useful information in body extremities [1,2,4–6] with relation to pathophysiological conditions [3,7,8]. If needed, a reference water scan can be obtained using the proposed method by adjusting the width of the passband to include the water resonance frequency (i.e., 4.7 ppm) or weak water and/or lipid suppression can be achieved by assigning different ripple levels to each stopband as in [42].
5. Conclusion
Minimum-phase SPSP excitation RF pulse is useful for simultaneous water and lipid suppression. The proposed method allows short-TR FID-based acquisition which enables new applications of high-resolution 1H-MRSI in body extremities.
Supplementary Material
Acknowledgments
This work was supported in part by the Tsinghua Top Open Program for Undergraduate Performing Research Abroad, the National Institutes of Health (R01CA165221, R21EB021710, and T32EB013180), and the Federal Share of Program Income earned by MGH on C06 CA059267.
Footnotes
Appendix A. Supplementary data: Supplementary data to this article can be found online at http://dx.doi.org/10.1016/j.mri.2017.09.008
References
- 1.Boesch C, Slotboom J, Hoppeler H, Kreis R. In vivo determination of intra-myocellular lipids in human muscle by means of localized 1H-MR-spectroscopy. Magn Reson Med. 1997;37:484–93. doi: 10.1002/mrm.1910370403. [DOI] [PubMed] [Google Scholar]
- 2.Schick F, Eismann B, Jung WI, Bongers H, Bunse M, Lutz O. Comparison of localized proton NMR signals of skeletal muscle and fat tissue in vivo: two lipid compartments in muscle tissue. Magn Reson Med. 1993;29:158–67. doi: 10.1002/mrm.1910290203. [DOI] [PubMed] [Google Scholar]
- 3.Jacob S, Machann J, Rett K, Brechtel K, Volk A, Renn W, et al. Association of increased intramyocellular lipid content with insulin resistance in lean nondiabetic offspring of type 2 diabetic subjects. Diabetes. 1999;48:1113–9. doi: 10.2337/diabetes.48.5.1113. [DOI] [PubMed] [Google Scholar]
- 4.Krssak M, Falk Petersen K, Dresner A, DiPietro L, Vogel SM, Rothman DL, et al. Intramyocellular lipid concentrations are correlated with insulin sensitivity in humans: a 1H NMR spectroscopy study. Diabetologia. 1999;42:113–6. doi: 10.1007/s001250051123. [DOI] [PubMed] [Google Scholar]
- 5.Rico-Sanz J, Thomas EL, Jenkinson G, Mierisova S, Iles R, Bell JD. Diversity in levels of intracellular total creatine and triglycerides in human skeletal muscles observed by (1)H-MRS. J Appl Physiol. 1985;87(1999):2068–72. doi: 10.1152/jappl.1999.87.6.2068. [DOI] [PubMed] [Google Scholar]
- 6.Vermathen P, Boesch C, Kreis R. Mapping fiber orientation in human muscle by proton MR spectroscopic imaging. Magn Reson Med. 2003;49:424–32. doi: 10.1002/mrm.10396. [DOI] [PubMed] [Google Scholar]
- 7.Schick F, Duda S, Durk H, Bunse M, Lutz O, Claussen CD. Eosinophilia-myalgia syndrome: findings at MR imaging and proton spectroscopy of the lower leg. Magn Reson Imaging. 1994;12:513–22. doi: 10.1016/0730-725x(94)92545-3. [DOI] [PubMed] [Google Scholar]
- 8.Bongers H, Schick F, Skalej M, Jung WI, Stevens A. Localized in vivo 1H spectroscopy of human skeletal muscle: normal and pathologic findings. Magn Reson Imaging. 1992;10:957–64. doi: 10.1016/0730-725x(92)90450-e. [DOI] [PubMed] [Google Scholar]
- 9.Qi ZH, Li CF, Li ZF, Zhang K, Wang Q, Yu DX. Preliminary study of 3T 1H MR spectroscopy in bone and soft tissue tumors. Chin Med J (Engl) 2009;122:39–43. [PubMed] [Google Scholar]
- 10.Wang CK, Li CW, Hsieh TJ, Chien SH, Liu GC, Tsai KB. Characterization of bone and soft-tissue tumors with in vivo 1H MR spectroscopy: initial results. Radiology. 2004;232:599–605. doi: 10.1148/radiol.2322031441. [DOI] [PubMed] [Google Scholar]
- 11.Yu Q, Yang J, Wang P. Malignant tumors and chronic infections in the masticator space: preliminary assessment with in vivo single-voxel 1H-MR spectroscopy. AJNR Am J Neuroradiol. 2008;29:716–9. doi: 10.3174/ajnr.A0897. [DOI] [PMC free article] [PubMed] [Google Scholar]
- 12.Ma C, Chen Y, Jee K, Lim R, Chebib IA, Taman MO, et al. Assessment of response to radiation therapy using high-resolution proton MRSI in soft tissue sarcoma patients. 2017:2969. [Google Scholar]
- 13.Zhang X, Chen YL, Lim R, Huang C, Chebib IA, El Fakhri G. Synergistic role of simultaneous PET/MRI-MRS in soft tissue sarcoma metabolism imaging. Magn Reson Imaging. 2016;34:276–9. doi: 10.1016/j.mri.2015.10.027. [DOI] [PMC free article] [PubMed] [Google Scholar]
- 14.Vock R, Hoppeler H, Claassen H, Wu DX, Billeter R, Weber JM, et al. Design of the oxygen and substrate pathways VI Structural basis of intracellular substrate supply to mitochondria in muscle cells. J Exp Biol. 1996;199:1689–97. doi: 10.1242/jeb.199.8.1689. [DOI] [PubMed] [Google Scholar]
- 15.Duyn JH, Gillen J, Sobering G, van Zijl PC, Moonen CT. Multisection proton MR spectroscopic imaging of the brain. Radiology. 1993;188:277–82. doi: 10.1148/radiology.188.1.8511313. [DOI] [PubMed] [Google Scholar]
- 16.Le Roux P, Gilles RJ, McKinnon GC, Carlier PG. Optimized outer volume suppression for single-shot fast spin-echo cardiac imaging. J Magn Reson Imaging. 1998;8:1022–32. doi: 10.1002/jmri.1880080505. [DOI] [PubMed] [Google Scholar]
- 17.Bottomley PA. Spatial localization in NMR spectroscopy in vivo. Ann N Y Acad Sci. 1987;508:333–48. doi: 10.1111/j.1749-6632.1987.tb32915.x. [DOI] [PubMed] [Google Scholar]
- 18.Frahm J, Merboldt KD, Hänicke W. Localized proton spectroscopy using stimulated echoes. J Magn Reson. 1969;72(1987):502–8. doi: 10.1002/mrm.1910170113. [DOI] [PubMed] [Google Scholar]
- 19.Garwood M, DelaBarre L. The return of the frequency sweep: designing adiabatic pulses for contemporary NMR. J Magn Reson. 2001;153:155–77. doi: 10.1006/jmre.2001.2340. [DOI] [PubMed] [Google Scholar]
- 20.Slotboom J, Mehlkopf A, Bovee W. A single-shot localization pulse sequence suited for coils with inhomogeneous RF fields using adiabatic slice-selective RF pulses. J Magn Reson. 1969;95(1991):396–404. [Google Scholar]
- 21.Sacolick LI, Rothman DL, de Graaf RA. Adiabatic refocusing pulses for volume selection in magnetic resonance spectroscopic imaging. Magn Reson Med. 2007;57:548–53. doi: 10.1002/mrm.21162. [DOI] [PubMed] [Google Scholar]
- 22.Hess AT, Andronesi OC, Tisdall MD, Sorensen AG, van der Kouwe AJ, Meintjes EM. Real-time motion and B0 correction for localized adiabatic selective refocusing (LASER) MRSI using echo planar imaging volumetric navigators. NMR Biomed. 2012;25:347–58. doi: 10.1002/nbm.1756. [DOI] [PMC free article] [PubMed] [Google Scholar]
- 23.Scheenen TW, Heerschap A, Klomp DW. Towards 1H-MRSI of the human brain at 7T with slice-selective adiabatic refocusing pulses. MAGMA. 2008;21:95–101. doi: 10.1007/s10334-007-0094-y. [DOI] [PMC free article] [PubMed] [Google Scholar]
- 24.Scheenen TW, Klomp DW, Wijnen JP, Heerschap A. Short echo time 1H-MRSI of the human brain at 3T with minimal chemical shift displacement errors using adiabatic refocusing pulses. Magn Reson Med. 2008;59:1–6. doi: 10.1002/mrm.21302. [DOI] [PubMed] [Google Scholar]
- 25.Ebel A, Govindaraju V, Maudsley AA. Comparison of inversion recovery preparation schemes for lipid suppression in 1H MRSI of human brain. Magn Reson Med. 2003;49:903–8. doi: 10.1002/mrm.10444. [DOI] [PubMed] [Google Scholar]
- 26.Spielman DM, Pauly JM, Macovski A, Glover GH, Enzmann DR. Lipid-suppressed single- and multisection proton spectroscopic imaging of the human brain. J Magn Reson Imaging. 1992;2:253–62. doi: 10.1002/jmri.1880020302. [DOI] [PubMed] [Google Scholar]
- 27.Bydder GM, Young IR. MR imaging: clinical use of the inversion recovery sequence. J Comput Assist Tomogr. 1985;9:659–75. [PubMed] [Google Scholar]
- 28.Bhattacharya I, Jacob M. Compartmentalized low-rank recovery for high-resolution lipid unsuppressed MRSI. Magn Reson Med. 2016 doi: 10.1002/mrm.26537. http://dx.doi.org/10.1002/mrm.26537. epub ahead of print. [DOI] [PMC free article] [PubMed]
- 29.Bilgic B, Gagoski B, Kok T, Adalsteinsson E. Lipid suppression in CSI with spatial priors and highly undersampled peripheral k-space. Magn Reson Med. 2013;69:1501–11. doi: 10.1002/mrm.24399. [DOI] [PMC free article] [PubMed] [Google Scholar]
- 30.Haupt CI, Schuff N, Weiner MW, Maudsley AA. Removal of lipid artifacts in 1H spectroscopic imaging by data extrapolation. Magn Reson Med. 1996;35:678–87. doi: 10.1002/mrm.1910350509. [DOI] [PMC free article] [PubMed] [Google Scholar]
- 31.Ma C, Lam F, Johnson CL, Liang ZP. Removal of nuisance signals from limited and sparse 1H MRSI data using a union-of-subspaces model. Magn Reson Med. 2016;75:488–97. doi: 10.1002/mrm.25635. [DOI] [PMC free article] [PubMed] [Google Scholar]
- 32.Plevritis SK, Macovski A. Spectral extrapolation of spatially bounded images [MRI application] IEEE Trans Med Imaging. 1995;14:487–97. doi: 10.1109/42.414614. [DOI] [PubMed] [Google Scholar]
- 33.Block W, Pauly J, Kerr A, Nishimura D. Consistent fat suppression with compensated spectral-spatial pulses. Magn Reson Med. 1997;38:198–206. doi: 10.1002/mrm.1910380207. [DOI] [PubMed] [Google Scholar]
- 34.Meyer CH, Pauly JM, Macovski A, Nishimura DG. Simultaneous spatial and spectral selective excitation. Magn Reson Med. 1990;15:287–304. doi: 10.1002/mrm.1910150211. [DOI] [PubMed] [Google Scholar]
- 35.Morrell G, Macovski A. Three-dimensional spectral-spatial excitation. Magn Reson Med. 1997;37:378–86. doi: 10.1002/mrm.1910370314. [DOI] [PubMed] [Google Scholar]
- 36.Schick F. Simultaneous highly selective MR water and fat imaging using a simple new type of spectral-spatial excitation. Magn Reson Med. 1998;40:194–202. doi: 10.1002/mrm.1910400205. [DOI] [PubMed] [Google Scholar]
- 37.Zur Y. Design of improved spectral-spatial pulses for routine clinical use. Magn Reson Med. 2000;43:410–20. doi: 10.1002/(sici)1522-2594(200003)43:3<410::aid-mrm13>3.0.co;2-3. [DOI] [PubMed] [Google Scholar]
- 38.Spielman D, Pauly J, Macovski A, Enzmann D. Spectroscopic imaging with multidimensional pulses for excitation: SIMPLE. Magn Reson Med. 1991;19:67–84. doi: 10.1002/mrm.1910190107. [DOI] [PubMed] [Google Scholar]
- 39.Conolly S, Pauly J, Nishimura D, Macovski A. Two-dimensional selective adiabatic pulses. Magn Reson Med. 1992;24:302–13. doi: 10.1002/mrm.1910240211. [DOI] [PubMed] [Google Scholar]
- 40.Balchandani P, Pauly J, Spielman D. Interleaved narrow-band PRESS sequence with adiabatic spatial-spectral refocusing pulses for 1H MRSI at 7T. Magn Reson Med. 2008;59:973–9. doi: 10.1002/mrm.21539. [DOI] [PMC free article] [PubMed] [Google Scholar]
- 41.Feldman RE, Balchandani P. A semiadiabatic spectral-spatial spectroscopic imaging (SASSI) sequence for improved high-field MR spectroscopic imaging. Magn Reson Med. 2016;76:1071–82. doi: 10.1002/mrm.26025. [DOI] [PMC free article] [PubMed] [Google Scholar]
- 42.Schricker AA, Pauly JM, Kurhanewicz J, Swanson MG, Vigneron DB. Dualband spectral-spatial RF pulses for prostate MR spectroscopic imaging. Magn Reson Med. 2001;46:1079–87. doi: 10.1002/mrm.1302. [DOI] [PubMed] [Google Scholar]
- 43.Ma J, Wismans C, Cao Z, Klomp DW, Wijnen JP, Grissom WA. Tailored spiral in-out spectral-spatial water suppression pulses for magnetic resonance spectroscopic imaging. Magn Reson Med. 2017 doi: 10.1002/mrm.26683. http://dx.doi.org/10.1002/mrm.26683. epub ahead of print. [DOI] [PMC free article] [PubMed]
- 44.Ma C, Liang ZP. Design of multidimensional Shinnar-Le Roux radiofrequency pulses. Magn Reson Med. 2015;73:633–45. doi: 10.1002/mrm.25179. [DOI] [PMC free article] [PubMed] [Google Scholar]
- 45.Pauly J, Le Roux P, Nishimura D, Macovski A. Parameter relations for the Shinnar-Le Roux selective excitation pulse design algorithm [NMR imaging] IEEE Trans Med Imaging. 1991;10:53–65. doi: 10.1109/42.75611. [DOI] [PubMed] [Google Scholar]
- 46.Barkhuysen H, de Beer R, van Ormondt D. Improved algorithm for noniterative time-domain model fitting to exponentially damped magnetic resonance signals. J Magn Reson. 1987;73:553–7. [Google Scholar]
- 47.Ogg RJ, Kingsley PB, Taylor JS. WET, a T1- and B1-insensitive water-suppression method for in vivo localized 1H NMR spectroscopy. J Magn Reson B. 1994;104:1–10. doi: 10.1006/jmrb.1994.1048. [DOI] [PubMed] [Google Scholar]
- 48.Haase A, Frahm J, Hanicke W, Matthaei D. 1H NMR chemical shift selective (CHESS) imaging. Phys Med Biol. 1985;30:341–4. doi: 10.1088/0031-9155/30/4/008. [DOI] [PubMed] [Google Scholar]
- 49.Tkac I, Starcuk Z, Choi IY, Gruetter R. In vivo 1H NMR spectroscopy of rat brain at 1 ms echo time. Magn Reson Med. 1999;41:649–56. doi: 10.1002/(sici)1522-2594(199904)41:4<649::aid-mrm2>3.0.co;2-g. [DOI] [PubMed] [Google Scholar]
- 50.Pohmann R, von Kienlin M, Haase A. Theoretical evaluation and comparison of fast chemical shift imaging methods. J Magn Reson. 1997;129:145–60. doi: 10.1006/jmre.1997.1245. [DOI] [PubMed] [Google Scholar]
- 51.Hangel G, Strasser B, Povazan M, Heckova E, Hingerl L, Boubela R, et al. Ultra-high resolution brain metabolite mapping at 7 T by short-TR Hadamard-encoded FID-MRSI. Neuroimage. 2016 doi: 10.1016/j.neuroimage.2016.10.043. http://dx.doi.org/10.1016/j.neuroimage.2016.10.043. epub ahead of print. [DOI] [PubMed]
- 52.Nassirpour S, Chang P, Henning A. High and ultra-high resolution metabolite mapping of the human brain using 1H FID MRSI at 9.4T. Neuroimage. 2016 doi: 10.1016/j.neuroimage.2016.12.065. [DOI] [PubMed] [Google Scholar]
- 53.Lam F, Liang ZP. A subspace approach to high-resolution spectroscopic imaging. Magn Reson Med. 2014;71:1349–57. doi: 10.1002/mrm.25168. [DOI] [PMC free article] [PubMed] [Google Scholar]
- 54.Lam F, Ma C, Clifford B, Johnson CL, Liang ZP. High-resolution (1) H-MRSI of the brain using SPICE: data acquisition and image reconstruction. Magn Reson Med. 2016;76:1059–70. doi: 10.1002/mrm.26019. [DOI] [PMC free article] [PubMed] [Google Scholar]
- 55.Ma C, Lam F, Ning Q, Johnson CL, Liang ZP. High-resolution 1H-MRSI of the brain using short-TE SPICE. Magn Reson Med. 2017;77:467–79. doi: 10.1002/mrm.26130. [DOI] [PMC free article] [PubMed] [Google Scholar]
- 56.Sacchi R, Patumi M, Fontanazza G, Barone P, Fiordiponti P, Mannina L, et al. A high-field 1H nuclear magnetic resonance study of the minor components in virgin olive oils. J Am Oil Chem Soc. 1996;73:747–58. [Google Scholar]
- 57.van der Graaf M. In vivo magnetic resonance spectroscopy: basic methodology and clinical applications. Eur Biophys J. 2010;39:527–40. doi: 10.1007/s00249-009-0517-y. [DOI] [PMC free article] [PubMed] [Google Scholar]
- 58.Kuesel AC, Sutherland GR, Halliday W, Smith IC. 1H MRS of high grade astrocytomas: mobile lipid accumulation in necrotic tissue. NMR Biomed. 1994;7:149–55. doi: 10.1002/nbm.1940070308. [DOI] [PubMed] [Google Scholar]
Associated Data
This section collects any data citations, data availability statements, or supplementary materials included in this article.