Abstract
The performance of surface-enhanced Raman spectroscopy (SERS) substrates is typically evaluated by calculating an enhancement factor (EF). However, it is challenging to accurately calculate EF values since the calculation often requires use of model analytes and requires assumptions about the number of analyte molecules within the laser excitation volume. Furthermore, the measured EF values are target analyte dependent and thus it is challenging to compare substrates with EF values obtained using different analytes. In this study, we propose an alternative evaluation parameter for SERS substrate performance that is based on the intensity of the surface plasmon enhanced Rayleigh band (IRayleigh) that originates from the amplified spontaneous emission (ASE) of the laser. Compared to EF, IRayleigh reflects the enhancing capability of the substrate itself, is easy to measure without use of any analytes, and is universally applicable for the comparison of SERS substrates. Six SERS substrates with different states (solid, suspended in liquid, and hydrogel), different plasmonic nanoparticle identities (silver, gold), as well as different nanoparticle sizes and shapes were used to support our hypothesis. The results show that there are excellent correlations between measured SERS intensities and IRayleigh as well as between SERS homogeneity and the variation of IRayleigh acquired with the six SERS substrates. These results suggest that IRayleigh can be used as an evaluation parameter for both SERS substrate efficiency and reproducibility.
1. Introduction
Surface-enhanced Raman spectroscopy (SERS) has been applied as an ultrasensitive analytical tool for a variety of analytes.1–4 The success of a SERS assay largely relies on the performance of a SERS substrate that consists of a suite of suspended or surface-bound plasmonic nanostructures. The calculated enhancement factor (EF) is commonly used to describe the performance of SERS substrates. The most commonly calculated EF for evaluating SERS substrate performance, also called the SERS substrate EF (SSEF), is defined as the concentration normalized ratio between the surface-enhanced Raman signal (ISERS) and the normal Raman signal (INormal) of a single analyte molecule.5–9 The value of EF is obtained experimentally using Equation 1, where ISERS and INormal are the Raman signals collected using the SERS substrate and a high concentration analyte solution. NSERS and NNormal are the number of analyte molecules within the excitation volume of the laser when it probes the SERS substrate or analyte solution, respectively.5, 7–10
| Equation 1 |
Although SSEF is very useful for evaluating SERS substrate performance, it is not trivial to obtain its value experimentally, mainly due to the difficulty of estimating NSERS accurately.6, 10 It is generally assumed that analyte molecules form a monolayer that fully covers the plasmonic nanoparticle surface. This is an assumption that sometimes deviates substantially from reality.8–10 For example, when a drop of analyte solution is applied to a substrate surface, the analyte molecules can form ~10 nm thick multilayers leading to an overestimation of EF.7 In addition, the distribution of analyte molecules across a SERS substrate is often not uniform due to the ‘coffee ring’ effect. In this situation, higher EF values obtained near the periphery relative to the center of the analyte covered area do not fairly reflect the uniformity of the SERS substrate.8 Even if the analyte molecules truly form a homogeneous monolayer on the SERS substrate, one still has to estimate the area a single molecule occupies on the surface. Such information may not be universally available for all potential analytes as it is highly dependent on the orientation of the analyte molecules relative to the plasmonic surface.11 For example, crystal violet (CV) – a commonly used Raman dye - exhibits an orientation parallel to the silver surface, while benezenethiol – another model Raman analyte – orients perpendicularly. This difference results in different molecule numbers within the excitation volume of the laser.12, 13 In some cases such as single molecule SERS (SMSERS), the focus is on molecules located within SERS hot spots that contribute most to the SERS signals. The EF values obtained within SERS hot spots can be five orders of magnitude larger than the average EF of the whole substrate.8, 10 Another prerequisite for accurate estimation of NSERS is to fully characterize the morphology of the plasmonic nanostructures that allows us to know the “effective area” the analyte molecules occupy within the excitation laser spot.8, 13, 14 However, knowledge of this parameter can be extremely challenging when the shapes and sizes of the plasmonic nanostructures of a given SERS substrate are highly heterogeneous. Because of these factors, the estimation of NSERS brings great uncertainty and difficulty to the calculation of EF values.
To circumvent the complexity involved in estimating NSERS, Le Ru et al. proposed the analytical enhancement factor (AEF) as a means to evaluate the efficiency of SERS as a tool for specific analytes.11 AEF is defined by Equation 2, where cnormal and cSERS are the concentrations of the analyte under non-SERS and SERS conditions.
| Equation 2 |
In contrast to SSEF, AEF is particularly useful for colloidal SERS substrates.15 For solid substrates, large variations in AEF are expected due to variations in the way analyte molecules are added to the substrates, as such variations affect analyte adsorption to the substrate surface. Analyte adsorption to a SERS substrate is generally described using the Langmuir isotherm,16, 17 such that the coverage of the analyte on the metal surface is only linearly correlated with the analyte solution concentration over a low concentration range. At concentrations above this linear range, surface coverage of analyte molecules can be significantly overestimated. For example, in a recent study, Fraire et al. reported two AEF values that varied over five orders of magnitudes (1×10⁸ vs. 3×10³) corresponding to two different cSERS (i.e., 10−11 vs. 10−7 M).15 Accordingly, AEF reflects the combined properties of both the SERS substrate and the number of analyte molecules on the surface rather than the intrinsic enhancing capability of the SERS substrate. As Le Ru stated, “It is not a good characterization of the SERS substrate itself, and it cannot be used to easily compare the performances of different substrates.”
The limit of detection (LOD) for specific analytes is important in terms of the practical applications of SERS. However, in a number of situations (e.g., for the detection of hydrophobic analytes such as atrazine or polyaromatic hydrocarbons), the LOD is not defined by the enhancing capability of the SERS substrate, but instead by the affinities of the analytes to the substrate surface.18–21
For all of the aforementioned reasons, a parameter that can evaluate the enhancing capability of a SERS substrate both quickly and accurately is desired. In this study, we propose an alternative evaluation parameter for SERS substrate performance that is based on the surface plasmon enhanced Rayleigh band (IRayleigh). IRayleigh reflects the integrated enhancing capability of the SERS substrate itself. Importantly, the determination of the IRayleigh value does not require analytes or extensive characterization of the substrate morphology. IRayleigh is a very simple and cost-effective evaluation approach to quickly compare newly developed SERS substrates. It is expected to work for any SERS substrate regardless of their form or morphology. This low wavenumber (< 150 µm) pseudo band, described in detail in a recently submitted manuscript, occurs due to the action of the longpass filter of the Raman instrument on the tail of the amplified spontaneous emission (ASE) of the laser. As illustrated in Fig. 1, the electromagnetic field of the incident laser (E0(ω0)) excites the collective oscillation of the conduction electrons within a SERS “hot spot” and this is where the highest SERS enhancement occurs.22–24 The electromagnetic fields for both Raman scattering and Rayleigh scattering (E0(ωRayleigh)) are enhanced by the same hot spot and reradiated as scattered fields (ES(ωRaman) and ES(ωRayleigh)). Recently, it was experimentally shown that Rayleigh scattering from analytes located in a SERS “hot spot” is enhanced by the same electromagnetic mechanism as Raman scattering.25 The ratio of the enhanced Raman intensity relative to the enhanced Rayleigh intensity is described by equation 3, where NA is the number of analyte molecules in the hot spot, NB is the number of background molecules in the hot spot, αA is the Raman scattering polarizability of analyte molecules, αB is the Rayleigh scattering polarizability of background molecules, I0(ω0) and I0(ωRayleigh) are the incident light intensity of the laser at frequency ω0 and ASE at frequency ωASE. In a SERS experiment, all of these parameters except NA remain constant. In other words, IRayleigh is proportional to IRaman, and this is our basis for applying IRayleigh to evaluate the performance of a SERS substrate. We note that the chemical enhancement mechanism is not considered in this study since the electromagnetic enhancement mechanism is typically the dominant one for SERS.26–29
| Equation 3 |
Figure 1.
Schematic of surface-enhanced Raman and surface-enhanced Rayleigh scattering from the same SERS “hot spot”.
To determine if IRayleigh can be used to predict SERS substrate performance, six SERS substrates were produced: gold nanoparticle (AuNP) aggregates, a commercial SERS substrate, two gold nanoparticle/bacterial cellulose (AuNP/BC) nanocomposites, and two silver nanoparticle/bacterial cellulose (AgNP/BC) nanocomposites. These SERS substrates were selected because they represent substrates suspended in liquid, solid, or hydrogel states, with different NP identities (gold and silver), and different NP shapes and sizes. These SERS substrates were initially scanned using a 785 nm laser without addition of an external analyte and IRayleigh was recorded. Following exposure to 4-mercaptobenzoic acid (4-MBA), the substrates were scanned a second time and the SERS intensity of 4-MBA (IRaman) was recorded. In this manner, the relationship between IRayleigh and IRaman was established. In addition to SERS intensity, reproducibility is another important factor that dictates SERS substrate performance.30–32 Accordingly, the variation of IRayleigh across a Raman map before analytes were added was recorded and compared with the variation in the Raman signal across a SERS map after 4-MBA addition. IRayleigh is expected to be a predictive factor of both SERS substrate efficiency as well as homogeneity.
2. Experimental
2.1 Preparation of BC-based substrates
AuNP/BC substrates were prepared using the following procedure:33 20 pieces of BC (0.5 cm × 0.5 cm) were immersed in 0.7 mL of 30 mM gold (III) chloride trihydrate (HAuCl4·3H2O) solution (Sigma-Aldrich). Following 30 s vortex mixing, the mixture was transferred to 50 mL of sodium citrate tribasic dehydrate (Na3Cit·2H2O) solution (Sigma-Aldrich) and then simmered for 1 h. Finally, the obtained nanocomposites were rinsed with copious amounts of DI water. Based on the concentrations of Na3Cit (1.2 mM or 12 mM) used, the nanocomposites obtained were named AuNP/BC-1.2 and AuNP/BC-12, respectively.
AgNP/BC substrates were prepared using the following procedure: one piece of BC was immersed in 0.7 mL of 25 mM silver nitrate solution (Sigma-Aldrich). Subsequently, 0.7 mL of 25 mM or 250 mM sodium borohydride solution were added. Following vortex mixing for 30 s, the mixture was kept at room temperature for 1 h and then washed with copious amounts of DI water. Based on the concentration of NaBH4 added (25 mM or 250 mM), the nanocomposites were named AgNP/BC-25 or AgNP/BC-250.
2.2 Preparation of AuNP aggregate
AuNP monomer (35±1 nm) suspension was synthesized via seed-mediated growth.34 AuNP aggregates (A-AuNPs) were then synthesized using the following procedure35: 0.5 mL 4-MBA (Sigma-Aldrich) ethanol solution (100 µM) was added into 0.5 mL AuNP monomer suspension. After 100 min, 100 µL of 500 µM thiolated poly(ethylene) glycol (HS-PEG) aqueous solution (Nanocs.) was added to the suspension to endow the aggregates with colloidal stability. After 20 min, the mixture was centrifuged for 15 min at 3000 rcf three times to remove excess reactants.
2.3 Exposing SERS substrates to 4-MBA
The commercial SERS substrate (Ocean Optics) and the four nanocomposites were immersed in 5 mL 4-MBA in ethanol (1 mM) for 1–3 h. Following removal from the solution, the SERS substrates were air dried for 1 h and subsequently scanned by Raman spectroscopy. For A-AuNPs, 4-MBA was added to the substrate during the synthesis process as described in Section 2.2.
2.4 Instrumentation
All of the Raman spectra were collected using a commercial Raman spectrometer (Alpha500R, WITec). Backscattered photons were dispersed with a 300 groove mm−1 grating and detected by a Peltier CCD. The laser wavelength used was 785 nm and the integration time for each single spectrum was 0.5 s. Each collected Raman map (100 µm × 100 µm) consists of 400 pixels (20 lines and 20 points per line). The Raman maps tracking the intensities of IRayleigh and IRaman were made using an in-house Matlab script. The photoluminescence background of the SERS spectrum is low under 785 nm laser illumination, so the pseudo band at 84 cm−1 does not reflect photoluminescence, but instead the surface-enhanced ASE. The photoluminescence background was subtracted from the collected spectra by baseline correction using an asymmetric least square smoothing based on the published Matlab scripts of Eilers.36 The morphologies of the nanocomposites were characterized by field emission scanning electron microscope (LEO (Zeiss) 1550).
3. Results
3.1 IRayleigh of the SERS substrates
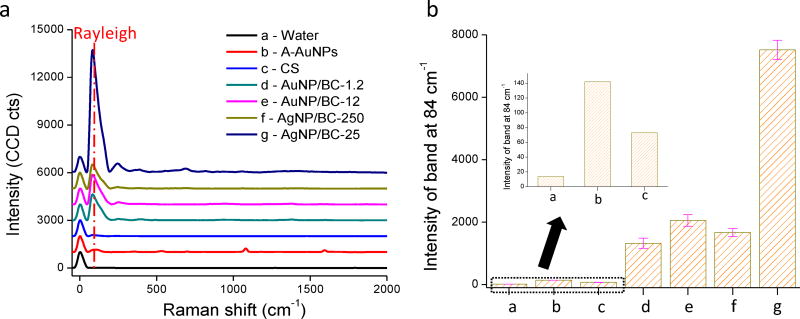
This study set out to test the capacity for IRayleigh to predict SERS substrate performance and thus the Raman spectra of the six SERS substrates in the absence of the analytes were initially collected. An exception was A-AuNPs because it was challenging to synthesize colloidally stable AuNP aggregates without addition of 4-MBA. DI water was used as a negative control. As shown in Fig. 2a, an extremely weak pseudo-band at 84 cm−1 was observed for DI water. This pseudo-band originates when the longpass filter of the instrument cuts the ASE of the laser, as discussed previously. As stated in our recent submission, this band was enhanced significantly in the presence of SERS “hot spots” and reflects the integrated efficiency of these “hot spots”. It was observed here that IRayleigh (defined as the maximum measured intensity of the pseudo-band) for all six SERS substrates was much greater than that from DI water (Fig. 2a).
Figure 2.
a) Raman spectra of the SERS substrates without analyte addition (a. water; b. A-AuNPs; c. commercial substrate (CS); d. AuNP/BC-1.2; e. AuNP/BC-12; f. AgNP/BC-250; g. AgNP/BC-25); b) Intensities of the Rayleigh band at 84 cm−1 of all substrates; Inset shows the intensities of the Rayleigh band at 84 cm−1 for substrates a–c.
The intensities of the Rayleigh bands at 84 cm−1 (IRayleigh) for each of the SERS substrates are shown in Fig. 2b. The commercial substrate (CS) exhibited the lowest IRayleigh amongst the six SERS substrates. This substrate is optimized for SERS detection at lower wavelength laser excitation (i.e., 638 nm), so our use of a 785 nm laser may be one reason why the measured IRayleigh is low. A-AuNPs also exhibited a low IRayleigh due to the low “hot spot” density of the aggregates. The four tested nanocomposites exhibited much larger IRayleigh than either CS or the A-AuNPs because there are large amounts of gold or silver nanoparticles constrained within a film with a thickness of several micrometers.33, 37 Among the four nanocomposites, AgNP/BC-25 exhibits much larger IRayleigh than the others because AgNPs are more efficient plasmonic enhancers than AuNPs.4 The other AgNP-based substrate, AgNP/BC-250, exhibited similar IRayleigh to the tested AuNP-based substrates because the AgNP density in it is much lower than in the other three nanocomposites (Fig. S1).
3.2 IRayleigh as a predictive factor for ISERS
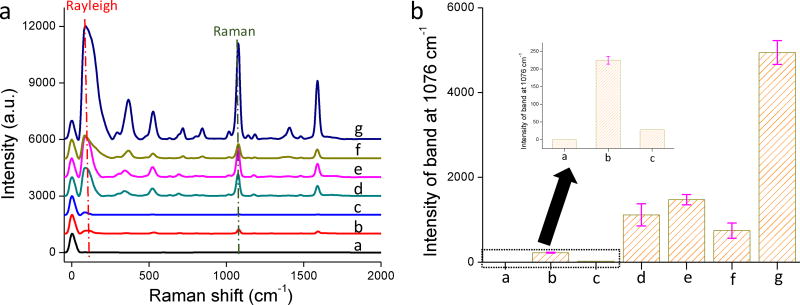
To investigate their SERS efficiency, the six SERS substrates were exposed to 1 mM 4-MBA except for the A-AuNPs, to which 4-MBA was added during synthesis. A relatively high 4-MBA concentration was selected to ensure the NP surfaces were saturated by the analytes. The SERS spectra of the six substrates after exposure to 4-MBA are shown in Fig. 3a. As a negative control, 1 mM 4-MBA aqueous solution exhibited no Raman signal under these measurement conditions. As shown in Fig. 3a, all six SERS substrates enhanced the Raman bands of 4-MBA (522, 696, 1076, 1181, and 1590 cm−1).35 The Rayleigh bands at 84 cm−1 are still present in the spectra and the addition of 4-MBA has negligible influence on IRayleigh. Because the Raman band at 1076 cm−1 (benzene ring vibration) is the strongest, it was selected to evaluate SERS substrate efficiency.
Figure 3.
a) SERS spectra of 4-MBA on different SERS substrates; b) The intensities of SERS band at 1076 cm−1 of all the substrates. Inset shows the intensities of the SERS band at 1076 cm−1 for the substrates a–c.
The intensities of the Raman bands at 1076 cm−1 of the SERS substrates are shown in Fig. 3b. A-AuNPs and CS exhibited the lowest IRaman, while also exhibiting the lowest IRayleigh. AuNP/BC-1.2, AuNP/BC-12, and AgNP/BC-250 exhibited similar and moderate IRayleigh (Fig. 2b) and they also exhibited similar and moderate IRaman (Fig. 3b). AgNP/BC-25 exhibited the highest IRayleigh and coincidently, it also exhibited the highest IRaman. These results collectively suggest that the SERS substrates showing higher intensity Rayleigh bands also show higher intensity Raman bands. In other words, IRayleigh qualitatively reflects the SERS efficiency of a SERS substrate.
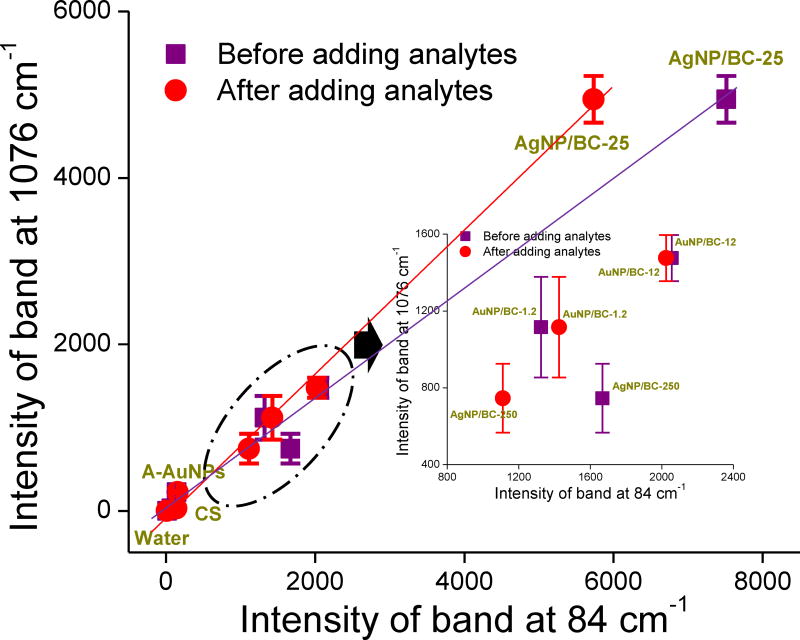
To quantitatively illustrate the relationship between IRaman and IRayleigh, the variation in the intensities of the Raman band at 1076 cm−1 as a function of the Rayleigh band at 84 cm−1 is shown in Fig. 4. Because the SERS substrates used to acquire Raman spectra before and after adding 4-MBA were different pieces from the same batch, there were two IRayleigh measurements obtained for each type of SERS substrate. When using IRayleigh obtained prior to adding 4-MBA as the abscissa, the ISERS from the six SERS substrates and water roughly follows a linear relationship with IRayleigh. A-AuNPs and CS showed the lowest SERS and Rayleigh signals. The three nanocomposites AuNP/BC-1.2, AuNP/BC-12, and AgNP/BC-250 showed moderate SERS and Rayleigh signals. AgNP/BC-25 showed both the highest SERS and Rayleigh signals (Fig. 4). However, if we focus on the three samples exhibiting moderate signals, AgNP/BC-250 showed higher IRayleigh, but lower IRaman than AuNP/BC-0.4. We attribute this to the large piece-to-piece variability of AgNP/BC-250 (details discussed in the following sections). When IRayleigh measured after addition of 4-MBA was plotted on the abscissa, the measured linear relationships improve because the sample-to-sample variability of a SERS substrate is excluded (i.e., IRayleigh and ISERS are from the same spectrum). These results support the utility of IRayleigh as a quantitative tool for predicting SERS efficiency if the sample-to-sample variation of SERS substrates from the same batch is small.
Figure 4.
Variation of the intensities of Raman band at 1076 cm−1 as a function of the Rayleigh band at 84 cm−1 before and after adding 4-MBA. Each IRayleigh or IRaman value is the average of three Raman maps; Each Raman map contains 400 single spectra.
We note that the position of IRayleigh is dependent on the long pass filter employed. As shown in Fig. S2, the maximum of IRayleigh shifts to 126 cm−1 when the edge filter of our Raman instrument was replaced with another that cuts at 126 cm−1 and to 87 cm−1 when a second Raman instrument was employed. As expected, based on instrument-to-instrument variability, I0(ωRayleigh) in Equation 3 changes when switching the Raman instrument. Accordingly, if we define ωRayleigh as the wavenumber corresponding to the maximum Rayleigh band intensity then IRaman/IRayleigh changes accordingly (1.70 vs 0.97, Table S1). If we define ωRayleigh as a fixed wavenumber (e.g., 126 cm−1) for the Rayleigh bands collected with the two instruments, then the ratio IRaman/IRayleigh is much more constant (1.70 vs 1.62, Table S1). These results suggest that IRayleigh has potential to normalize Raman signals collected from different instruments so long as ωRayleigh is kept constant. Additional experiments to further evaluate this possibility are ongoing.
This approach defined here performs well for the rapid evaluation of SERS substrate performance when instrumental conditions (edge filters and laser systems) are fixed. However, for SERS substrates characterized using a range of Raman instruments from different labs, it may be challenging to directly compare absolute values of IRayleigh due to the variability of long pass filters and laser systems. To extend this approach towards a universal evaluation parameter, we suggest the use of readily available SERS substrates (e.g., AuNP aggregated colloids, commercial substrates) as standard test substrates. If our approach is correct, the ratio of the IRayleigh values for the substrate being evaluated and the standard substrate should remain constant no matter what Raman instrument is used to characterize it. To provide preliminary support of this hypothesis, A-AuNP was used as a standard SERS substrate (substrate #1) and AuNP/BC-1.2 was used as a substrate to be evaluated (substrate #2). As shown in Fig. S3 and Table S2, the ratio of IRayleigh values for substrate #2 and substrate #1 remained virtually constant for data collected using two different Raman instruments. This result therefore suggests this approach can be extended to evaluate the performance of SERS substrates prepared by different labs or characterized with different Raman instruments.
3.3 Variation of IRayleigh across a Raman map
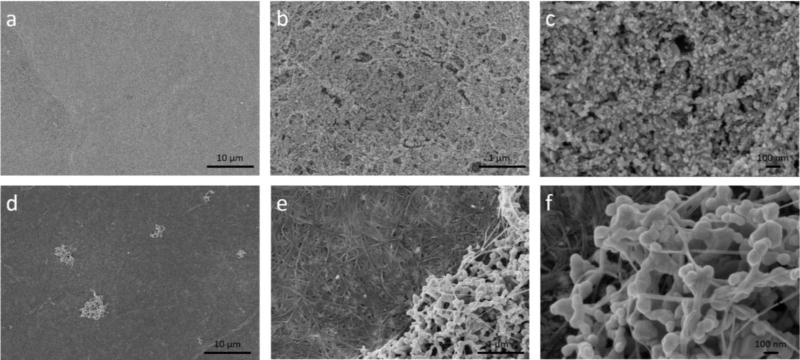
In addition to intensity, the signal reproducibility across a SERS substrate is another important factor that dictates SERS substrate performance.38 Since IRayleigh reflects the “hot spot” efficiency from a single pixel across a SERS substrate, the variation in IRayleigh is expected to be an indicator of SERS substrate uniformity. To illustrate this, two SERS substrates – AuNP/BC-1.2 and AgNP/BC-250 that exhibited large differences in uniformity, were used as test samples. The morphologies of these nanocomposites were characterized by SEM. As shown in Fig. 5a, AuNP/BC-1.2 exhibits excellent homogeneity across a 2035 µm2 area. When the magnification was increased to 50000×, we observe that the nanofibers are fully covered by AuNPs and the homogeneity is excellent across a 21 µm2 area (Fig. 5b). When the magnification was further increased to 150000×, we can clearly see AuNPs with heterogeneous shapes and sizes densely distributed across a 2.3 µm2 area (Fig. 5c). The heterogeneity in AuNP size and shape is expected to exert little influence on the homogeneity of the SERS signal because the 10× objective used here has a laser spot size of 2.0 µm2. The numerous “hot spots” generated by the highly aggregated AuNPs account for the high IRayleigh and IRaman obtained previously.
Figure 5.
SEM images of the AuNP/BC-1.2 substrate with a) 5000×, b) 50000×, and c) 150000× magnifications; SEM images of the AgNP/BC-250 substrate with d) 5000×, e) 50000×, and f) 150000× magnifications. Each substrate was air dried and sputter coated with gold before scanning.
AgNP/BC-250 was much more heterogeneous than AuNP/BC-1.2. As shown in Fig. 5d, large AgNP clusters were sporadically distributed across a 2035 µm2 area. When the magnification was increased to 50000×, we can see that a majority of the AgNPs were concentrated in clusters leaving other areas covered with a very low density of AgNPs (Fig. 5e). When the magnification was further increased to 150000×, we can see the irregular shapes and sizes of the AgNPs. The AgNP size, shape and uniformity of the substrate can be adjusted by changing the NaBH4 concentration. As shown in Fig. S1d–f, AgNP/BC-25 exhibited much better uniformity than AgNP/BC-250.
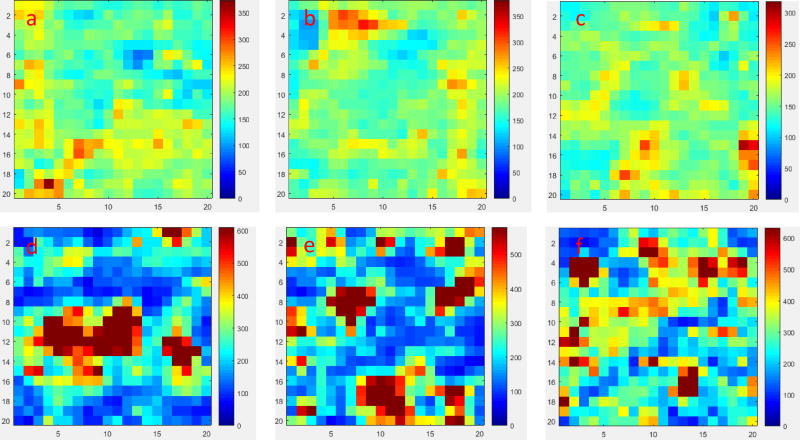
As revealed by the SEM images in Fig. 5, the homogeneity of AuNP/BC-1.2 is much better than that of AgNP/BC-250. We expected that the variation in IRayleigh across the two SERS substrates would be consistent with their relative uniformities. To test this hypothesis, the two nanocomposites were each scanned across three randomly selected areas and the collected Raman maps are shown in Fig. 6. As shown in Fig. 6a–c, a majority of the pixels in the Raman maps of AuNP/BC-1.2 exhibited light blue colors indicating most of the IRayleigh values are close to the average. Only a small portion of pixels exhibited yellow and red colors that represent IRayleigh values above the average. We use relative standard deviation (RSD) to describe the variations of IRayleigh across the Raman maps, which are 18.9%, 17.4%, and 17.3%, respectively.
Figure 6.
a–c) Raman maps made by tracking IRayleigh at three randomly selected areas of AuNP/BC-1.2; d–f) Raman maps made by tracking IRayleigh at three randomly selected areas of AgNP/BC-250. Each Raman map contains 400 single spectra.
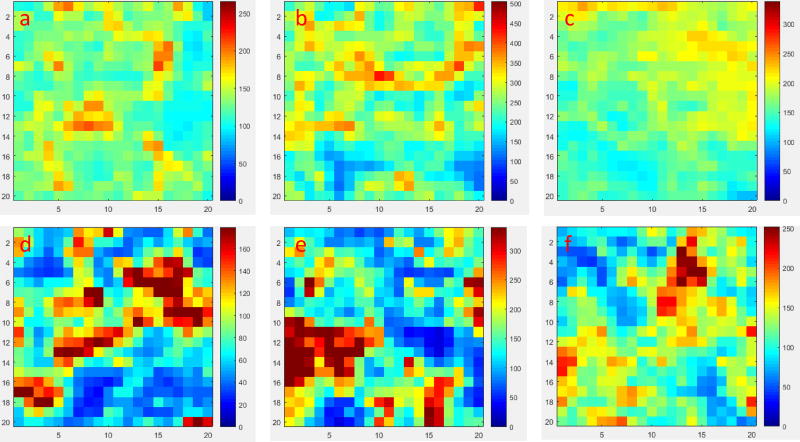
As shown in Fig. 6d–f, the Raman maps collected from AgNP/BC-250 were substantially less homogeneous than those collected using AuNP/BC-1.2. Clusters of pixels exhibiting dark red colors corresponding to extremely high IRayleigh values were present; we speculate these spots represent the locations of the AgNP clusters (Fig. 5d). Also apparent were pixel areas exhibiting dark blue colors that correspond to extremely low IRayleigh values that we speculate reflect the areas generally uncovered by AgNPs (Fig. 5d). The RSD values of the three Raman maps of AuNP/BC-250 were 95.2%, 78.0%, and 56.3%, respectively, which are significantly greater than those for AuNP/BC-1.2. The variation of RSD values among the three Raman maps collected for AgNP/BC-250 (RSD=25.5%) is much greater than that of AuNP/BC-1.2 (RSD=5.0%). These results collectively demonstrate that AuNP/BC-1.2 is much more uniform than AgNP/BC-250 – a result that is consistent with the SEM observations.
3.4 Variation of IRayleigh as a predictive factor for SERS substrate uniformity
To determine if the variation in IRayleigh can effectively predict the variation of IRaman, AuNP/BC-1.2 and AgNP/BC-250 were exposed to 1 mM 4-MBA in ethanol. Following air drying, the SERS maps from three randomly selected areas were collected. As shown in Fig. 7a–c, the SERS maps made by tracking the Raman band at 1076 cm−1 of AuNP/BC-1.2 exhibited RSD values of 18.1%, 22.6%, 15.9%, respectively. In addition, the RSD values of SERS maps collected using AgNP/BC-250 were 55.2%, 55.1%, and 32.4% (Fig. 7d–f). AuNP/BC-1.2 exhibiting lower variation in IRayleigh than AgNP/BC-250 also exhibits lower variation in IRaman, which meets our expectation.
Figure 7.
a–c) SERS maps made by tracking the band at 1076 cm−1 at three randomly selected areas of AuNP/BC-1.2 after exposing to 1 mM 4-MBA solution; d–f) SERS maps made by tracking the band at 1076 cm−1 at three randomly selected areas of AgNP/BC-250 after exposing to 1 mM 4-MBA solution.
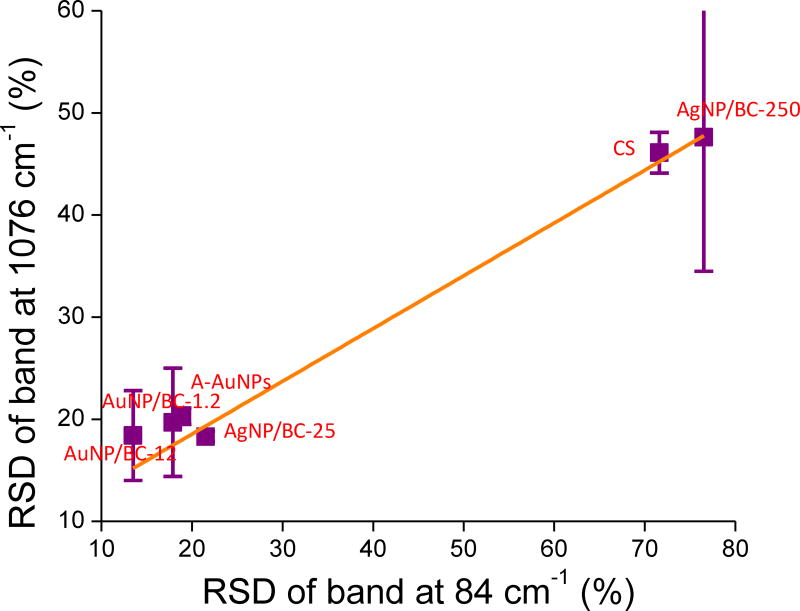
To confirm that the variation of IRayleigh can be used to predict the uniformity of a SERS substrate, the variations in the RSD values of the Raman band at 1076 cm−1 as a function of the RSD values of the Rayleigh band at 84 cm−1 for all the six SERS substrates introduced in Fig. 2 are shown in Fig. 8. AgNP/BC-250 not only exhibited the highest RSD value for IRayleigh but also the largest error bar that represented the standard deviation of RSD values calculated from three SERS maps. In addition to AgNP/BC-250, CS also showed a very high average RSD value for IRayleigh. As expected, these two substrates also exhibited the highest RSD values of IRaman. The other four substrates, including AuNP/BC-1.2, AuNP/BC-12, AgNP/BC-25, and A-AuNPs exhibited similar RSD values ~20% of IRayleigh and also exhibited similar RSD values ~20% of IRaman. As shown in Fig. 8, the RSD values of IRaman of the six SERS substrates roughly increased linearly with the increase in RSD values of IRayleigh. Based on the excellent correlation between IRayleigh and IRaman it appears that the variation of IRayleigh can be used as a qualitative tool for predicting the reproducibility of a SERS substrate. Additonal tests are currently ongoing to furhter evaluate the strength of this correlation.
Figure 8.
The varation of RSD values of the Raman bands at 1076 cm−1 as a function of RSD values of the Rayleigh bands at 84 cm−1 for the six SERS substrates. Each RSD value is the average of three RSD values calculated from three Raman maps. Each Raman map is collected from a 100 µm × 100 µm area and contains 400 single spectra.
In addition to 785 nm laser, 633 nm laser was also employed in this study. The SERS spectrum of 4-MBA on AuNP/BC-1.2 collected with 633 nm laser is shown in Fig. S4a. The SERS map constructed by tracking the Rayleigh band at 135 cm−1 almost replicates that constructed by tracking the Raman band at 1076 cm−1, i.e., the spot with higher Rayleigh intensity always exhibits higher Raman intensity across the map (Fig. S4b&c). This result suggests that IRayleigh can be used to evaluate the performance of SERS substrates when using alternative laser excitation wavelengths.
Conclusions and Discussion
This study proposes an alternative evaluation parameter for SERS substrate performance – the surface plasmon-enhanced Rayleigh band that originates from the ASE of the excitation laser. The intensities of the Rayleigh band (IRayleigh) of the six SERS substrates follow a linear relationship with the intensities of the primary Raman band of 4-MBA (IRaman), thus indicating IRayleigh can be used as a quantitative tool for predicting the efficiency of a SERS substrate. The RSD values of IRayleigh across Raman maps of the six SERS substrates roughly follow a linear relationship with the RSD values of IRaman, indicating that variations in IRayleigh can be used as a qualitative tool for predicting SERS substrate reproducibility. Accordingly, IRayleigh can be used as a predictive factor for both SERS substrate efficiency and reproducibility.
As an evaluation parameter for SERS substrate performance, IRayleigh exhibits several advantages over EF. First, it does not require analyte addition to acquire IRayleigh values. EF values are typically obtained experimentally by assuming the plasmonic nanostructures are fully covered by the analytes. This assumed condition can substantially deviate from reality when the affinity between a given analyte and the nanostructures is low and the shape and size of the nanostructures are irregular and heterogeneous. For example, it is extremely difficult to measure EF accurately for our BC-based substrates due to the large variation in NP size and shape. Second, IRayleigh is an intrinsic property of the SERS substrate, which is independent of the analytes. EF is dependent on the analyte, (i.e., one SERS substrate can have many EF values for different analytes). Therefore, it is challenging to readily compare the large number of SERS substrates reported in the literature. IRayleigh is intrinsic to a SERS substrate and reflects the integrated “hot spot” efficiency within the laser excitation volume, irrespective of the size, shape, or identity of the plasmonic nanostructures. Overall, IRayleigh provides an easy but universally applicable “ruler” (with the help of a standard SERS substrate) for evaluating SERS substrate performance.
Supplementary Material
Acknowledgments
This research was supported by the National Institutes of Health (NIH) through the NIH Director’s New Innovator Award Program (1-DP2-A1112243) and through US National Science Foundation grants CBET-1133746 and OISE-1545756 to P.V. Additional support for H.W. was provided by the Virginia Tech Graduate School through the Sustainable Nanotechnology Interdisciplinary Graduate Education Program (VT-SuN IGEP).
References
- 1.Schlücker S. Angew. Chem. Int. Ed. 2014;53:4756–4795. doi: 10.1002/anie.201205748. [DOI] [PubMed] [Google Scholar]
- 2.Xu L, Lei Z, Li J, Zong C, Yang CJ, Ren B. J. Am. Chem. Soc. 2015;137:5149–5154. doi: 10.1021/jacs.5b01426. [DOI] [PubMed] [Google Scholar]
- 3.Huang J, Zhao Y, Zhang X, He L, Wong T, Chui Y, Zhang W, Lee S. Nano Lett. 2013;13:5039–5045. doi: 10.1021/nl401920u. [DOI] [PubMed] [Google Scholar]
- 4.Wei H, Abtahi SMH, Vikesland PJ. Environ. Sci. Nano. 2015;2:120–135. [Google Scholar]
- 5.Camargo PH, Au L, Rycenga M, Li W, Xia Y. Chem. Phys. Lett. 2010;484:304–308. doi: 10.1016/j.cplett.2009.12.002. [DOI] [PMC free article] [PubMed] [Google Scholar]
- 6.Sivanesan A, Adamkiewicz W, Kalaivani G, Kamińska A, Waluk J, Hołyst R, Izake EL. Analyst. 2014;140:489–496. doi: 10.1039/c4an01778a. [DOI] [PubMed] [Google Scholar]
- 7.Dawson P, Duenas J, Boyle M, Doherty M, Bell S, Kern A, Martin O, Teh A-S, Teo K, Milne W. Nano Lett. 2011;11:365–371. doi: 10.1021/nl102838w. [DOI] [PubMed] [Google Scholar]
- 8.Schmidt MS, Hübner J, Boisen A. Adv. Mater. 2012;24 doi: 10.1002/adma.201103496. [DOI] [PubMed] [Google Scholar]
- 9.Li J, Chen C, Jans H, Xu X, Verellen N, Vos I, Okumura Y, Moshchalkov VV, Lagae L, Van Dorpe P. Nanoscale. 2014;6:12391–12396. doi: 10.1039/c4nr04315d. [DOI] [PubMed] [Google Scholar]
- 10.Haidar I, Lévi G, Mouton L, Aubard J, Grand J, Lau-Truong S, Neuville DR, Félidj N, Boubekeur-Lecaque L. Phys. Chem. Chem. Phys. 2016;18:32272–32280. doi: 10.1039/c6cp06218k. [DOI] [PubMed] [Google Scholar]
- 11.Le Ru E, Blackie E, Meyer M, Etchegoin PG. J. Phys. Chem. C. 2007;111:13794–13803. [Google Scholar]
- 12.Gui JY, Stern DA, Frank DG, Lu F, Zapien DC, Hubbard AT. Langmuir. 1991;7:955–963. [Google Scholar]
- 13.Fang Y, Seong N-H, Dlott DD. Science. 2008;321:388–392. doi: 10.1126/science.1159499. [DOI] [PubMed] [Google Scholar]
- 14.Hu M, Ou FS, Wu W, Naumov I, Li X, Bratkovsky AM, Williams RS, Li Z. J. Am. Chem. Soc. 2010;132:12820–12822. doi: 10.1021/ja105248h. [DOI] [PubMed] [Google Scholar]
- 15.Fraire JC, Sueldo Ocello VN, Allende LG, Veglia AV, Coronado EA. J. Phys. Chem. C. 2015;119:8876–8888. [Google Scholar]
- 16.Shen W, Lin X, Jiang C, Li C, Lin H, Huang J, Wang S, Liu G, Yan X, Zhong Q. Angew. Chem. Int. Ed. 2015;54:7308–7312. doi: 10.1002/anie.201502171. [DOI] [PubMed] [Google Scholar]
- 17.Kasera S, Biedermann F, Baumberg JJ, Scherman OA, Mahajan S. Nano Lett. 2012;12:5924–5928. doi: 10.1021/nl303345z. [DOI] [PubMed] [Google Scholar]
- 18.Wei H, Vikesland PJ. Sci. Rep. 2015;5 doi: 10.1038/srep18131. [DOI] [PMC free article] [PubMed] [Google Scholar]
- 19.Álvarez-Puebla RA, Contreras-Cáceres R, Pastoriza-Santos I, Pérez-Juste J, Liz-Marzán LM. Angew. Chem. Int. Ed. 2009;48:138–143. doi: 10.1002/anie.200804059. [DOI] [PubMed] [Google Scholar]
- 20.Alvarez-Puebla RA, Liz-Marzan LM. Chem. Soc. Rev. 2012;41:43–51. doi: 10.1039/c1cs15155j. [DOI] [PubMed] [Google Scholar]
- 21.Guerrini L, Garcia-Ramos JV, Domingo C, Sanchez-Cortes S. Langmuir. 2006;22:10924–10926. doi: 10.1021/la062266a. [DOI] [PubMed] [Google Scholar]
- 22.Kleinman SL, Frontiera RR, Henry AI, Dieringer JA, Van Duyne RP. Phys. Chem. Chem. Phys. 2013;15:21–36. doi: 10.1039/c2cp42598j. [DOI] [PubMed] [Google Scholar]
- 23.Stranahan SM, Willets KA. Nano Lett. 2010;10:3777–3784. doi: 10.1021/nl102559d. [DOI] [PubMed] [Google Scholar]
- 24.Shiohara A, Wang Y, Liz-Marzan LM. J. Photochem. Photobiol. C. 2014;21:2–25. [Google Scholar]
- 25.Alonso-González P, Albella P, Schnell M, Chen J, Huth F, García-Etxarri A, Casanova F, Golmar F, Arzubiaga L, Hueso L. Nat. Commun. 2012;3:684. doi: 10.1038/ncomms1674. [DOI] [PMC free article] [PubMed] [Google Scholar]
- 26.Le Ru E, Etchegoin P. Chem. Phys. Lett. 2006;423:63–66. [Google Scholar]
- 27.Xu H, Aizpurua J, Käll M, Apell P. Phys. Rev. E. 2000;62:4318. doi: 10.1103/physreve.62.4318. [DOI] [PubMed] [Google Scholar]
- 28.Schatz GC, Young MA, Van Duyne RP. Surface-enhanced Raman scattering. Springer; 2006. pp. 19–45. [Google Scholar]
- 29.Maitani MM, Ohlberg DA, Li Z, Allara DL, Stewart DR, Williams RS. J. Am. Chem. Soc. 2009;131:6310–6311. doi: 10.1021/ja809347y. [DOI] [PubMed] [Google Scholar]
- 30.Niu C, Zou B, Wang Y, Cheng L, Zheng H, Zhou S. Langmuir. 2016;32:858–863. doi: 10.1021/acs.langmuir.5b03802. [DOI] [PubMed] [Google Scholar]
- 31.Zheng Y, Thai T, Reineck P, Qiu L, Guo Y, Bach U. Adv. Funct. Mater. 2013;23:1519–1526. [Google Scholar]
- 32.Zhang C, Jiang SZ, Yang C, Li CH, Huo YY, Liu XY, Liu AH, Wei Q, Gao SS, Gao XG. Sci. Rep. 2016;6:26243. doi: 10.1038/srep25243. [DOI] [PMC free article] [PubMed] [Google Scholar]
- 33.Wei H, Vikesland PJ. Sci. Rep. 2014;5:18131–18131. doi: 10.1038/srep18131. [DOI] [PMC free article] [PubMed] [Google Scholar]
- 34.Brown KR, Walter DG, Natan MJ. Chem. Mater. 2000;12:306–313. [Google Scholar]
- 35.Wei H, Willner MR, Marr LC, Vikesland PJ. Analyst. 2016;141:5159–5169. doi: 10.1039/c6an00650g. [DOI] [PMC free article] [PubMed] [Google Scholar]
- 36.Eilers PH. Anal. Chem. 2004;76:404–411. doi: 10.1021/ac034800e. [DOI] [PubMed] [Google Scholar]
- 37.Wei H, Rodriguez K, Renneckar S, Leng W, Vikesland PJ. Analyst. 2015;140:5640–5649. doi: 10.1039/c5an00606f. [DOI] [PubMed] [Google Scholar]
- 38.Lin D, Wu Z, Li S, Zhao W, Ma C, Wang J, Jiang Z, Zhong Z, Zheng Y, Yang X. ACS Nano. 2017;11:1478–1487. doi: 10.1021/acsnano.6b06778. [DOI] [PubMed] [Google Scholar]
Associated Data
This section collects any data citations, data availability statements, or supplementary materials included in this article.


