

Abstract
A widespread approach to modern cancer therapy is to identify a single oncogenic driver gene and target its mutant protein product (e.g. EGFR inhibitor treatment in EGFR-mutant lung cancers). However, genetically-driven resistance to targeted therapy limits patient survival. Through genomic analysis of 1122 EGFR-mutant lung cancer cell-free DNA samples and whole exome analysis of seven longitudinally collected tumor samples from an EGFR-mutant lung cancer patient, we identify critical co-occurring oncogenic events present in most advanced-stage EGFR-mutant lung cancers. We define new pathways limiting EGFR inhibitor response, including WNT/β-catenin and cell cycle gene (e.g. CDK4, CDK6) alterations. Tumor genomic complexity increases with EGFR inhibitor treatment and co-occurring alterations in CTNNB1, and PIK3CA exhibit non-redundant functions that cooperatively promote tumor metastasis or limit EGFR inhibitor response. This study challenges the prevailing single-gene driver oncogene view and links clinical outcomes to co-occurring genetic alterations in advanced-stage EGFR-mutant lung cancer patients.
Introduction
The current paradigm in cancer genetics and therapy is to view and treat oncogene-positive disease (e.g. EGFR-mutant non-small cell lung cancer; NSCLC) primarily through the lens of one oncogenic alteration (e.g. oncogenic, mutant EGFR, see Supplementary note). This approach does not address the potential risk of co-occurring genetic alterations present in the cancer, treating one “driver” as mutually exclusive from any other. Despite limited and sporadic reports1–5, the prevalence of co-occurring genetic alterations that impact clinical outcomes in advanced-stage lung cancers with a primary oncogenic driver is largely unknown, although recent work suggests a potential role for TP53 mutations6,7. This lack of data on the prevalence and impact of multiple co-occurring genetic events exists not only for treatment-naïve cancers but also for cancers that have acquired resistance to the initial targeted therapy (e.g. cancers with EGFR p.Thr790Met). An open question in the field is to what extent co-occurring genetic alterations cooperate with a primary driver gene (e.g. mutant EGFR) to promote tumor progression and therapy resistance in both the targeted therapy-naïve and acquired resistance settings (see Supplementary note).
This knowledge gap exists because to date large-scale genome sequencing efforts in NSCLC contain mostly early-stage tumors8, leading to the current prevailing model of one driver oncogene in each individual cancer. Yet, early-stage patients are not treated with targeted therapy. In this study, we tested the hypothesis that co-occurring genetic alterations commonly exist and cooperate with the primary driver as co-drivers to promote tumor progression and limit targeted therapy response. Here, we link clinical outcomes to genetic co-alterations in the largest cohort of advanced-stage EGFR-mutant lung cancers profiled by multiplex sequencing to date.
Results
cfDNA analysis of advanced EGFR-mutant lung cancers
To determine the prevalence of co-occurring genetic alterations in advanced-stage EGFR-mutant patients, we undertook a large-scale analysis using a clinically-validated cell free (cf)DNA assay Supplementary Tables 1 and 2, Methods). This cfDNA exome platform is approved for clinical use and measures single-nucleotide variants, small insertions/deletions, gene rearrangements/fusions, and copy number gain (CNG) across 68 clinically-relevant cancer genes (Supplementary Table 2, Methods)9,10. We defined the landscape of somatic genetic alterations present in 1122 EGFR mutation-positive and 1008 EGFR mutation-negative patients with advanced-stage (Stage III/IV) NSCLC (Supplementary Tables 3–4, and Datasets 1 and 2).
We filtered for mutations that were non-synonymous and validated or predicted to impact gene function (Methods), yielding 1122 EGFR-mutation-positive and 944 EGFR mutation-negative cases. This dataset of advanced-stage EGFR-mutant patients differs from TCGA and other genomic compendia of lung cancer that contain largely early-stage tumors.
Analysis of the 1122 EGFR-mutant patient cohort revealed the widespread presence of co-occurring genetic alterations, in addition to the EGFR driver mutation (Fig. 1a). The EGFR-mutant cases contained a mean of 2.58 ± 1.7 (S.E.M) genetic alterations beyond EGFR (out of the 68 genes profiled). When including the EGFR mutation, the range of detectable alterations was 1–13. Most patients (92.9%, 1043/1122) harbored at least one additional variant of known or likely functional significance beyond the EGFR driver mutation (Supplementary Dataset 1). The majority (89.8%; 3033/3375) of the genetic co-mutations present in the EGFR mutation-positive cohort have verified or likely functional impact (by in silico modeling, Methods, Supplementary DataSet 1), with only 10.2% (345/3375) of these co-mutations classified as likely passenger events (neutral or unknown functional impact). 16.1% (415/2578) of the mutations present in the EGFR mutation-negative cohort were classified as passenger events (P = 1.3E−11, two-tailed Fisher’s exact test, OR: 0.64, proportions test, Supplementary Dataset 2; comparing the prevalence of mutations classified as passenger events in the EGFR mutation-positive cohort versus the EGFR-mutation-negative cohort) (Fig. 1a–b, Supplementary Table 3). The data show that canonical EGFR driver mutations co-occur with oncogenic driver alterations in several other genes, including PIK3CA, BRAF, MET, MYC, CDK6, and CTNNB1. Comparison of the frequency of genetic co-alterations present in the EGFR mutation-positive samples (n=1122) with those present in the stage-matched EGFR mutation-negative samples (n=944) revealed significant enrichment for certain genetic events (q-values determined by two-tailed Fisher’s exact test Benjamini-Hocheberg correction for multiple hypotheses) within the EGFR-mutant cancers (Supplementary Table 3). There was enrichment for co-alterations in CTNNB1 [frequency of alteration in EGFR mutation-positive cases, 5.3% (60/1122) vs. EGFR mutation-negative cases, 1.8% (17/944), q = 2.0E−04], CDK6 [frequency of alteration in EGFR mutation-positive cases 7.0% (79/1122) vs. EGFR mutation-negative cases 3.1% (30/944), q = 8.0E−04], AR [frequency of alteration in EGFR mutation-positive cases, 5.1% (57/1122) vs. EGFR mutation-negative cases, 2.6% (25/944), q = 0.02], and a modest difference in TP53 [frequency of alteration in EGFR mutation-positive cases, 54.6% (613/1122) vs. EGFR mutation-negative cases, 50.3% (475/944), q = 0.14] in the EGFR-mutant cohort (n=1122) compared to the stage-matched EGFR mutation-negative samples (n=944) (Fig. 1a–d, Supplementary Table 3, Supplementary Datasets 1 and 2). Pathway-level analysis showed selection for co-alterations in WNT/CTNNB1 [144/1122 vs. 92/944, q = 0.06) and hormone signaling genes (59/1122 vs. 29/944, q = 0.04) in the EGFR-mutant cohort, whereas alterations in receptor tyrosine kinase (RTK) (310/1122 vs. 361/944, q = 2.0E−06), MAPK pathway genes (e.g. KRAS) (291/1122 vs. 453/944, q = 2.8E−24) and gene fusions (e.g. ALK) (48/1122 vs. 67/944, q = 0.02) were enriched in the EGFR mutation-negative cohort (Fig. 1e, Supplementary Table 2). This large-scale dataset uncovers a potential role for WNT/CTNNB1 and cell cycle gene aberrations in the pathogenesis of advanced-stage EGFR-mutant NSCLC.
Figure 1. Co-occurring genomic alterations detectable in cell-free DNA of advanced-stage EGFR-mutant positive compared to EGFR-mutant negative non-small cell lung cancer (NSCLC) patients.
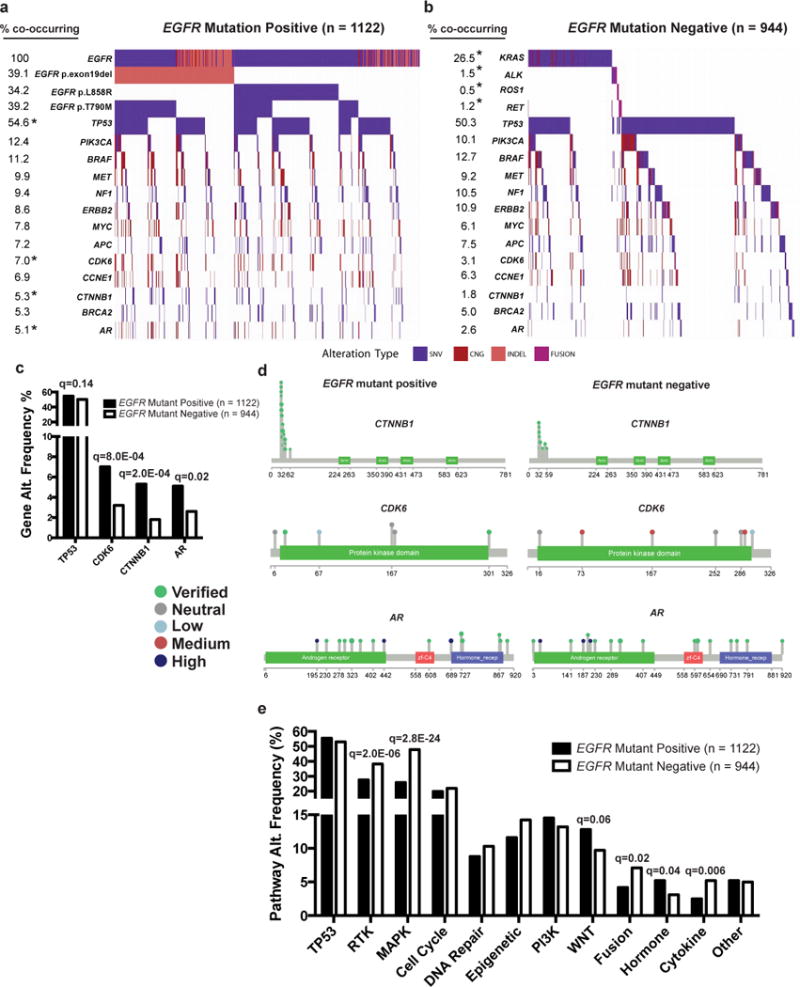
(a) Frequency of genomic alterations: non-synonymous somatic variants of predicted functional significance (SNV, see Methods), copy number gains (CNG), insertions or deletions (INDEL), or gene rearrangements (FUSION) in the cancer-related genes listed (Supplementary Table 2), detected by next-generation sequencing of circulating tumor DNA from 1122 advanced-stage EGFR-mutant positive NSCLC patients (a) compared to a cohort of 944 EGFR-mutant negative NSCLC patients (b) (Supplementary Datasets 1 and 2). Co-occurring alterations that occurred in at least 5% of EGFR-mutant positive cases are shown. * Indicates statistically significant differences between the cohorts (q < 0.2). (c) Gene alterations with increased frequency in EGFR-mutant positive compared to EGFR-mutant negative patients (Two-tailed Fisher’s exact test performed to identify statistically significant differences in TP53, CDK6, CTNNB1, and AR, using Benjamini-Hochbeg correction for multiple hypothesis testing (q-values). (d) Lolliplots of gene level alterations in EGFR-mutant positive compared to EGFR-mutant negative samples. The functional significance of somatic variants is indicated based on analysis described in Methods. (e) Differences in pathway level alterations between EGFR-mutant positive and EGFR-mutant negative cases (two-tailed Fisher’s Exact test comparing EGFR-mutant positive to EGFR mutant-negative with Benjamini-Hochbeg correction for multiple hypothesis testing (q-values). See also Supplementary Tables 1–3 and Supplementary Datasets 1 and 2.
The EGFR p.Thr790Met mutation arises in over 50% of cases of acquired resistance to first-generation EGFR TKIs (erlotinib, gefitinib)11, but is rarely detected (~0.5%) before EGFR TKI treatment12. In the cohort of 1122 EGFR-mutant NSCLC samples, 440 had a detectable alteration in EGFR encoding the p.Thr790Met mutation. Based on the rare detection of EGFR p.Thr790Met in EGFR TKI-naïve patients (0.5%)12, it is likely the vast majority of these EGFR p.Thr790Met -positive patients were treated previously with a first (or second)-generation EGFR TKI. Similar to the presumed mutual exclusivity of oncogenic driver mutations in treatment-naïve NSCLC, EGFR TKI treatment resistance is considered largely a consequence of a single gene alteration, such as that encoding the EGFR p.Thr790Met.mutation, which is thought to be sufficient to drive acquired resistance to first-generation EGFR TKIs in an individual patient11. Using our large clinical cohort (n=440 EGFR p.Thr790Met positive cases), we tested whether specific genetic co-alterations tended to co-occur with EGFR p.Thr790Met, which would suggest a functional role for such co-altered genes in driving EGFR TKI resistance in cooperation with EGFR p.Thr790Met. We found an increase in the mean number of detectable genetic alterations in EGFR p.Thr790Met -positive (2.41 ± 1.89 S.E.M.) compared to EGFR p.Thr790Met -negative (2.01 ± 1.77 S.E.M) patients (P = 4.5E−04, two-tailed Fisher’s exact test, Supplementary Table 4). More frequent alterations in cell cycle (CDK6, 43/440 vs. 36/682, q = 0.08) and CCNE1 (39/440 vs. 39/682, q = 0.28) CNGs), WNT pathway (CTNNB1 oncogenic mutations, 33/440 vs. 27/682, q = 0.12), hormone signaling (androgen receptor, AR, somatic mutations 30/440 vs. 27/682, q = 0.22), and epigenetic (MYC CNG, 47/440 vs. 41/682, q = 0.08) genes and in KRAS (21/440 vs. 17/682, q = 0.24) and PDGFRA (21/440 vs. 11/682, q = 0.06) (CNG and oncogenic mutations) and BRCA1 (31/440 vs. 24/682, q = 0.10), were present in the EGFR p.Thr790Met -positive cases (n = 440) compared with the EGFR p.Thr790Met -negative cases (n = 682) (q-values determined by two-tailed Fisher’s exact test Benjamini-Hocheberg correction for multiple hypotheses, Fig. 2a–e, Supplementary Fig. 1a–c and Supplementary Table 4). Corresponding differences in cell cycle (106/440 vs. 117/682, q = 0.07), DNA repair (48/440 vs. 51/682, q = 0.16), epigenetic (62/440 vs. 68/682, q = 0.16), WNT (68/440 vs. 76/682, q = 0.16), and hormone (30/440 vs. 29/682, q = 0.18) pathway level changes were also observed (q-values determined by two-tailed Fisher’s exact test Benjamini-Hocheberg correction for multiple hypotheses, Fig. 2f). The finding of co-occurring oncogenic mutations in KRAS and EGFR is consistent with preclinical data13,14. In a subgroup analysis of EGFR p.Cys797Ser mutation-positive cases (n=15), which can arise upon acquired resistance to osimertinib (the approved third-generation EGFR TKI with activity against EGFR p.Thr790Met15), there were recurrent activating alterations in MAPK pathway (including KRAS CNG and oncogenic mutations) and cell cycle genes (CDK4, CDK6), and AR CNGs (Supplementary Fig. 1c). These data reveal extensive co-occurring alterations in advanced-stage EGFR-mutant NSCLCs, even those with EGFR TKI-resistant forms of mutant EGFR (i.e. p.Thr790Met, p.Cys797Ser).
Figure 2. Co-occurring genomic alterations detected in cell-free DNA of 440 advanced-stage EGFR-mutant, p.Thr790Met positive compared to 682 advanced-stage EGFR-mutant, p.Thr790Met negative NSCLC patients.
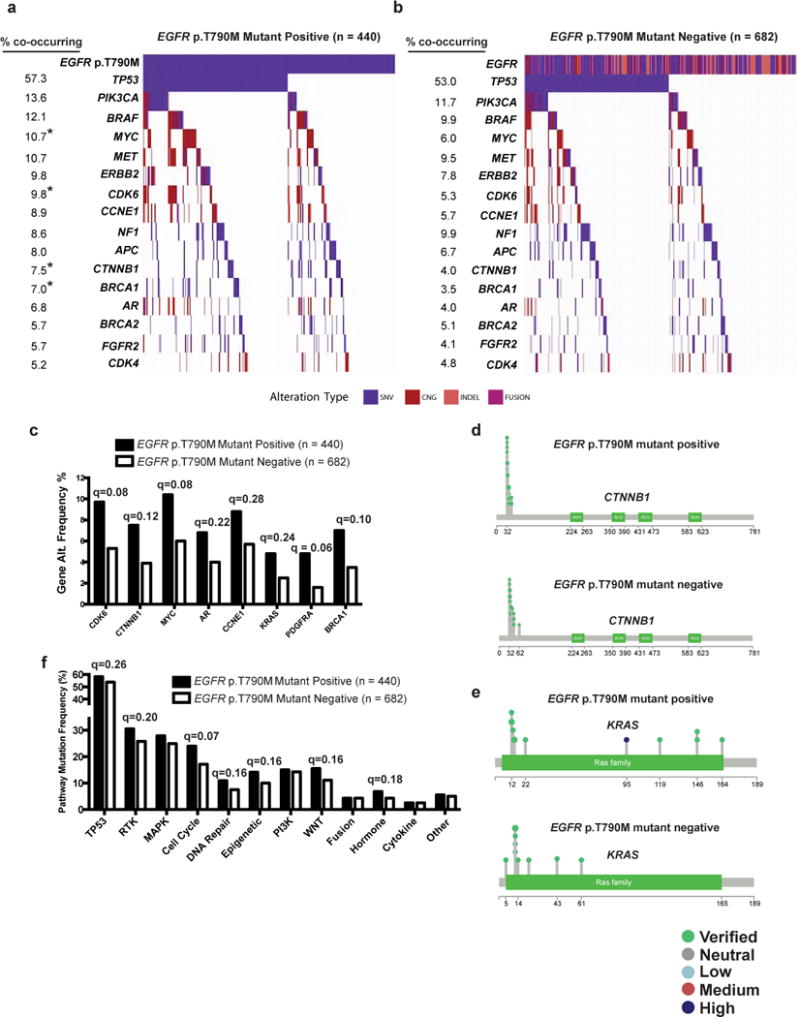
(a–b) Frequency of non-synonymous genomic alterations of known or predicted functional significance: somatic variants (SNV), copy number gain (CNG), insertions or deletions (INDEL), or gene rearrangements (FUSION) in cancer-related genes detectable by next-generation sequencing (in at least 5% of p.Thr790Met positive cases) of circulating tumor DNA are indicated in (a) EGFR-mutant, p.Thr790Met (denoted as T790M) positive (n=440) and (b) EGFR-mutant, p.Thr790Met negative (n=682) cohorts. Q-values determined by two-tailed by Fisher’s Exact test with Benjamini-Hochberg correction for multiple hypothesis testing * Indicates statistically significant differences between the cohorts (q < 0.2). (c) Frequency (percentage) of gene level alterations detectable in the cell-free DNA of EGFR-mutant, p.Thr790Met positive compared EGFR-mutant, p.Thr790Met negative patients (q-values determined by two-tailed by Fisher’s Exact test with Benjamini-Hochberg correction for multiple hypothesis testing). (d–e) Lolliplots of gene level alterations in EGFR-mutant,p.Thr790Met positive compared to EGFR-mutant, p.Thr790Met negative samples. Somatic alterations in CTNNB1 (d) and KRAS (e) are indicated. The functional significance of somatic variants is indicated based on analysis described in Methods. (f) Differences in pathway level alterations between EGFR-mutant p.Thr790Met positive and EGFR-mutant p.Thr790Met negative cases determined by two-tailed Fisher’s Exact test with Benjamini-Hochberg correction for multiple hypothesis testing (q-value). See also Supplementary Figure 1, Supplementary Table 4 and Supplementary Dataset 1.
cfDNA linked to clinical outcomes in EGFR-mutant lung cancers
We next examined the landscape of somatic genetic alterations present in a cohort of advanced-stage EGFR-mutant NSCLC patients in which longitudinal cfDNA analysis and clinical context and treatment response data were available (n=137 samples from 97 patients, Fig. 3a, Supplementary Table 5). Somatic mutations were filtered to remove synonymous mutations and mutations of unknown significance (Methods). We analyzed samples obtained from patients who were TKI-naïve (n=21), progressed on first-line TKI treatment (n=53) and progressed on 2nd line therapy (n=26). The number of detectable somatic alterations increased with each line of therapy, irrespective of age, gender, or tobacco exposure (pre-TKI: mean (95% CI) 3.4 (2.2–4.5), PD 1st line: 3.8 (3.2–4.4), PD 2nd line: 5.2 (4.1–6.2), R2 = 0.064, Slope 0.92, P = 0.01, F = 4.2, DF = 97, One-way ANOVA; (Fig. 3b, Supplementary Fig. 2a–c). Enrichment for the EGFR p.Thr790Met encoding mutation occurred at progression on first-line EGFR TKI (31/53 vs. 0/21, q = 3.6E−5), as expected based on the rare detection (~0.5%) of EGFRT790M before first-generation EGFR TKI treatment12 and established incidence of EGFRT790M (55%–65%) at acquired resistance to first-generation EGFR TKIs11 (q-values determined by two-tailed Fisher’s exact test Benjamini-Hocheberg correction for multiple hypotheses, Fig. 3a,c, Supplementary Dataset 3). Upon progression on second-line treatment (EGFR TKI or chemotherapy), there were trends towards selection for co-alterations in CCNE1 (5/26 vs. 3/53, q = 0.5), NF1 (6/26 vs. 3/53, q = 0.4), and PIK3CA (7/26 vs. 6/53, q = 0.5) (q-values determined by two-tailed Fisher’s exact test Benjamini-Hocheberg correction for multiple hypotheses Fig. 3a, 3c, Supplementary Dataset 3). Alterations in genes involved in TP53 (pre-TKI vs. PD 2nd line; 6/21 vs. 17/26, q = 0.20), RTK (PD 1st line vs. PD 2nd line; 10/53 vs. 11/26, q = 0.17), MAPK (PD 1st line vs. PD 2nd line; 10/53 vs. 11/26, q = 0.17), Cell Cycle (PD 1st line vs. PD 2nd line; 10/53 vs. 9/26, q = 0.27), Epigenetic (PD 1st line vs. PD 2nd line; 4/53 vs. 6/26, q = 0.20) and PI3K pathways (pre-TKI vs. PD 2nd line; 1/21 vs. 7/26, q = 0.20) were more frequently detected in patients with progression on second-line therapy (q-values determined by two-tailed Fisher’s exact test Benjamini-Hocheberg correction for multiple hypotheses, Fig. 3d, Supplementary Dataset 3).
Figure 3. Therapy-induced evolution of genomic co-alterations detected in cell-free DNA of advanced-stage EGFR-mutant NSCLC patients.
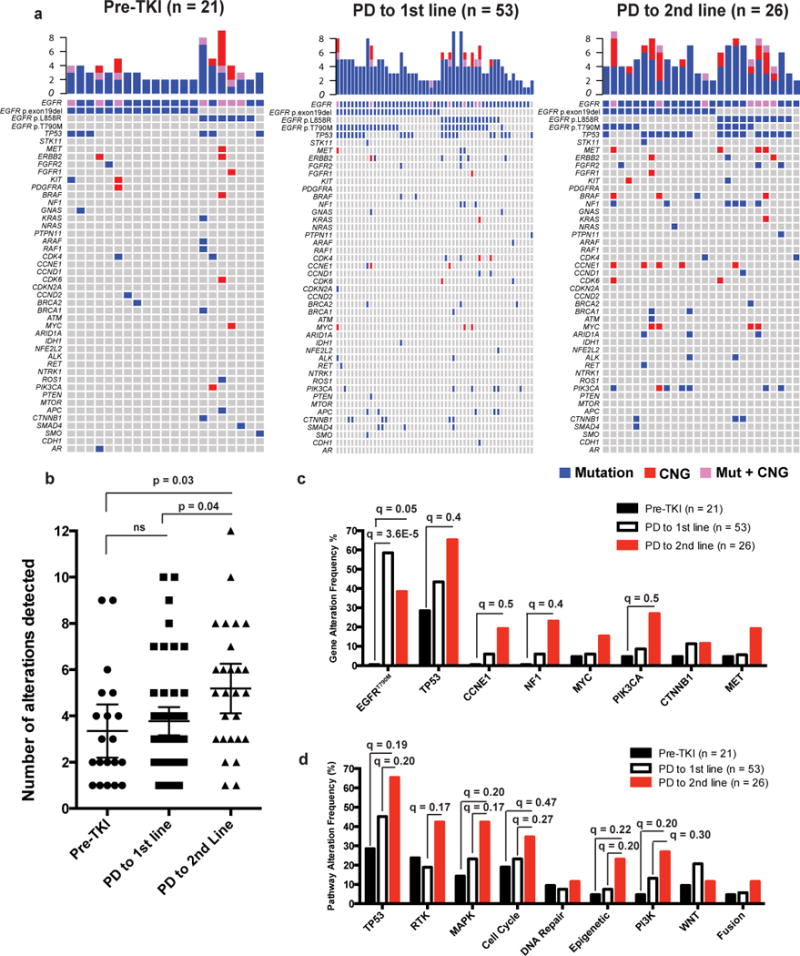
cfDNA analysis of 137 samples collected from 97 patients with known clinical history (see also Supplementary Table 5 and Supplementary Dataset 3). (a) Samples were segregated by EGFR TKI treatment; pre-TKI (n=21), at the time of progression to first-line EGFR TKI therapy; PD to 1st line (n=53), or at the time of progression to 2nd line anti-cancer therapy (2nd or 3rd generation EGFR TKI, or chemotherapy); PD to 2nd line (n=26). (b) Number of functional alterations detectable based on line of therapy are indicated (mean ± 95% CI). Pre-TKI (3.4, 95% CI: 2.2–4.5), PD to 1st line (3.8, 95% CI: 3.2–4.4), PD to 2nd line (5.2, 95% CI: 4.1–6.3). Pre-TKI vs. PD to 1st line P = 0.8, Pre-TKI vs. PD to 2nd line P = 0.03, PD to 1st line vs. PD to 2nd line P = 0.04, F = 4.3, DF = 97, ANOVA with Tukey correction for multiple comparisons. (c) Changes in gene alteration frequency (percentage) with line of therapy (d) Changes in cancer-related pathway alterations (percentage) with line of therapy. (c and d) Two-way Fisher’s exact test was performed to identify statistically significant differences between pre-TKI and PD to 1st line, between PD to 1st line and PD to 2nd line, and between pre-TKI and PD to 2nd line with Benjamini-Hochberg correction for multiple hypothesis testing (q-values). See also Supplementary Figures 2–5, Supplementary Tables 5, and Supplementary Dataset 3.
We investigated detectable differences in cfDNA between EGFR TKI responders vs. non-responders in 73 samples from 64 patients for whom response to subsequent EGFR TKI treatment was known (Supplementary Table 6). The mean number of functional alterations detected in cfDNA was lower in patients who responded (n=37, mean 2.7, 95% CI: 2.3–3.1) to a subsequent EGFR TKI (of any generation) compared to those who did not respond (n=36, mean 5.2, 95% CI: 4.3–6.0) (P = 0.0002, t = 5.4, F = 3.6, df = 71, 95% CI of difference in means 1.6–3.4, unpaired, two-tailed t test, Supplementary Fig. 2d, and Supplementary Dataset 4). Patients harboring gene level MET (0/37 responders vs. 5/36 non-responders, q = 0.23, 95% CI [ 0 ~ 1.15] and OR undefined), NF1 (0/37 responders vs. 6/36 non-responders, q = 0.23, 95% CI [ 0 ~ 0.90 ] and OR undefined), CDK4 (0/37 responders vs. 5/36 non-responders, q = 0.23, 95% CI [ 0 ~ 1.15 ] and OR undefined), PIK3CA (1/37 responders vs. 8/36 non-responders, q = 0.23, 95% CI [ 0.0026 ~ 1.005 ] and OR= 0.124), or APC (0/37 responders vs. 5/36 non-responders, (q = 0.23, 95% CI [ 0 ~ 1.15 ] OR undefined) alterations were least likely to respond to a subsequent EGFR TKI (q-values determined by two-tailed Fisher’s exact test Benjamini-Hocheberg correction for multiple hypotheses, Supplementary Fig. 3a–b). Patients whose cfDNA harbored CDK4 or CDK6 gene alterations (n=7) also exhibited decreased progression-free survival (PFS) (HR: 13.8, 95% CI [5.1 ~ 36.8], P = 1.4E−11, Cox proportional hazard regression test, Supplementary Fig. S3c–d) in response to EGFR TKI treatment compared to patients without detectable CDK4/6 alterations (n=66). Pathway level alterations in cell cycle genes (1/37 responders vs. 12/36 non-responders, q = 0.006 (95%CI: 95% CI [ 0.0018 ~ 0.613 ] and OR = 0.083)), MAPK (3/37 responders vs. 12/36 non-responders, q = 0.03 (95% CI [ 0.04 ~ 1.02 ]:and OR = 0.247), PI3K (1/37 responders vs. 9/36 non-responders, q = 0.03 (95% CI [ 0.0024 ~ 0.867 ]: and OR= 0.11), and WNT (3/37 responders vs. 8/36 non-responders, q = 0.19 (95% CI [ 0.058 ~ 0.695] and OR = 0.369) also correlated with lack of response to EGFR TKI treatment (q-values determined by two-tailed Fisher’s exact test Benjamini-Hocheberg correction for multiple hypotheses, Supplementary Fig. 3e). Cell cycle (n=12 positive, n=61 negative, HR 2.8, 95% CI [1.4 ~ 5.9], P = 0.004, Cox proportional hazard regression test) and MAPK pathway alterations (n=15 positive, n = 58 negative, HR 1.9, 95% CI [1.0 ~ 3.7], P = 0.04, Cox proportional hazard regression test) (Supplementary Fig. 3f–h) were biomarkers of decreased PFS during subsequent EGFR TKI treatment. Patients with CDK4/6 alterations (n=7) exhibited decreased overall survival (OS) compared to patients without (n=66) (HR: 5.4, 95% CI [1.7 ~ 18.0], P = 0.002, Cox proportional hazard regression test, Supplementary Fig. 4). These data suggest selection for increased genetic diversity during iterative tumor progression on therapy and identify biomarkers of poor response to EGFR TKI treatment (i.e. cell cycle and MAPK pathway gene alterations). We observed further evidence for this in a cohort of several individual clinical cases of EGFR-mutant NSCLC in which intra-patient longitudinal cfDNA profiling was performed (Supplementary Fig. 5).
cfDNA analysis linked to differential osimertinib response
While mechanisms of acquired resistance to the third-generation EGFR TKI osimertinib have been well-described14–17, mechanisms of primary resistance have not been well characterized. We identified 41 patients who underwent cfDNA analysis prior to treatment with osimertinib for whom clinical response, PFS, and OS to subsequent osimertinib treatment were known (Supplementary Table 6 and Supplementary Dataset 4). Alterations in MET (3/21), NF1 (5/21), CDK4 (3/21), CCNE (3/21), CDK6 (2/21), PIK3CA (6/21) and APC (5/21) were only found in patients with primary resistance to osimertinib treatment (Fig. 4a–b, Supplementary Dataset 4). Patients with cfDNA alterations in CDK4 or CDK6 (n=5) exhibited decreased PFS to osimertinib compared to patients without (n=36) detectable CDK4/6 alterations (Median PFS 0.7 months (95% CI: 0.7-NR) vs. 11.2 months (95% CI: 6.2-NR), HR: 10.3, 95% CI [3.0 ~ 34.7], P = 3.7E−06, Cox proportional hazard regression test, Fig. 4c–d), although no statistically significant difference in OS was observed (Supplementary Fig. 4c). Pathway level alterations in cell cycle genes (0/20 responders vs. 8/21 non-responders, q = 0.03 (95%CI [ 0 ~ 0.47 ]: and OR undetermined), MAPK (1/20 responders vs. 7/21 non-responders, q = 0.15 (95% CI [ 0.0025 ~ 1.146 ]and OR=0.126), PI3K (0/20 responders vs. 7/21 non-responders, q = 0.04 (95% CI [0 ~ 0.667 ]: and OR undetermined), and WNT (2/21 responders vs. 7/21 non-responders, q = 0.33 (95% CI [ 0.023 ~ 1.65 ] and OR = 0.26) were associated with lack of response to osimertinib treatment (q-values determined by two-tailed Fisher’s exact test Benjamini-Hocheberg correction for multiple hypotheses, Fig. 4e). Decreased PFS to subsequent osimertinib treatment was also associated with cell cycle gene alterations (n=33 alt. negative, median PFS 11.2, 95% CI: 8.8-NR vs. n=8 alt. positive, median 1.5 months, 95% CI: 0.7-NR, HR 5.4, 95% CI [2.0 ~ 14.5], P = 0.0002, Cox proportional hazard regression test, Fig. 4f–g), with a trend towards a difference in OS (OS 17.1 vs. 4.3 months, HR 1.7, 95% CI [0.6 ~ 5.2], P = 0.4, Cox proportional hazard regression test, Supplementary Fig. 4d). These data highlight potential roles for MAPK, PI3K, and WNT pathway alterations in driving primary resistance to osimertinib and uncover cell cycle gene aberrations (specifically in CDK4/6) as a clinical biomarker of osimertinib non-response (i.e. primary resistance) in advanced-stage EGFR p.Thr790Met -positive NSCLC. Thus, co-occurring genetic alterations may function as co-drivers of tumor progression and drug resistance and create genetic diversity that is advantageous for cancer evolution.
Figure 4. Effect of cfDNA detectable co-occurring genetic alterations on osimertinib clinical response in advanced-stage EGFR-mutant lung cancer patients.
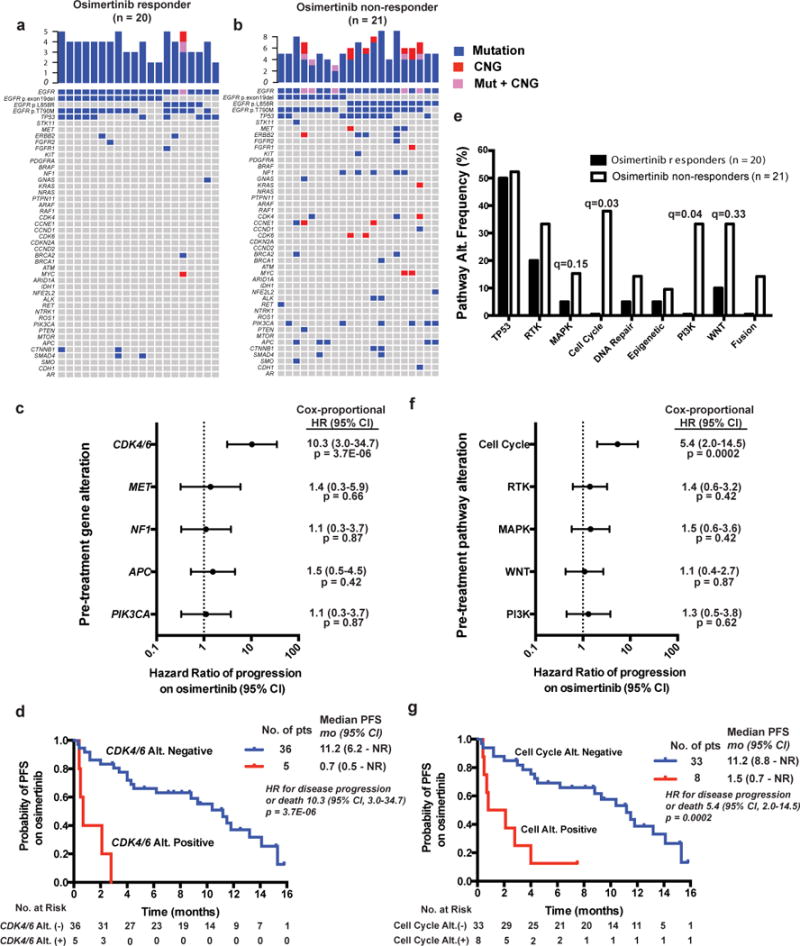
(a–b) Genomic alterations detectable in cfDNA from advanced EGFR-mutant NSCLC patients who were subsequently treated with osimertinib and exhibited a radiographic/clinical response (a) (PR by clinician assessment, see methods) versus patients who did not respond (b) (by clinician assessment, see methods). (c) Forrest plot demonstrating effect of cfDNA detectable gene level alterations on PFS with P-values determined by Cox-proportional Hazard Ratio (HR) with 95% CI. (d) Kaplan-Meier curves demonstrating difference in median PFS (logrank test) in patients with cfDNA detectable alterations in CDK4 or CDK6. (e) Pathway level alterations in osimertinib responders vs. non-responders. Q-values determined by two-tailed Fisher’s Exact test with Benjamini-Hochberg correction for multiple hypothesis testing. (f–g) Forrest plot and Kaplan-Meier curves assessing the effects of indicated cfDNA detectable pathway alterations on PFS with P-values determined by Cox-proportional Hazard Ratio (HR) with 95% CI. See also Supplementary Figures 4 and 5, Supplementary Table 6 and Supplementary Dataset 4.
Longitudinal spatial-temporal genomic profiling
We next leveraged the uncommon opportunity to analyze a NSCLC clinical case by both tumor-based whole-exome sequencing (WES) and cfDNA profiling over six years of disease progression: from the initial diagnosis of surgically-resectable disease, through metastatic progression first in mediastinal lymph nodes, then in lungs, bone, and brain over time, during which the patient was treated with erlotinib followed by the third-generation EGFR TKI rociletinib18 (Supplementary Fig. 6). Seven tumor specimens (4 lung, 2 bone, 1 lymph node), including four obtained at autopsy upon lethal tumor progression on rociletinib, and six plasma specimens were analyzed longitudinally.
The WES analysis showed that over 75% of the coding mutational burden was truncal (i.e. ubiquitous and clonal) at diagnosis but this decreased to 50–58% at the time of full cancer evolution (patient death) via the emergence of subclonal mutations through tumor progression and first- and second-line EGFR TKI treatment and resistance (Fig. 5a). The genetic-co-alterations present in this patient by longitudinal tumor-based exome sequencing are consistent with our cfDNA analysis of the broader cohort of advanced-stage EGFR-mutant NSCLC (Fig. 1–4), with evidence of cell cycle, WNT, and PI3K pathway alterations. Multiple functionally-relevant somatic co-alterations were present in early-stage disease (R1), including clonal and truncal EGFR variant p.Glu746_Thr751delinsLeu (c.2233_2252delinsAATT:chr7:g.55242463_55242482delinsAATT (hg19); NM_005228), CTNNB1 variant p.Ser37Phe (c.110C>T, chr3:g.41266113C>T (hg19);NM_001904)19, SMAD4 variant p.Leu146*, (c.437T>G, chr18:g.48575677T>G (hg19);NM_005359) and RBM10 variant p.Ser10* (c.269C>A, chrX:g.47032594C>A (hg19);NM_005676) as well as CDK2NA copy number loss (Fig. 5a–b, Supplementary Fig. 7 and Supplementary Datasets 5 and 6). Acquisition of PRKCA variant p.Asn468Ile (c.1403_1404AC>TA, chr17:g.64738757-64738758AC>TA (hg19);NM_002737)20 and PIK3CA variant p.Gly106Val (c.317G>T, chr3:g.178916930G>T (hg19);NM_006218)21, and CNG in the genomic region encoding EGFR, CDK6, MET, and BRAF all occurred upon mediastinal lymph node metastasis (R2) (Fig. 5a–c, Supplementary Fig. 7 and Supplementary Datasets 5 and 6). Progression on initial EGFR TKI (erlotinib) occurred with acquisition of the EGFR variant Thr790Met (c.2369C>T, chr7:g.55249071C>T (hg19);NM_005228), found in ~60% of EGFR-mutant NSCLC patients who progress on first-generation EGFR TKI11, and the persistence of additional co-alterations including CTNNB1 variant p.Ser37Phe and PIK3CA variant p.Gly106Val. Our data suggest the PIK3CA variant p.Gly106Val arose before both EGFR TKI treatment and EGFR variant p.Thr790Met (Fig. 5a and Supplementary Fig. 8). The data suggest that the EGFR variant p.Thr790Met arose twice in this case in a previously unreported instance of independent dual clones, as it was found in metastatic sites that harbored PIK3CA variant p.Gly106Val (R3-left lung at erlotinib progression, R4-left lung at rociletinib progression, R6-right lung at rociletinib progression) and those that did not (R5-right rib metastasis, R7-spine metastasis), although despite relatively deep sequencing coverage (250–600 fold across the tumor samples) we cannot completely rule-out that a rare subclonal common progenitor cell harboring EGFR variant Thr790Met existed in the primary tumor (Fig. 5a–c, Supplementary Fig. 8). Additional subclonal genetic co-alterations, including PIK3CA variant p.His1047Arg (c.3140A>G, chr3:g.178952085A>G (hg19);NM_006218) (R5-right rib), RB1 variant p.Arg857His (c.2570G>A, chr13:g.49050886G>A (hg19);NM_000321) (R4-left lung), CHD4 variant p.His1151Pro (c.3452A>C, chr12:g.6697477T>G (hg19);NM_001273) (R6-right lung) and TLR4 variant p.Arg289Gln (c.866G>A, chr9 g.120475272G>A (hg19);NM_138554) (R5-right rib) arose with tumor progression on rociletinib (Fig. 5a–c). The activating PIK3CA variant p.Gly106Val21 was not found in all of the post-rociletinib metastatic sites (present in R4, R6; absent in R5, R7), demonstrating lesion-specific heterogeneity (Fig. 5a–b). A subclonal PIK3CA oncogenic variant p.His1047Arg22 was found in R5 (right rib, post-rociletinib), suggesting another instance of parallel evolution in this cancer: two different PIK3CA oncogenes (Fig. 5a–c, Supplementary Fig. 8). Although an RB1 variant p.Arg857His was detected in R4 (left lung- at rociletinib progression) and RB1 inactivation is associated with transition from lung adenocarcinoma to small cell carcinoma upon acquired EGFR TKI resistance23,24, there was no evidence of transition to small cell histology in this case perhaps due to absence of a somatic TP53 alteration (Supplementary Fig. 6).
Figure 5. Longitudinal genomic analysis of tumor and cell-free DNA in a patient with EGFR-mutant lung cancer from diagnosis to death.
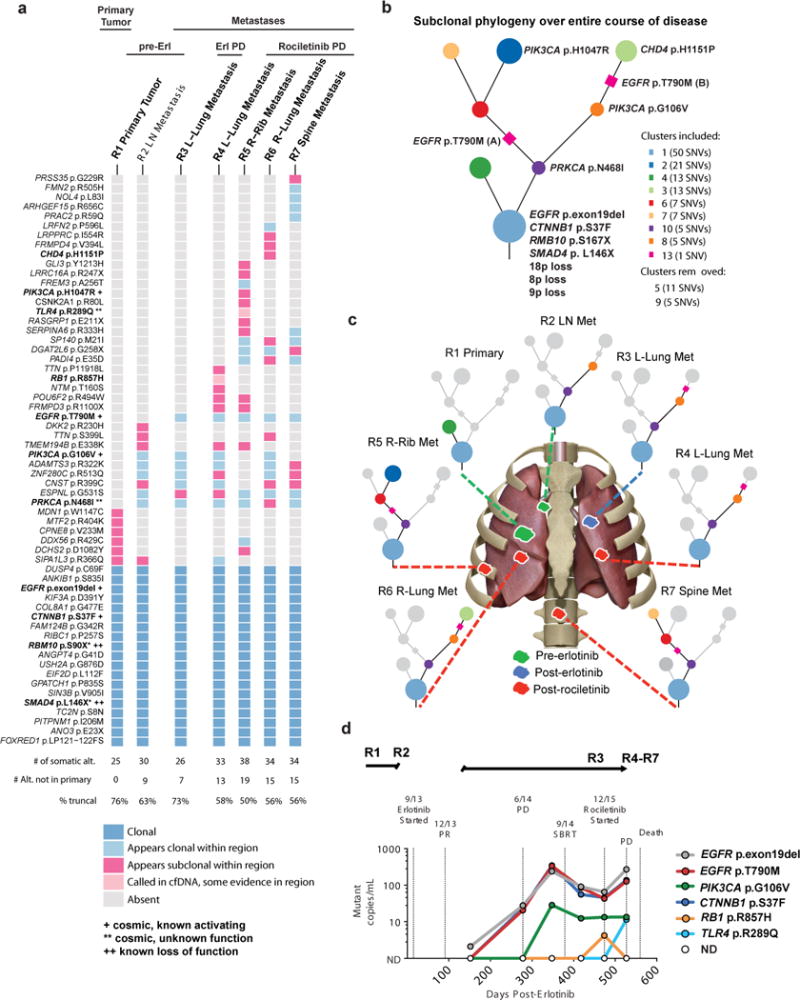
(a) Heatmap depicting the clonal status of non-synonymous somatic mutations including SNVs, dinucleotides and indels from each sequenced region of the patient’s disease as determined by subclonal copy number corrected cancer cell fraction and PyClone cross sample clustering. Somatic alterations were detected by whole-exome sequencing of the tumor DNA of the patient at initial presentation and surgical resection of EGFR-mutant lung cancer (R1), at the time of development of metastatic disease (R2), upon progression to first line treatment with erlotinib (R3), and at autopsy after treatment with the 2nd line EGFR TKI rociletinib followed by PD and death (R4-R7). (see Methods for description of analysis). (b) Phylogenetic tree illustrating the evolutionary history of the patient’s disease at the level of subclonal clusters of mutations. These subclonal clusters are inferred, using PyClone, from the samples taken from the primary and different metastases at multiple time-points. The mutations were clustered based on their prevalence (subclonal copy number corrected cancer cell fraction) in the sequenced cancer cell populations across all samples, this clustering is then used to infer the founding clone (at the bottom of the tree) and subclonal clusters. (c) Pictorial representation of primary tumor and metastatic sites analyzed by whole exome sequencing. (d) cfDNA detectable in plasma from patient at indicated time points as determined by CAPP-Seq analysis5. See also Supplementary Figs. 6–8, and Supplementary Datasets 5 and 6.
While plasma samples for cfDNA analysis were unavailable for the initial clinical events (i.e. before erlotinib treatment), coupling serially-acquired cfDNA data (Methods) with tumor biopsy-based WES revealed examples of ubiquitous (e.g. EGFR variant p.exon19del, CTNNB1 variant p.Ser37Phe) and lesion-restricted (PIK3CA variant p.Gly106Val, RB1 variant p.Arg857His, TLR4 variant p.Arg289Gln) mutations in the plasma (Fig. 5d). Thus, cfDNA analysis integrates multiple metastatic tumor lesions.
Functional significance of co-occurring genomic alteration
Similar to our larger cohort of EGFR-mutant NSCLC patients (Fig. 1–4), this case highlights the co-occurrence of genetic alterations within the WNT (CTNNB1 variant p.Ser37Phe), PI3K (PIK3CA variant p.Gly106Val), and cell cycle pathways (CDK6 CNG, and CDKN2A loss). We hypothesized such co-occurring alterations might function non-redundantly to drive tumor metastasis or limit targeted therapy response (See Supplementary note and Fig. 6).
Figure 6. Functional analysis of CTNNB1 and PIK3CA co-mutations detected in EGFR-mutant lung adenocarcinoma.
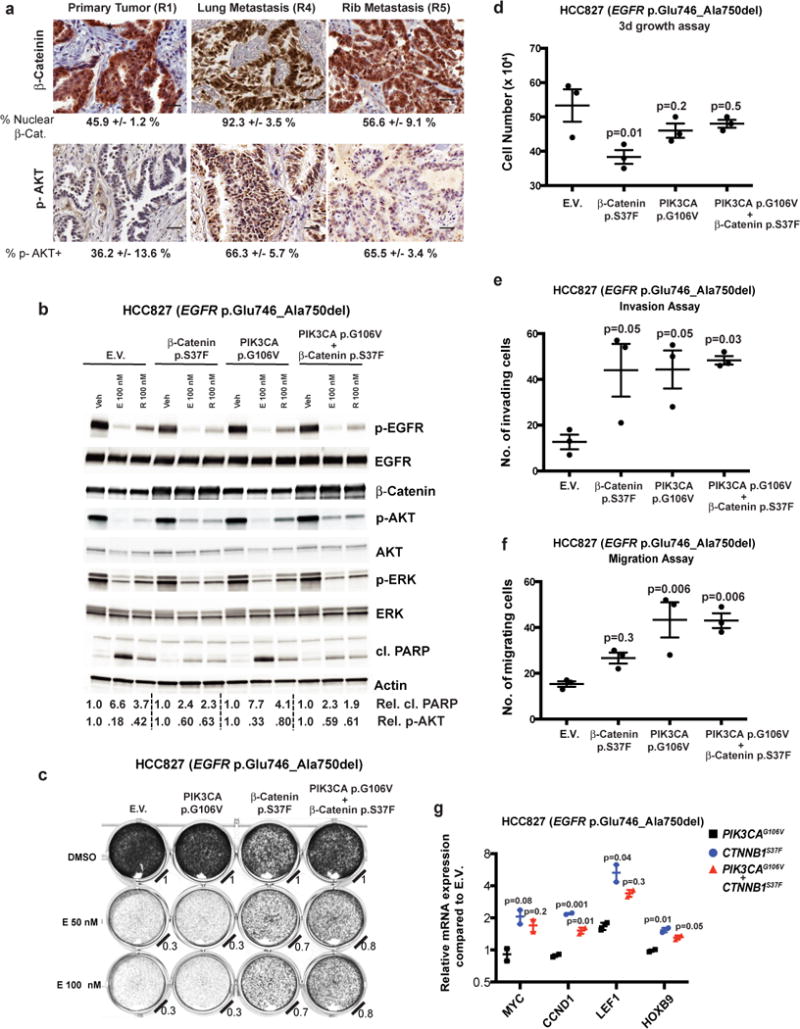
(a) IHC staining for nuclear β-Catenin or serine-473-phosphorylated AKT (Mean ± S.E.M. images representative of 3 images per panel, scale bar = 50 microns). (b) Immunoblot analysis of HCC827 cells infected with empty vector (E.V.) or constructs that overexpress β-Catenin p.Ser37Phe, PIK3CA p.Gly106Val, or both proteins. Cells were treated with 100 nM erlotinib (E) or rociletinib (R) or vehicle control (veh), and immunoblot analysis performed on cellular extracts. Relative proportions of cleaved-PARP to total PARP and p-AKT to total AKT are indicated. Images are representative of immunoblots from 3 independent cell culture experiments (c) Cellular viability assay (Methods) of HCC827 NSCLC cells engineered to overexpress β-Catenin p.Ser37Phe and/or PIK3CA p.Gly106Val. Relative cell viability compared to DMSO-treated control is indicated. Images are representative of 3 independent cell culture experiments. Cellular growth (d), invasion (e) and migration (f) assays (Methods) comparing HCC827 cells engineered to express the indicated proteins (mean ± S.E.M. from 3 independent cell culture experiments, P-Values determined by ANOVA with Bonferroni’s correction). (d) F = 4.844, DF = 8. (e), F = 5.095, DF = 8. (f), F = 9.633, DF = 8. (g) Quantitative-PCR (Q-PCR) of β-Catenin target genes (mean ± S.E.M from 2 independent experiments). P-Values compared to PIK3CA p.Gly106Val control, ANOVA with Bonferroni’s correction (MYC: F= 6.5, DF = 3; CCND1: F = 107, DF = 3; LEF1: F = 9.5, DF = 3; HOXB9: F = 23.3, DF = 3).
Clonal analysis of genetic alterations detected in cfDNA
Our data (Fig. 5) suggest that subclonal co-occurring oncogenic driver events can influence tumor progression and response to EGFR TKI treatment. To assess whether subclonal events are common in advanced-stage EGFR-mutant lung cancers more broadly, we assessed whether co-occurring genetic alterations detected in the cfDNA of 1122 advanced-stage EGFR-mutant NSCLC patients were clonal or subclonal (see Supplementary note and Supplementary Fig. 10). Our method inferred the founder canonical EGFR mutations (encoding p.Leu858Arg and p.Glu746_Ala750del) as mostly clonal in the 1122 patient advanced-stage EGFR-mutant NSCLC cohort, as expected (respectively: ~86.5%, 332/384; ~89.7%, 350/390, P = 0.19, Fisher’s exact test. 95% CI of difference in two population proportion: −1.3% ~ 7.7%, OR = 0.96). We further found advanced-stage EGFR mutation-positive NSCLCs are more likely to harbor subclonal genetic alterations than advanced-stage EGFR mutation-negative NSCLCs (Fig. 7a, Supplementary Datasets 1 and 2, 36.6% (1156/3157) subclonal alterations in EGFR-mutation positive vs. 24.9% (572/2291) subclonal events in EGFR-mutation negative cases, (P = 2.2E−16, Fisher’s exact test [95% CI of difference in two population proportion: 9.2%~ 14.1%], OR=1.47). Subclonal alterations were also more commonly found in the EGFR variant p.Thr790Met-positive samples (Fig. 7b, Supplementary Dataset 1, 39.7% (604/1519) in EGFR variant p.Thr790Met-positive vs. 33.3% (586/1760) in EGFR variant p.Thr790Met-negative cases, P = 0.02, Fisher’s exact test [95% CI of difference in two population proportion: 3.1% ~ 9.7%], OR 1.19). Relative to the clonal founder EGFR mutation, EGFR variant p.Thr790Met was more frequently subclonal (~71.1% clonal; 313/440, compared to founder EGFR mutations p.Leu858Arg and p.Glu746_Ala750del ~ 95% clonal (as above), P = 2.2E−16, Fisher’s exact test, OR=1.83), a finding of clinical relevance given that subclonal EGFR variant p.Thr790Met may be linked to inferior clinical response to third-generation EGFR TKI treatment25. The subclonal frequency of other common variants is also described (see Supplementary note).
Figure 7. Clonality analysis of co-occurring genetic alterations detectable in the cfDNA of advanced-stage NSCLC patients.
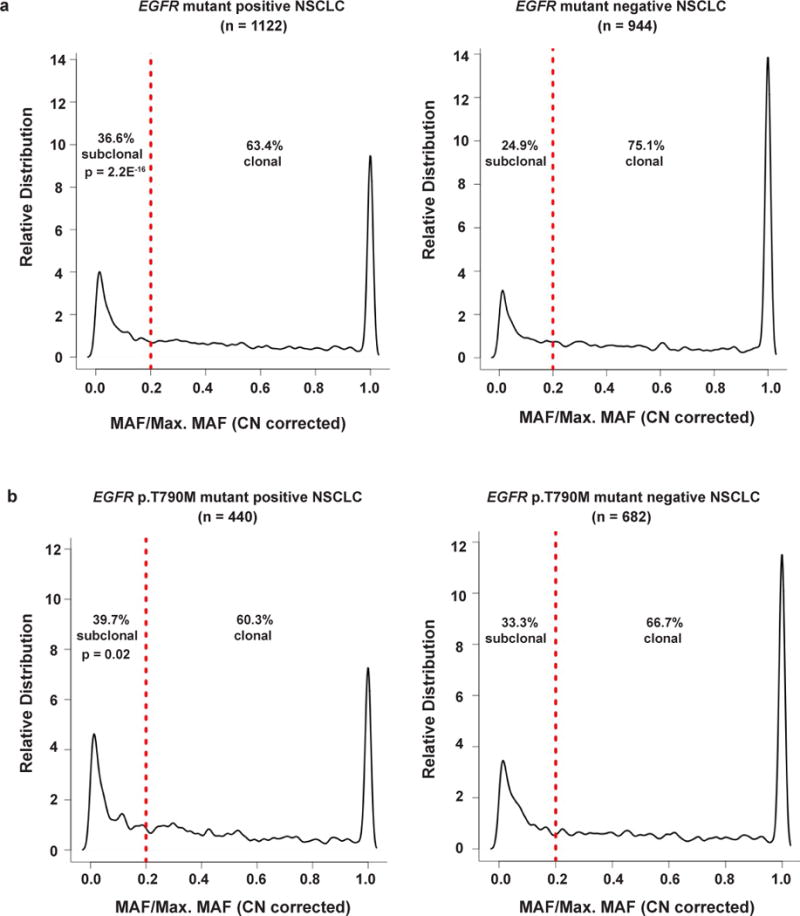
The distribution of clonal and subclonal alterations were determined in (a) EGFR-mutant positive (n=1122) vs. EGFR-mutant negative (n=944) NSCLC, and (b) EGFR-mutant p.Thr790Met (T790M) positive (n=440) vs. EGFR-mutant p.Thr790Met (T790M) mutant negative (n=682) NSCLC. Red line indicates division between clonal (≥ 0.2 MAF/Maximum MAF) and subclonal (< 0.2 MAF/Maximum MAF) as defined in the text and Supplementary Fig. 10. P-values determined by two-tailed Fisher’s Exact test. See also Supplementary Fig. 10 and Supplementary Datasets 1 and 2.
Discussion
This study sheds new light on the genetic basis of oncogenesis and cancer progression by revealing that multiple co-occurring oncogenic events are present in the vast majority of advanced-stage EGFR-mutant lung cancers. These new data challenge the current view of the genetic basis of EGFR-mutant lung cancer as a single-oncogene disease wherein oncogenic, mutant EGFR is mutually exclusive from any other oncogene (Fig. 8). Our findings highlight the importance of deploying more informed and genomically-empowered molecular diagnosis, monitoring, and dynamically-applied rational polytherapy strategies to address the clonal and subclonal co-alterations that drive disease progression and drug resistance in order to better control this deadly cancer. Our data are reminiscent of recent findings in myeloproliferative neoplasms26 and prompt re-examination of the presence and clinical impact of co-occurring genetic alterations in other cancer types using large datasets such as the one here to enable a powered analysis.
Figure 8. Evolution of the understanding of the genetic pathogenesis of oncogene-positive (here, EGFR-mutant) lung cancer.
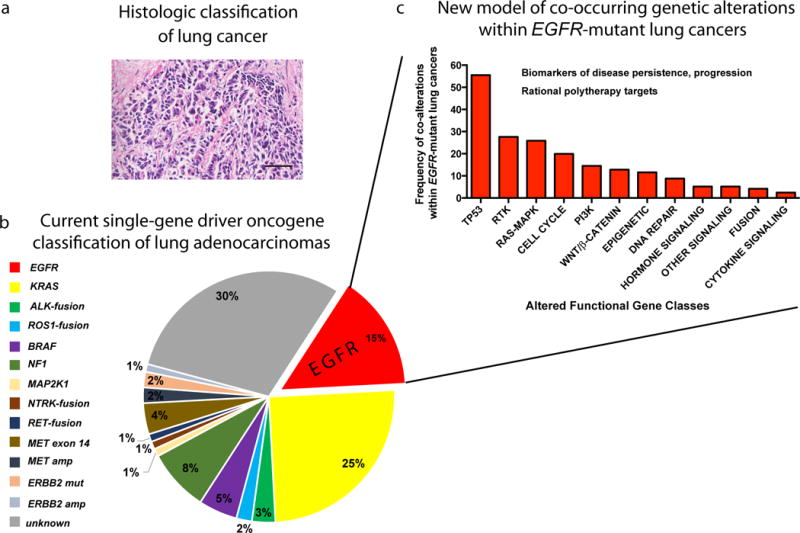
(a) Traditional view of lung cancer based on histopathological analysis. Lung adenocarcinoma, scale bar = 50 microns. (b) Current molecular classification of NSCLC based on single-gene driver oncogene status, depicting the current view of mutually-exclusive driver oncogenes, as shown in the pie chart with frequency of each driver alteration in lung adenocarcinoma. (c) The proposed new model of EGFR-mutant NSCLC pathogenesis arising from our findings: a re-classification of advanced-stage EGFR-mutant NSCLC based on the co-occurring genetic alterations that our dataset revealed (shown here at the pathway level). We propose that advanced-stage EGFR-mutant NSCLCs contain co-occurring genetic alterations that function collaboratively as co-drivers of tumor progression and drug resistance. We now need to identify and co-target these co-occurring functional genetic alterations beyond mutant EGFR itself in patients, early and dynamically during treatment, in order to improve patient survival. The finding of extensive co-occurring alterations within advanced-stage EGFR-mutant NSCLC at scale now paves the way for studying the biological and clinical impacts of genetic interactions that are created by the co-alterations present in these EGFR-mutant NSCLCs.
We identify new pathways that promote EGFR-mutant lung cancer progression and limit EGFR TKI response. Examples include WNT/β-catenin and cell cycle gene alterations (Fig. 4–6; see Supplementary note). Overall, the widespread presence, evolution, and clinical impact of co-occurring genetic alterations within advanced-stage EGFR-mutant lung cancers uncovered here re-shapes the current view of oncogene-positive lung cancer and offers future directions for both basic and clinical research that hold promise for improving current treatments for this aggressive cancer.
Online Methods
Patients
IRB-approval for the study # 16-19636 was granted by the UCSF IRB on May 13, 2016. Per the UCSF IRB the study does not involve human subjects as defined by the federal regulations summarized in 45 CFR 46.102(f), and hence does not require further IRB oversight, and requirement for informed consent was waived. For EGFR-mutation positive and EGFR-mutation negative cohorts selection for inclusion were met if patients had a known diagnosis of stage III or Stage IV NSCLC. For EGFR-mutation positive, 1122 consecutive samples from 1006 patients from March 2015 to April 2016 in whom a non-synonymous mutation in EGFR of known or predicted functional significance (see below) was identified on the Guardant 360 clinical assay were included for analysis. EGFR copy number gain by itself was included in the EGFR-mutation negative cohort. The EGFR-mutant negative cohort consisted of all other advanced staged NSCLC patients from the time period of January 2016-April 2016 (1008 samples from 999 patients). Chart review of EGFR-mutant Guardant cases from patients at UCSF, UCSD, UC Davis, and University of Colorado was carried out by the study investigators to identify patient demographic information and to determine when the Guardant 360 assay was sent in relation to the patients’ treatment course. Objective response, PFS, and OS to EGFR TKI therapy were determined by retrospective chart review for clinical assessment and direct radiographic review by study investigators when possible. Composite clinical evaluation that integrated clinical and radiographic information was used to identify responders from non-responders. (Responder = radiographic and/or clinical improvement by investigator assessment, Non-responders = radiographic SD or PD (by RECIST 1.1 criteria, or clinical decline, or death prior to imaging). The time-to-event outcomes, including progression free survival and overall survival were estimated using Kaplan-Meier method.
Cell-Free DNA Analysis
Samples were shipped to a Clinical Laboratory Improvement Act (CLIA)-certified, College of American Pathologists-accredited laboratory (Guardant Health, Redwood City, California). Cell-free DNA (cfDNA) was extracted from whole blood collected in 10mL Streck tubes. After double centrifugation, 5ng – 30ng of cfDNA was isolated for digital sequencing as previously described9,27. For EGFR-mutant positive NSCLCs, samples were run on 68-gene panel or 70-gene panel, but only the 68 genes in common were included in this analysis (Supplementary Table 2). Sequencing data was analyzed using the Guardant Health clinical analysis bioinformatics pipeline to identify single nucleotide variants (SNVs) in 68 genes (150kb panel footprint), CNGs in 16, indels in EGFR and fusions in ALK, RET, ROS1, NTRK1, FGFR2, and FGFR39,27. All cell-free DNA fragments, both leukocyte- and tumor-derived, were simultaneously sequenced. The variant allele fraction (VAF) was calculated as the proportion of cfDNA harboring the variant in a background of wild-type cell-free DNA. Reporting thresholds for SNVs, indels, and fusions were 1–2 molecules and 0.01%–0.04% allelic fraction with 0.2%–0.3% 95% limits of detection and >99.9999% per-position analytical specificity9,27. To identify CNGs a large training set, probe-level unique molecule coverage was normalized for signal saturation, individual probe efficiency, GC content, and overall unique molecule throughput and robustly summarized to generate a quantitative gene-level unique molecule representation. Relative quantitation was determined by comparison of this representation to the inferred diploid baseline on a per-gene level. Reporting thresholds were based on training set-established decision thresholds for both absolute copy number deviation from per-sample diploid baseline and deviation from the baseline variation of probe-level normalized signal in the context of background variation within each sample’s own diploid baseline. Reporting threshold for CNGs was 2.12 copies with a 2.24–2.76 gene-specific 95% limits of detection and 100% analytical specificity. For clonality analysis, first, the mutational allele frequency (MAF) was normalized by copy numbers of the same genes with CNGs and the largest MAF within each was selected as the normalized Max-MAF; second, the ratio of the MAF of each mutational allele over Maximum-percentage detection (Max-pct) within a case was computed, and the probability distribution was plotted using kernel density estimation. To determine the cut-off of percentage of normalized MAF as clonal or subclonal of each mutation, we implemented aforementioned algorithms to the case with both tumor tissue exome sequencing and cfDNA sequencing encoding EGFR p.exon19del, EGFR p.Thr790Met PIK3CA p.Gly106Val, CTNNB1 p.Ser37Phe, RB1 p.Arg857His and TLR4 p.Arg289Gln reported in this study (Fig. 5 and Supplementary Fig. 10). The value of 0.2 was defined as a robust cutoff for subclonal or clonal mutations resulting in 100% sensitivity and 100% specificity, as all somatic variants identified through this method as subclonal or clonal in cfDNA were also correctly identified as subclonal or clonal in patient tumor samples (Supplementary Fig. 10). For longitudinal case (Fig. 5d), cell-free DNA was isolated from 1 ml of frozen plasma and analyzed as described5,28. Clinical data was collected by review of medical records under an IRB-approved protocol (UCSF). Non-synonymous mutations from EGFR-mutant positive and negative datasets were further processed using R statistical computing program (version 3.3). Unknown significant variants were filtered out by using COSMIC (V79), GENIE (see URLs) and prediction algorithm see URLs).
Whole-exome sequencing and analysis
Informed consent was obtained from the patient and patient’s family for study of biological materials and clinical records obtained from the patient. DNA was extracted from FFPE for primary tumor and frozen tumor tissue samples and matched non-tumor tissue using the Qiagen Allprep DNA/RNA Mini Kit. The library preparation protocol was based on the Agilent SureSelect Library Prep and Capture System (Agilent Technologies, Santa Clara, CA). Quantitation and quality were assessed using the Qubit Flourometer (Thermo Fisher). DNA concentration was determined to be greater than 2.5 ng/ul and the overall quantity > 500ng. By Nanodrop, the 260/280 ratio was greater than 1.7. DNA was resuspended in a low TE buffer and sheared (Duty Cycle 5%; Intensity 175; Cycles/Burst: 200; Time: 300s, Corvaris S2 Utrasonicator). Bar-coded exome libraries were prepared using the Agilent Sure Select V5 library kit per manfucaturer’s specifications. The libraries were run on the HiSeq2500.
Alignment
Raw paired end reads (100bp) in FastQ format generated by the Illumina pipeline were aligned to the full hg19 genomic assembly obtained from USCS, gencode 14, using bwa version 0.7.12. Picard tools version 1.117 was used to sort, remove duplicate reads and generate QC statistics. Tumor DNA was sequenced to median depth of 303X (range 114.39–383.41) and the matched germline DNA to average depth of 231.65.
Exome analysis
SNV, INDEL and Dinucleotide substitution calling, identification and classification of driver mutations, somatic copy number aberration calling, subclonal deconstruction and phylogenetic tree construction were performed as described29.
Classification of SCNAs
SCNA events were defined as segments called by ASCAT >= 400kb in size that met set thresholds. Segments with a combined raw nMinor and nMajor greater than a 1.5 times the ASCAT derived ploidy for their specific tumor region were considered SCNA gains. SCNA losses had an integer nMinor value of 0 and a combined raw nMinor and nMajor of less than 1.25 times ploidy for their specific tumor region.
Incorporation of p.Thr790Met mutation into phylogenetic reconstruction
In order to create an accurate subclonal phylogeny it is necessary to remove mutation clusters that violate two evolutionary principles. Firstly, the pigeonhole principle which ensures that two mutation clusters cannot be considered to be on separate branches of an evolutionary tree and thus be independent if the cancer cell fraction values of the two clusters together exceeds 100% within region of a tumor. Secondly, a descendent clone must have a smaller cancer cell fraction than its ancestor within each and every tumor region, referred to as the ‘crossing rule’. Using these principles, it can be determined whether particular mutation clusters conflict with each other and cannot be fitted to the same evolutionary tree.
The subclonal phylogeny illustrating the entire course of the patient’s disease was derived following these two principles and the methods of multi-sample subclonal deconstruction and tree construction in29. However, the SNV encoding EGFR p.Thr790Met did not cluster with any other SNVs following these methods due to its unique CCF profile across R3, R4, R5, R6 and R7. No other SNV appears clonal in all these regions as well as being absent from both R1 and R2. As cluster 7 and the EGFR p.Thr790Met encoding mutation appear clonal in R3, R4, and R6 but cluster 7 is absent from R5 and R7 and the EGFR p.Thr790Met encoding mutation is present they cannot, by the crossing rule, be present in the same population of cells. In addition, as cluster 7 was present clonally in R2 before Erlotinib treatment while the EGFR p.Thr790Met encoding mutation is absent from R2, it follows that cluster 7 is likely to have arisen before the EGFR p.Thr790Met encoding SNV.
The most parsimonious solution to this violation of the crossing rule, assuming that the cancer cell fractions are correct, is that there are two independent origins of the EGFR p.Thr790Met encoding SNV. p.Thr790Met encoding SNV (A) would occur in a cell already containing the SNVs from cluster 7, and go on to become clonal post-Erlotinib treatment in R3, R4 and R6. p.Thr790Met encoding SNV (B) would occur in a population of cells lacking the SNVs present in cluster 7 and go on to become clonal in R5 and R7 post-Erlotinib. These possible origins of the EGFR p.Thr790Met encoding SNV are indicated on the subclonal phylogeny that can be seen in Supplementary Figure 8 by the placement of a magenta square on the relevant branches.
Cell Lines and Reagents
The HCC827 (EGFR p.Glu746_Ala750del) and HEK293-FT cell lines were obtained, authenticated, and cultured as recommended by the American Type Culture Collection (ATCC). These cell lines confirmed to be negative for mycoplasma. HCC827 cells were cultured in RPMI 1640 media (Hyclone, GE Healthcare) supplemented with 10% FBS (SAFC, Sigma-Aldrich), 1X penicillin and streptomycin (UCSF, Cell Culture Facility). HEK293-FT cells were cultured in DMEM media (Hyclone, GE Healthcare), supplemented with 10% FBS, 0.1X penicillin and streptomycin. All cell lines were grown at 37 °C, in a humidified atmosphere with 5% CO2. Erlotinib and rociletinib were purchased from Selleckchem.
Mammalian expression vectors pQCXIB empty (w335-1) was a gift from Eric Campeau (Addgene plasmid # 17487)30; pBABE-puro was a gift from Hartmut Land & Jay Morgenstern & Bob Weinberg (Addgene plasmid # 1764)31; pCMV-VSV-G (Addgene plasmid # 8454) and pUMVC (Addgene plasmid # 8449)32 were a gift from Bob Weinberg; pBabe puro HA PIK3CA was a gift from Jean Zhao (Addgene plasmid # 12522)33; human Beta-Catenin pcDNA3 was a gift from Eric Fearon (Addgene plasmid # 16828)34. The PIK3CA and β-Catenin constructs were engineered to express PIK3CA p.Gly106Val and β-Catenin p.Ser37Phe following QuickChange II XL Site-Directed Mutagenesis Kit protocol (Agilent Technologies). The p.Ser37Phe encoding CTNNB1 fragment was then sub-cloned in a pQCXIB retroviral construct for stable overexpression, using sticky ends ligation with ApaI and BamHI-HF (New England BioLabs) restriction enzymes, per manufacturer’s instructions. HEK293-FT cells were transfected with pBABE (empty vector), pBABE-PIK3CA encoding p.Gly106Val, pQCXIB (empty vector) and pQCXIB-CTNNB1 encoding p.Ser37Phe using Fugene 6 (Promega) per manufacturer’s instructions. Virus containing media was harvested at 24 hrs and 48 hrs post-transfection. HCC827 cells were infected with virus containing media, supplemented with 8 μg/ml of polybrene (Sigma-Aldrich), for 24 hours. The culture medium was changed to standard growth media for an over-night incubation, after which cells were incubated in antibiotic selecting medium containing puromycin 1 ug/mL (Gibco) for p-Babe construct or blasticidin 2.5 ug/mL (Gibco) for pQCXIB constructs. Antibiotic resistant cells were used in the subsequent tests.
Cell Viability and Growth Assays
One hundred thousand of HCC827 cells, engineered with the β-Catenin p.Ser37Phe and PIK3CA p.Gly106Val expression constructs, and under puromycin (1 ug/mL) and blasticidin (2.5 ug/mL) selection, were seeded in 12 well plates and, after 24 hrs, treated with DMSO (control), erlotinib (50–100 nM) and rociletinib (100 nM), in 2% FBS, for three days. Cells were then air-dried for 5 minutes, fixed for 5 miutes in ParaFormAldehyde (PFA, 4% vol/vol; Santa Cruz Biothechnology) and stained in 0.05% crystal violet (g/mL; Sigma-Aldrich) solution for 30 minutes. Each well was washed twice with tap water and air-dried. Plates were scanned using ImageQuant LAS4000 (GE Healthcare Life Sciences). Each image is representative of a triplicate experiment. Cell viability was assessed using the above culture conditions, seeding two hundred of cells each well. Cell count was registered after three days of growth and assessed using Vi-CELL XR. Each test was run in triplicate.
Invasion and Migration Assays
Transwell migration and invasion assays were performed as described in Okimoto et al.35 Briefly, 8-μm-pore Matrigel coated (invasion) or non-coated (migration) Transwell inserts (BD Biosciences) were added at the top of a Transwell chamber filled with 10% FBS, RPMI media. To each insert, 2.4 × 10⁴ cells in serum-free media were added. The Transwell chambers were incubated for 20 hrs at 37 °C in the incubator. Cells that did not migrate through the pore or invade the matrigel were scraped off; the membranes were fixed in methanol for 15 min and then stained with crystal violet for 30 min. The surface of the membrane was imaged in 5 distinct fields, with a Zeiss Axioplan II immunofluorescent microscope at 10×. Invasion and migration were assessed counting the average imaged cells in the 5 regions. Results presented are from three independent experiments.
Immunoblotting and q-RT-PCR
The HCC827 cells engineered with the β-Catenin p.Ser37Phe and PIK3CA p.Gly106Val expression constructs were drug treated, in serum free condition, with DMSO (control), erlotinib (100 nM) and rociletinib (100 nM) for 24 hrs. Protein lysates were collected in RIPA buffer supplemented with protease (Roche) and phosphatase (Roche) inhibitors. Western blot was performed loading 10 μg of lysed proteins. Pre-casted 4–15% gels (Bio-Rad) were used for the mono-dimension protein separation. Proteins were transferred on nitrocellulose membranes using Trans-blot Turbo Transfer system (Bio-Rad). Blots were then blocked in Tris-buffered saline, 0.1% Tween20 (vol/vol) and 5% BSA (Fischer Scientific, vol/vol) for 1 hr, at room temperature. The primary antibodies were incubated over-night, at 4ºC. The primary antibodies used were: pY1068-EGFR D7A5 (#3777), total EGFR D38B1 (#4267), β-Catenin D10A8 (#8480), pS473-AKT D9E (#4060), total AKT (#9272), pT202/Y204-ERK1/2 (#9101), total ERK1/2 (#9102) and cleaved PARP (#9541) from Cell Signaling Technology; Actin AC-74 (#A2228) from Sigma-Aldrich. The membranes were washed twice in washing buffer (Tris-buffered saline, 0.1% Tween20, vol/vol) and then incubated with secondary HRP conjugated antibodies for 1 hr, at room temperature. ECL kit (GE Healthcare) was used as chemoluminescent substrate. Blots were developed and scanned using ImageQuant LAS4000 (GE Healthcare Life Sciences). ImageJ (NIH) was used to quantify the western blots. All western blots represent the result of three independent experiments.
The RNA was purified from the HCC827 cells engineered with the β-Catenin p.Ser37Phe and PIK3CA p.Gly106Val expression constructs using RNeasy Micro Kit (Qiagen). One microgram of total RNA was used for the reverse-transcriptase reaction with SensiFAST cDNA Synthesis Kit (BIOLINE). The q-PCR was performed with six replicates each condition and using a 1:3 dilution of the template cDNA. Human MYC, CCND1, LEF1, HOXB9, and endogenous control GAPDH genes were amplified with Taqman gene expression assay (Applied Biosystems). Gene expression analysis was computed using QuantStudio 12K Flex Software (Applied Biosystems). Data were analyzed using the 2−ΔΔCt method and expressed as relative mRNA expression.
Immunohistochemistry
Immunohistochemistry was performed as described36. Briefly, 5-micron thick formalin-fixed paraffin embedded (FFPE) human tissue sections were stained with the β-Catenin D10A8 (#8480 Cell Signaling, 1:100 dilution), or pSer473-Akt D9E (#4060, Cell Signaling, 1:100 dilution) antibody per manufacturer’s instructions. Stained slides were digitized using the Aperio ScanScope CS Slide Scanner (Aperio Technologies) with a 20× objective. The proportion of cells exhibiting nuclear β-Catenin staining was determined using the ScanScope default nuclear algorithm. pSer473-Akt quantitation was determined using the ScanScope default membrane algorithm. Three fields of view per section were used to determine the mean and standard error of the mean of positively staining cells.
Statistics
To determine differences in cfDNA alterations between cohorts two-tailed Fischer’s Exact test with Benjamini-Hochberg method to correct for multiple hypothesis testing and generate q-values.was (Figs. 1c,e, 2c,f, 3c,d, 4e, Supplementary Figs. 3 and 9). We considered the false discovery rate to be controlled under 20% (q<=0.2).37 For supplementary tables 3 and 4, two-tail t-test was used for two population mean difference with 95% confidence interval. The effect size, Cohen’s d was determined by the equation: (Mean1-Mean2)/SDpooled, where SDpooled= (SD1+SD2)/2; proportions test was used for two population proportion comparison with 95% confidence interval, no correction was used. In some conditions, 95% confidence interval for the single population proportion was used. The odds ratio (OR) was calculated for the measure of effect size between two population with proportion comparison. For PFS (Fig. 4 and Supplementary Fig. 3) and OS (Supplementary Fig. 4) assessments, the 95% CI for median duration of progression free survival and overall survival were computed using robust nonparametric Brookmeyer and Crowley method. Hazard ratio with 95% CI and P-values were calculated with Cox proportional hazards regression model with survival package in R. For Q-PCR, cell growth, invasion, and migration analysis (Fig. 6) one-way ANOVA and with Bonferroni correction were used to determine P-values (GraphPad Prism).
Data Availability
The data supporting the findings of the study are available within the paper and its supplementary information files and have been deposited publically in the European Genome-phenome Archive (EGA), accession number: EGAS00001002604.
Code availability
Most bioinformatics tools used in the analysis of this dataset are publicly available; any that are not are available on request.
Supplementary Material
Acknowledgments
The authors acknowledge funding support from NIH: NCI-R01CA169338, NIH Director’s New Innovator Award NCI-DP2CA174497, the Pew Charitable Trust, Stewart Foundation, and Searle Foundation (to T.G.B), and to AACR and Lung Cancer Research Foundation (C.M.B.). The authors thank J. Blakely for artwork and A. Sabnis, R. Okimoto, A. Tulpule, and M. Hutchinson for critical review and input on the manuscript.
Footnotes
Author Contributions: C.M.B., T.B.K.W, C.S. and T.G.B designed the study. C.M.B. performed medical record review, analyzed data and prepared tables and figures. T.B.K.W. performed whole-exome sequencing and clonality analysis and prepared tables and figures with assistance from N.M., G.A.W, and N.J.B. W.W. performed analysis of cell-free DNA sequencing data on patient cohorts and prepared tables and figures. B.G. performed cell line experiments and prepared figures with assistance from A.M. J.J.C. and M.D. performed CAPP-Seq analysis. V.O. and J.R. performed IHC analysis. C.E.M, M.A.G, V.W., A.D.S., P.C.M, D.R.G, H.H, R.C.B, J.W.R., performed medical record review and provided clinical data. K.C.B. and R.B.L. compiled and annotated cfDNA data from 1150 EGFR-mutant positive and 1008 EGFR mutant negative NSCLC patients. A.R.C. extracted DNA and prepared exome libraries from patient tumor samples. A.F.C. and J.S.J. performed exome sequencing alignment and quality analysis. P.G. harvested autopsy tissue and performed pathological assessments. C.M.B. and T.G.B. wrote the manuscript with contributions from all authors.
Competing Financial Interests: K.C.B. and R.B.L. are employees of Guardant Health Inc., A.F.C., J.S.J., A.R.C. and P.G. are employees of Driver Inc. A.D.S. is an employee of Clovis Oncology Inc.
References
- 1.de Bruin EC, et al. Spatial and temporal diversity in genomic instability processes defines lung cancer evolution. Science. 2014;346:251–6. doi: 10.1126/science.1253462. [DOI] [PMC free article] [PubMed] [Google Scholar]
- 2.Zhang J, et al. Intratumor heterogeneity in localized lung adenocarcinomas delineated by multiregion sequencing. Science. 2014;346:256–9. doi: 10.1126/science.1256930. [DOI] [PMC free article] [PubMed] [Google Scholar]
- 3.Turke AB, et al. Preexistence and clonal selection of MET amplification in EGFR mutant NSCLC. Cancer Cell. 2010;17:77–88. doi: 10.1016/j.ccr.2009.11.022. [DOI] [PMC free article] [PubMed] [Google Scholar]
- 4.Zhang Z, et al. Activation of the AXL kinase causes resistance to EGFR-targeted therapy in lung cancer. Nat Genet. 2012;44:852–60. doi: 10.1038/ng.2330. [DOI] [PMC free article] [PubMed] [Google Scholar]
- 5.Chabon JJ, et al. Circulating tumour DNA profiling reveals heterogeneity of EGFR inhibitor resistance mechanisms in lung cancer patients. Nat Commun. 2016;7:11815. doi: 10.1038/ncomms11815. [DOI] [PMC free article] [PubMed] [Google Scholar]
- 6.VanderLaan PA, et al. Mutations in TP53, PIK3CA, PTEN and other genes in EGFR mutated lung cancers: Correlation with clinical outcomes. Lung Cancer. 2017;106:17–21. doi: 10.1016/j.lungcan.2017.01.011. [DOI] [PMC free article] [PubMed] [Google Scholar]
- 7.Canale M, et al. Impact of TP53 Mutations on Outcome in EGFR-Mutated Patients Treated with First-Line Tyrosine Kinase Inhibitors. Clin Cancer Res. 2017;23:2195–2202. doi: 10.1158/1078-0432.CCR-16-0966. [DOI] [PubMed] [Google Scholar]
- 8.Comprehensive molecular profiling of lung adenocarcinoma. Nature. 2014;511:543–50. doi: 10.1038/nature13385. [DOI] [PMC free article] [PubMed] [Google Scholar]
- 9.Lanman RB, et al. Analytical and Clinical Validation of a Digital Sequencing Panel for Quantitative, Highly Accurate Evaluation of Cell-Free Circulating Tumor DNA. PLoS One. 2015;10:e0140712. doi: 10.1371/journal.pone.0140712. [DOI] [PMC free article] [PubMed] [Google Scholar]
- 10.Thompson JC, et al. Detection of Therapeutically Targetable Driver and Resistance Mutations in Lung Cancer Patients by Next-Generation Sequencing of Cell-Free Circulating Tumor DNA. Clin Cancer Res. 2016;22:5772–5782. doi: 10.1158/1078-0432.CCR-16-1231. [DOI] [PMC free article] [PubMed] [Google Scholar]
- 11.Yu H, et al. Analysis of Mechanisms of Acquired Resistance to EGFR TKI therapy in 155 patients with EGFR-mutant Lung Cancers. Clin Cancer Res. 2013;19:2240–2247. doi: 10.1158/1078-0432.CCR-12-2246. [DOI] [PMC free article] [PubMed] [Google Scholar]
- 12.Yu HA, et al. Poor response to erlotinib in patients with tumors containing baseline EGFR T790M mutations found by routine clinical molecular testing. Ann Oncol. 2014;25:423–8. doi: 10.1093/annonc/mdt573. [DOI] [PMC free article] [PubMed] [Google Scholar]
- 13.Politi K, Fan PD, Shen R, Zakowski M, Varmus H. Erlotinib resistance in mouse models of epidermal growth factor receptor-induced lung adenocarcinoma. Dis Model Mech. 2010;3:111–9. doi: 10.1242/dmm.003681. [DOI] [PMC free article] [PubMed] [Google Scholar]
- 14.Eberlein CA, et al. Acquired Resistance to the Mutant-Selective EGFR Inhibitor AZD9291 Is Associated with Increased Dependence on RAS Signaling in Preclinical Models. Cancer Res. 2015;75:2489–500. doi: 10.1158/0008-5472.CAN-14-3167. [DOI] [PMC free article] [PubMed] [Google Scholar]
- 15.Thress KS, et al. Acquired EGFR C797S mutation mediates resistance to AZD9291 in non-small cell lung cancer harboring EGFR T790M. Nat Med. 2015;21:560–2. doi: 10.1038/nm.3854. [DOI] [PMC free article] [PubMed] [Google Scholar]
- 16.Ou SH, Agarwal N, Ali SM. High MET amplification level as a resistance mechanism to osimertinib (AZD9291) in a patient that symptomatically responded to crizotinib treatment post-osimertinib progression. Lung Cancer. 2016;98:59–61. doi: 10.1016/j.lungcan.2016.05.015. [DOI] [PubMed] [Google Scholar]
- 17.Ho CC, et al. Acquired BRAF V600E Mutation as Resistant Mechanism after Treatment with Osimertinib. J Thorac Oncol. 2016 doi: 10.1016/j.jtho.2016.11.2231. [DOI] [PubMed] [Google Scholar]
- 18.Sequist LV, et al. Rociletinib in EGFR-mutated non-small-cell lung cancer. N Engl J Med. 2015;372:1700–9. doi: 10.1056/NEJMoa1413654. [DOI] [PubMed] [Google Scholar]
- 19.Gamallo C, et al. beta-catenin expression pattern in stage I and II ovarian carcinomas : relationship with beta-catenin gene mutations, clinicopathological features, and clinical outcome. Am J Pathol. 1999;155:527–36. doi: 10.1016/s0002-9440(10)65148-6. [DOI] [PMC free article] [PubMed] [Google Scholar]
- 20.Wang XY, Repasky E, Liu HT. Antisense inhibition of protein kinase Calpha reverses the transformed phenotype in human lung carcinoma cells. Exp Cell Res. 1999;250:253–63. doi: 10.1006/excr.1999.4529. [DOI] [PubMed] [Google Scholar]
- 21.Burke JE, Perisic O, Masson GR, Vadas O, Williams RL. Oncogenic mutations mimic and enhance dynamic events in the natural activation of phosphoinositide 3-kinase p110alpha (PIK3CA) Proc Natl Acad Sci U S A. 2012;109:15259–64. doi: 10.1073/pnas.1205508109. [DOI] [PMC free article] [PubMed] [Google Scholar]
- 22.Trejo CL, et al. Mutationally activated PIK3CA(H1047R) cooperates with BRAF(V600E) to promote lung cancer progression. Cancer Res. 2013;73:6448–61. doi: 10.1158/0008-5472.CAN-13-0681. [DOI] [PMC free article] [PubMed] [Google Scholar]
- 23.Dorantes-Heredia R, Ruiz-Morales JM, Cano-Garcia F. Histopathological transformation to small-cell lung carcinoma in non-small cell lung carcinoma tumors. Transl Lung Cancer Res. 2016;5:401–12. doi: 10.21037/tlcr.2016.07.10. [DOI] [PMC free article] [PubMed] [Google Scholar]
- 24.Sequist LV, et al. Genotypic and histological evolution of lung cancers acquiring resistance to EGFR inhibitors. Sci Transl Med. 2011;3:75ra26. doi: 10.1126/scitranslmed.3002003. [DOI] [PMC free article] [PubMed] [Google Scholar]
- 25.Piotrowska Z, et al. Heterogeneity Underlies the Emergence of EGFRT790 Wild-Type Clones Following Treatment of T790M-Positive Cancers with a Third-Generation EGFR Inhibitor. Cancer Discov. 2015;5:713–22. doi: 10.1158/2159-8290.CD-15-0399. [DOI] [PMC free article] [PubMed] [Google Scholar]
- 26.Ortmann CA, et al. Effect of mutation order on myeloproliferative neoplasms. N Engl J Med. 2015;372:601–12. doi: 10.1056/NEJMoa1412098. [DOI] [PMC free article] [PubMed] [Google Scholar]
- 27.Villaflor V, et al. Biopsy-free circulating tumor DNA assay identifies actionable mutations in lung cancer. Oncotarget. 2016;7:66880–66891. doi: 10.18632/oncotarget.11801. [DOI] [PMC free article] [PubMed] [Google Scholar]
- 28.Newman AM, et al. An ultrasensitive method for quantitating circulating tumor DNA with broad patient coverage. Nat Med. 2014;20:548–54. doi: 10.1038/nm.3519. [DOI] [PMC free article] [PubMed] [Google Scholar]
- 29.Jamal-Hanjani M, et al. Tracking the Evolution of Non-Small-Cell Lung Cancer. N Engl J Med. 2017;376:2109–2121. doi: 10.1056/NEJMoa1616288. [DOI] [PubMed] [Google Scholar]
- 30.Campeau E, et al. A versatile viral system for expression and depletion of proteins in mammalian cells. PLoS One. 2009;4:e6529. doi: 10.1371/journal.pone.0006529. [DOI] [PMC free article] [PubMed] [Google Scholar]
- 31.Morgenstern JP, Land H. Advanced mammalian gene transfer: high titre retroviral vectors with multiple drug selection markers and a complementary helper-free packaging cell line. Nucleic Acids Res. 1990;18:3587–96. doi: 10.1093/nar/18.12.3587. [DOI] [PMC free article] [PubMed] [Google Scholar]
- 32.Stewart SA, et al. Lentivirus-delivered stable gene silencing by RNAi in primary cells. RNA. 2003;9:493–501. doi: 10.1261/rna.2192803. [DOI] [PMC free article] [PubMed] [Google Scholar]
- 33.Zhao JJ, et al. The oncogenic properties of mutant p110alpha and p110beta phosphatidylinositol 3-kinases in human mammary epithelial cells. Proc Natl Acad Sci U S A. 2005;102:18443–8. doi: 10.1073/pnas.0508988102. [DOI] [PMC free article] [PubMed] [Google Scholar]
- 34.Kolligs FT, Hu G, Dang CV, Fearon ER. Neoplastic transformation of RK3E by mutant beta-catenin requires deregulation of Tcf/Lef transcription but not activation of c-myc expression. Mol Cell Biol. 1999;19:5696–706. doi: 10.1128/mcb.19.8.5696. [DOI] [PMC free article] [PubMed] [Google Scholar]
- 35.Okimoto RA, et al. Inactivation of Capicua drives cancer metastasis. Nat Genet. 2017;49:87–96. doi: 10.1038/ng.3728. [DOI] [PMC free article] [PubMed] [Google Scholar]
- 36.Blakely CM, et al. NF-kappaB-activating complex engaged in response to EGFR oncogene inhibition drives tumor cell survival and residual disease in lung cancer. Cell Rep. 2015;11:98–110. doi: 10.1016/j.celrep.2015.03.012. [DOI] [PMC free article] [PubMed] [Google Scholar]
- 37.Subramanian A, et al. Gene set enrichment analysis: a knowledge-based approach for interpreting genome-wide expression profiles. Proc Natl Acad Sci U S A. 2005;102:15545–50. doi: 10.1073/pnas.0506580102. [DOI] [PMC free article] [PubMed] [Google Scholar]
Associated Data
This section collects any data citations, data availability statements, or supplementary materials included in this article.
Supplementary Materials
Data Availability Statement
The data supporting the findings of the study are available within the paper and its supplementary information files and have been deposited publically in the European Genome-phenome Archive (EGA), accession number: EGAS00001002604.