Abstract
This technical note describes how to modify a population-based arterial input function to incorporate variation among the individuals. In DCE-MRI, an arterial input function (AIF) is often distorted by pulsated inflow effect and noise. A population-based AIF (pAIF) has high signal-to-noise ratio (SNR), but cannot incorporate the individual variation. AIF variation is mainly induced by variation in cardiac output and blood volume of the individuals, which can be detected by the full width at half maximum (FWHM) during the first passage and the amplitude of AIF, respectively. Thus pAIF scaled in time and amplitude fitting to the individual AIF may serve as a high SNR AIF incorporating the individual variation. The proposed method was validated using DCE-MRI images of 18 prostate cancer patients. Root mean square error (RMSE) of pAIF from individual AIFs was 0.88±0.48 mM (mean±SD), but it was reduced to 0.25±0.11 mM after pAIF modification using the proposed method (p<0.0001).
Keywords: Arterial input function, DCE-MRI
1. Introduction
Dynamic contrast enhanced magnetic resonance imaging (DCE-MRI) is a physiologic MRI technique to determine perfusion parameters of a target tissue by monitoring the dynamic change of contrast concentration over time. DCE-MRI has been employed in routine clinical care for diagnosis and prognosis of various cancers [1–3]. To quantitate tissue perfusion parameters in DCE-MRI, arterial input function (AIF) must be determined [4–6]. In abdominal DCE-MRI, the AIF can be retrieved from the arteries within the image field-of-view. But AIFs are often distorted by pulsated inflow effect caused by unsaturated blood flow [7,8]. In addition, MRI signal intensity has a nonlinear relationship with contrast concentration, thus noise in MRI signal tends to be amplified in quantification of contrast concentration [9]. A population-based AIF (pAIF) is obtained by averaging a large number of AIFs [10], yielding high signal-to-noise ratio (SNR). In quantitative DCE-MRI, pAIF has been used as an alternative when a reliable AIF was not available. However pAIF does not incorporate the individual variation, inducing error in quantitating perfusion parameters.
We recently introduced a new method of using modified pAIF to incorporate the individual variation [11]. The AIF variation is mainly induced by variation in cardiac output and blood volume among the individuals. Cardiac output determines the sharpness of an AIF, which can be quantitated as the full width at half maximum (FWHM) during the first passage. Blood volume determines the AIF amplitude. Although contrast agent is injected in a body-weight dependent manner (usually 0.05~0.15 mmol/kg), contrast concentration in blood plasma may vary among the individuals, because blood volume is affected by not only body weight, but also body composition [12].
Cardiac output is proportional to the AIF sharpness, and blood volume is inversely proportional to its amplitude. Therefore pAIF scaled in time to fit into the FWHM of an AIF during the first passage and then scaled to fit into the amplitude of the AIF may be used as a reliable AIF having high SNR as well as incorporating the individual variation. In this study, the proposed method was validated using DCE-MRI images of 18 prostate cancer patients.
2. Materials and Methods
2.1. Proposed approach
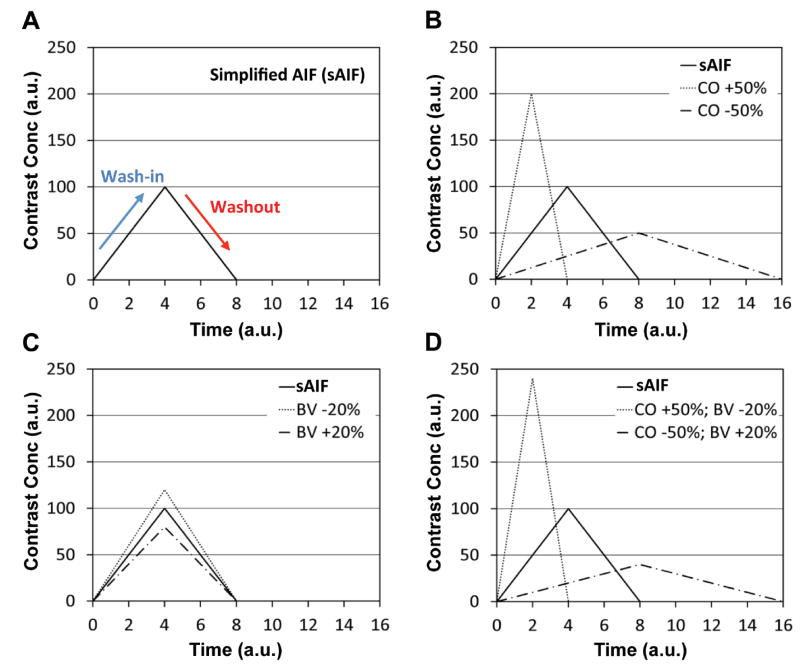
Figure 1 illustrates the AIF variation according to cardiac output and blood volume of the individuals. Figure 1A shows a simplified AIF (sAIF) represented as a triangular function where the peak signal is present at 4 (arbitrary unit). Figure 1B shows that the sharpness of sAIF is changed in proportional to the cardiac output (CO), when the other conditions including blood volume, body weight, contrast infusion rate, and dose amount are the same. As the total dose amount is not changed, the areas under the AIFs are consistent. Figure 1C shows the amplitude of sAIF is inversely proportional to the blood volume (BV). Figure 1D shows sAIF variation when cardiac output is 50% higher and blood volume is 20% lower (CO +50%; BV−20%) or when cardiac output is 50% lower and blood volume is 20% higher (CO−50%; BV +20%).
Figure 1.
Illustration of AIFs according to the individual variation. (A) An AIF simplified with a triangular function (sAIF). (B) AIFs when cardiac output is 50% higher (CO +50%) or 50% lower (CO −50%) than that of sAIF. (C) AIFs when blood volume is 20% higher (BV +20%) or 20% lower (BV −20%) than that of sAIF. (D) AIFs when cardiac output is 50% higher and blood volume is 20% lower (CO +50%; BV −20%) or when cardiac output is 50% lower and blood volume is 20% higher (CO −50%; BV +20%).
Figure 2 demonstrates how to modify pAIF to incorporate the individual variation in two simple steps. Figure 2A shows a pAIF (same with sAIF in Fig. 1) and an individual AIF (iAIF) having 50% higher cardiac output and 20% lower blood volume than the average with random error (10% in average). First, the pAIF is scaled in time to match its FWHM with that of iAIF, indicated with two dotted vertical lines (Fig. 2B). Second, the amplitude of the time-scaled pAIF is stretched to be matched with that of iAIF (Fig. 2C).
Figure 2.
Illustration of modifying a pAIF to incorporate the individual variation. (A) A pAIF (same with sAIF in Fig. 1A) and an individual AIF (iAIF) having 50% higher cardiac output and 20% lower blood volume than the average with random error (10% in average) (CO +50%; BV −20%; 10% error). The pAIF and iAIF are indicated with a solid line and circular dots, respectively. (B) pAIF scaled in time to match its FWHM with that of iAIF. FWHM is indicated with two dotted vertical lines. (C) Time and amplitude scaled pAIF fitting into the iAIF.
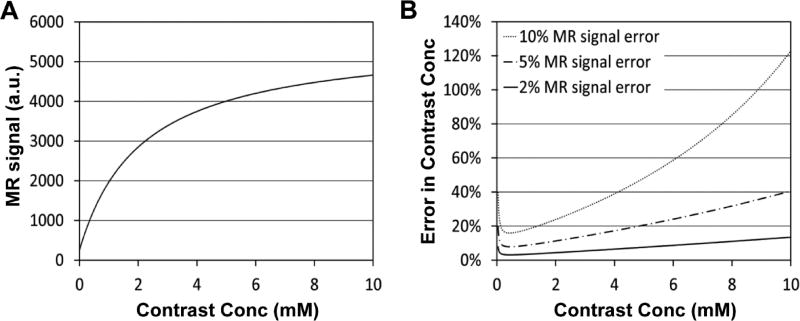
Figure 3A shows the nonlinear relationship between MRI signal intensity and contrast concentration when a fast spoiled gradient echo sequence is used with 15° flip angle. MRI signal intensity is gradually saturated over the contrast concentration, thus error in MRI signal is amplified when converted to contrast concentration. Figure 3B shows error in contrast concentration when MRI signal has 2%, 5% or 10% error. Error is exponentially increased over the contrast concentration, especially when error in MRI signal is 10% or higher. AIF amplitude during the first passage is usually higher than 2 mM, thus often severely affected by noise. So the AIF amplitude only after the second peak was used for fitting in this study.
Figure 3.
Simulation of error in quantitating contrast concentration. (A) MRI signal intensity versus contrast concentration, when a fast spoiled gradient echo sequence is used with 15° flip angle. (B) Error in contrast concentration, when error in MRI signal is 2%, 5% or 10%.
2.2. DCE-MRI protocol
IRB-approved prostate DCE-MRI data were collected in the Brigham and Women’s Hospital [13] and uploaded to The Cancer Imaging Archive (TCIA) for data sharing [14]. Among them (n=22), 18 data sets that DCE-MRI was applied for 3.8~4.5 minutes were used in this study. A single 3T MRI scanner (GE SIGNA; GE Healthcare, Waukesha, WI) was employed together with 8-channel body coil and endorectal coil (Medrad, Pittsburgh, PA). Prior to DCE-MRI, T1 weighted imaging with various flip angles (5°, 10°, 15°, 20°, 25°, and 30°) was applied for T1 mapping. Gadopentetate dimeglumine (Gd-DTPA; 0.15 mmol/kg) was i.v. injected at about 25 seconds after imaging initiation and followed by 20 ml saline at a constant infusion rate (3 ml/s). A 3D fast spoiled gradient echo sequence was used for both DCE-MRI and various flip angle (VFA) T1 weighted imaging with the following parameters: TR/TE = 3.6/1.3 ms, FOV = 260×260 mm, thickness = 6 mm, and matrix size = 256×256. The number of slices was 12~16, and the temporal resolution was 4.4~5.3 seconds.
2.3. Image processing
DCE-MRI images were registered using an automated rigid registration technique [15]. A various flip-angle (VFA) method was employed to create T1 maps [16]. Contrast maps were created using equation,
| (1) |
where r1 is the longitudinal relaxivity of gadopentetate dimeglumine, TR is repetition time, M0 is the original magnetization, θ is a flip angle, S is the MRI signal, and T1(0) is pre-contrast T1 value. The r1 of gadopentetate dimeglumine in blood plasma at 3T was estimated to 3.7 s−1mM−1 [17]. The artery region was automatically determined using Parker et al’s method [18]. In brief, the time course of each voxel was retrieved, and the voxels having the peak signal within 20 seconds after the contrast agent arrival were selected and followed by a median filtering (window size: 5×5). Among the remainders, the voxels of which the peak signals are within the top 80% were determined as the region of interest (ROI). Then the dynamic change of contrast concentration over time in the ROI was used as an AIF. To minimize the pulsated inflow effect, the 7th, 8th and 9th image slices were selected [19], and three AIFs retrieved from those were averaged to create the individual AIF (iAIF). The 1st image slice was superior in position to the 2nd one. Total 18 iAIFs were determined in this study, and those were averaged to create the pAIF. Three Ktrans (volume transfer constant) maps of a representative patient were created with pAIF, iAIF and mpAIF, respectively, using extended Tofts model [20]. Hematocrit ratio was assumed to be 0.45. All image processing and analyses were implemented using an in-house computer software package made of Labview (National Instruments Co., Austin, TX).
The root mean square error (RMSE) of each iAIF from the pAIF was calculated over the time course and then averaged. Using the proposed method, the pAIF was modified for each iAIF. Then the RMSE of each iAIF from the corresponding modified pAIF (mpAIF) was calculated over the time course and then averaged. All mpAIFs were obtained from the pAIF using a fully automated image processing software package made of Labview.
2.4. Statistical analysis
The RMSEs of iAIFs from the pAIF were compared with those from the mpAIFs using one-way analysis of variance [21]. P values less than 0.05 were considered significant. Data are presented with mean ± standard deviation. Statistical analysis was implemented using SAS, version 9.4 (SAS Institute Inc., Cary, NC).
3. Results
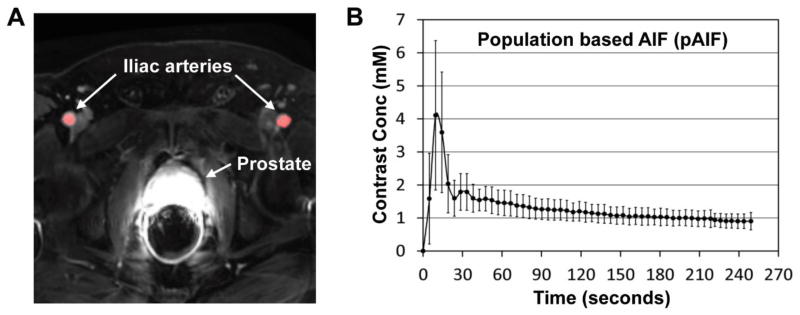
Figure 4A shows a representative DCE-MRI image of a prostate cancer patient. Two iliac arteries are indicated with white arrows, and the ROI for AIF determination is highlighted in red. Figure 4B shows the pAIF obtained in this study (mean and SD). The first peak signal occurred at 9.5 seconds after the contrast agent arrival. The coefficient of variation (COV) at the peak signal was 55%, but it became less than 30% after the second peak.
Figure 4.
Representative DCE-MRI image and the population based AIF. (A) A representative DCE-MRI image. Two iliac arteries and the prostate are indicated with white arrows. The ROI for AIF determination is highlighted in red. (B) The population based AIF (pAIF) obtained in this study (mean and SD).
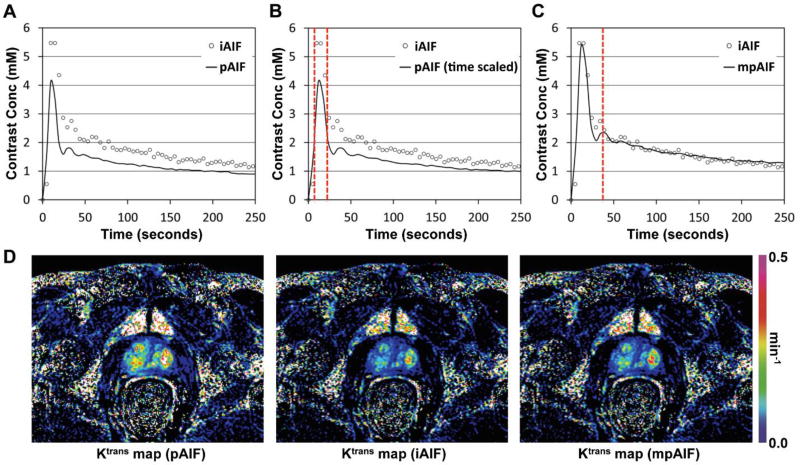
Figure 5 demonstrates how to obtain an mpAIF by modifying the pAIF. Figure 5A shows the pAIF (solid curve) and a representative iAIF (circles) retrieved in this study. The FWHM of the pAIF was 13 seconds, while that of the iAIF was 19 seconds. Figure 5B shows that the pAIF was scaled in time to match its FWHM with that of the iAIF, indicated with two dotted vertical lines. Figure 5C shows that the amplitude of the time-scaled pAIF was adjusted to fit into that of the iAIF after the second peak indicated with a dotted vertical line. The RMSE of the iAIF from the pAIF was 0.66 mM, but that from the mpAIF was only 0.29 mM. Figure 5D shows three Ktrans maps of a patient created with pAIF, iAIF and mpAIF, respectively, shown in Figs. 5A–C. The same color scale was applied for all images.
Figure 5.
Procedure of obtaining the modified population-based AIF (mpAIF). (A) The population-based AIF (pAIF) and an individualized AIF (iAIF) indicated with a solid curve and circular dots. (B) pAIF scaled in time to match its FWHM with that of iAIF, indicated with two dotted vertical lines. (C) Time and amplitude scaled pAIF (mpAIF) fitting into the iAIF after the second peak indicated with a dotted vertical line. (D) Three Ktrans maps of a patient when pAIF, iAIF and mpAIF shown in Figs. 5A–C were used, respectively. The same color scale was applied for all images.
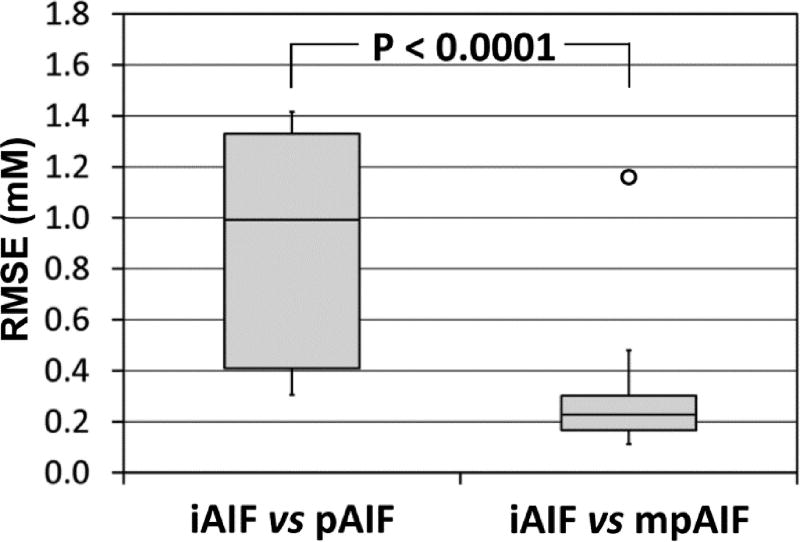
Figure 6 shows box plots of the RMSEs of iAIFs from the pAIF or mpAIFs. The top and bottom of each box represent the interquartile data range (IQR), while the whiskers attached on the box show the entire data range. The horizontal line within the box represents the median. One outlier was detected among the RMSEs of iAIFs from mpAIFs. The outliers were defined as the values higher than the box top plus 1.5×IQR or those lower than the box bottom minus 1.5×IQR. The mean RMSE of iAIFs from mpAIFs excluding the outlier was 0.25±0.11 mM, which was significantly lower than that from the pAIF (0.88±0.48 mM) (p<0.0001).
Figure 6.
Box plots of root mean square error (RMSE). RMSEs of iAIFs from the pAIF (iAIF vs pAIF) or those from the mpAIFs (iAIF vs mpAIF). The RMSEs of two groups were significantly different (p<0.0001), although one outlier was detected among the RMSEs of iAIFs from mpAIFs.
4. Discussion
The proposed method is to determine an AIF by modifying the pAIF to incorporate the individual variation. This method can yield a reliable alternative, when an AIF is severely influenced by noise and/or pulsated inflow effect, but the FWHM of the first passage and the AIF amplitude after the second peak can be still determined. After the second peak, spike noise induced by pulsated inflow effect can be removed by median filtering, while Gaussian noise induced by hardware instability can be minimized by various techniques including mean and Gaussian filtering and eventually by amplitude fitting. However, during the first passage, an AIF is rapidly changing over time, so digital filtering may not be effective to reduce noise. Besides, noise in the first passage is often significantly amplified, making the peak signal unreliable. For example, the outlier in Fig. 6 was resulted from an iAIF having an erroneously high peak signal. In addition, the peak signal may be underestimated due to the inherent limitation of some imaging sequences like GRASP [22] and spiral GRAPPA [23]. However, regardless of the uncertainty of the AIF amplitude during the first passage, its FWHM may be rather easily determined. The AIF sharpness can be also estimated using the time to peak (TTP), arrival time (AT) of contrast agent, or relative time to peak (rTTP = TTP – AT). In order to determine the AIF sharpness, however, the temporal resolution of the AIF should be sufficiently high (ideally 1~2 seconds) [10].
Variation in the AIF amplitude can be also caused by the uncertainty in determining the relaxivity of a contrast agent. The relaxivity is a unique chemical property of a contrast agent in the function of magnetic field and temperature. The relaxivity is inversely proportional to the AIF amplitude (see equation 1), thus it must be determined for each contrast agent at each magnetic field. However, the measurement of the relaxivity was often inconsistent. For example, the relaxivity of gadoteridol in blood (3T at 37 °C) was 3.09 s−1mM−1 in Blockely et al’s measurement [24], but that by Lin et al was 5.0 s−1mM−1 [25]. The AIF variation induced by selecting a different relaxivity can be also incorporated by the proposed method via amplitude fitting.
The proposed method, however, may not be valid when multiple contrast agents having different physiochemical properties are used. Although most gadolinium-based contrast agents have similar physiochemical properties [26,27], it has not been verified whether the AIFs of those are comparable. Also, if cardiac output of an individual significantly varies during DCE-MRI, this method may not be valid either.
The reliability of this approach is heavily dependent upon the quality of pAIF. To minimize error in a pAIF, a large number of iAIFs without severe artifact and/or noise should be averaged. Besides, it would be necessary to determine the pAIF from the arteries nearest to the target organ, because pAIFs obtained from different arteries could be inconsistent. If arteries present within the image field of view are not large enough, partial volume effect may influence the AIF [28]. Partial volume effect may also occur near to the edge of the ROI [29], so care must be taken.
The pAIF obtained by Parker et al has been considered reliable and thereby used for many DCE-MRI studies over a decade [10]. Major differences between the pAIF in this study and the one by Parker et al are in contrast agent (Gd-DTPA vs Gd-DTPA-BMA), artery location (iliac arteries vs abdominal aorta), dose amount (0.15 mmol/kg vs 0.1 mmol/kg), and magnetic field strength (3.0T vs 1.5T). If pAIF variations induced by different contrast agent and artery location were only modest, the amplitude of pAIF in this study should be about 50% higher than that of Parker pAIF; this was observed in this study after the second peak. But the first peak of pAIF in this study was about 30% lower than that of Parker pAIF. This discrepancy may be explained by T2* effect induced by contrast agent. Equation (1) is valid only when T2* is at least ten fold larger than TE [30]. If not, the contrast concentration would be underestimated. T2* is inversely proportional to magnetic field strength as well as contrast concentration. Thus the higher magnetic field strength is, the more T2* decreases, leading to the AIF underestimation especially during the first passage. Therefore pAIF obtained at a lower field MR scanner may serve better for the proposed method.
In this study, the iAIFs measured from iliac arteries were used to evaluate the proposed method. However the ground-truth AIF should be created using a flow phantom whose contrast concentration is accurately controlled by a programmable syringe pump and thereby reliably repeatable over time. The measured iAIF may serve as a reasonable alternative, as long as it is not severely corrupted by noise and/or artifact, but the noise amplification during the first passage would be inevitable as demonstrated in Fig. 3B. Thus the ultimate validation of this method will need to be accomplished with a flow phantom, as the one recently introduced by Knight et al [31].
Another limitation of this study was that flip angle variation over the field of view due to B1 non-uniformity was not corrected. High field strength (3T and above) increases B1 field non-uniformity due to the dielectric effect [32]. Since the flip angle is linearly proportional to the B1 field strength, B1 non-uniformity results in flip angle variation over the field of view, which leads to error in quantification of T1 value and consequentially the AIF. Therefore a B1 map will need to be obtained to compensate for the local B1 field non-uniformity especially in high field MRI. A number of B1 mapping methods have been proposed [33–40].
5. Conclusions
The proposed method is to determine a reliable AIF by modifying a population based AIF to incorporate the variation of the individuals. This method will be valid when the AIF sharpness during the first passage and its amplitude after the second peak can be measured despite of pulsated inflow effect and/or noise. This method, however, assumes that the cardiac output of an individual is consistent during DCE-MRI.
Acknowledgments
Financial support was provided by NIH grant 5P30CA013148 and Research Initiative Pilot Award from the Department of Radiology.
Abbreviations
- AIF
Arterial input function
- DCE-MRI
Dynamic contrast enhanced magnetic resonance imaging
- pAIF
Population-based AIF
- iAIF
Individual AIF
- sAIF
Simplified AIF
- mpAIF
Modified population-based AIF
Footnotes
Publisher's Disclaimer: This is a PDF file of an unedited manuscript that has been accepted for publication. As a service to our customers we are providing this early version of the manuscript. The manuscript will undergo copyediting, typesetting, and review of the resulting proof before it is published in its final citable form. Please note that during the production process errors may be discovered which could affect the content, and all legal disclaimers that apply to the journal pertain.
DISCLOSURE OF CONFLICTS OF INTEREST
The author has no relevant conflicts of interest to disclose.
References
- 1.Arevalo-Perez J, Kebede AA, Peck KK, Diamond E, Holodny AI, Rosenblum M, et al. Dynamic contrast-enhanced MRI in low-grade versus anapestic oligodendrogliomas. J of Neuroimaging. 2016;26(3):366–71. doi: 10.1111/jon.12320. [DOI] [PMC free article] [PubMed] [Google Scholar]
- 2.Wu J, Gong G, Cui Y, Li R. Intratumor partitioning and texture analysis of dynamic contrast-enhanced (DCE)-MRI identifies relevant tumor subregions to predict pathological response of breast cancer to neoadjuvant chemotherapy. J Magn Reson Imaging. 2016;44(5):1107–15. doi: 10.1002/jmri.25279. [DOI] [PMC free article] [PubMed] [Google Scholar]
- 3.Berman RM, Brown AM, Chang SD, Sankineni S, Kadakia M, Wood BJ, et al. DCE MRI of prostate cancer. Abdom Radiol. 2016;41(5):844–53. doi: 10.1007/s00261-015-0589-3. [DOI] [PMC free article] [PubMed] [Google Scholar]
- 4.Yankeelov TE, Rooney WD, Huang W, Dyke JP, Li X, Tudorica A, et al. Evidence for shutter-speed variation in CR bolus-tracking studies of human pathology. NMR Biomed. 2005;18(3):173–85. doi: 10.1002/nbm.938. [DOI] [PubMed] [Google Scholar]
- 5.Yankeelov TE, Rooney WD, Li X, Springer CS., Jr Variation of the relaxographic "shutter-speed" for transcytolemmal water exchange affects the CR bolus-tracking curve shape. Magn Reson Med. 2003;50(6):1151–69. doi: 10.1002/mrm.10624. [DOI] [PubMed] [Google Scholar]
- 6.Logan J, Fowler JS, Volkow ND, Wolf AP, Dewey SL, Schlyer DJ, et al. Graphical analysis of reversible radioligand binding from time-activity measurements applied to [N-11C-methyl]-(-)-cocaine PET studies in human subjects. J Cereb Blood Flow Metab. 1990;10(5):740–7. doi: 10.1038/jcbfm.1990.127. [DOI] [PubMed] [Google Scholar]
- 7.Peeters F, Annet L, Hermoye L, Van Beers BE. Inflow correction of hepatic perfusion measurements using T1-weighted, fast gradient-echo, contrast-enhanced MRI. Magn Reson Med. 2004;51(4):710–7. doi: 10.1002/mrm.20032. [DOI] [PubMed] [Google Scholar]
- 8.Ivancevic MK, Zimine I, Montet X, Hyacinthe JN, Lazeyras F, Foxall D, et al. Inflow effect correction in fast gradient-echo perfusion imaging. Magn Reson Med. 2003;50(5):885–91. doi: 10.1002/mrm.10633. [DOI] [PubMed] [Google Scholar]
- 9.Heilmann M, Kiessling F, Enderlin M, Schad LR. Determination of pharmacokinetic parameters in DCE MRI: Consequence of nonlinearity between contrast agent concentration and signal intensity. Invest Radiol. 2006;41(6):536–43. doi: 10.1097/01.rli.0000209607.99200.53. [DOI] [PubMed] [Google Scholar]
- 10.Parker GJ, Roberts C, Macdonald A, Buonaccorsi GA, Cheung S, Buckley DL, et al. Experimentally-derived functional form for a population-averaged high-temporal-resolution arterial input function for dynamic contrast-enhanced MRI. Magn Reson Med. 2006;56(5):993–1000. doi: 10.1002/mrm.21066. [DOI] [PubMed] [Google Scholar]
- 11.Kim H, Mousa M, Schexnailder P, Hergenrother R, Bolding M, Ntsikoussalabongui B, et al. Portable perfusion phantom for quantitative DCE-MRI of the abdomen. Med Phys. 2017 doi: 10.1002/mp.12466. [Epub ahead of print] [DOI] [PMC free article] [PubMed] [Google Scholar]
- 12.Kearns CF, McKeever KH, John-Alder H, Abe T, Brechue WF. Relationship between body composition, blood volume and maximal oxygen uptake. Equine Vet J Suppl. 2002;(34):485–90. doi: 10.1111/j.2042-3306.2002.tb05470.x. [DOI] [PubMed] [Google Scholar]
- 13.Fedorov A, Fluckiger J, Ayers GD, Li X, Gupta SN, Tempany C, et al. A comparison of two methods for estimating DCE-MRI parameters via individual and cohort based AIFs in prostate cancer: a step towards practical implementation. Magn Reson Imaging. 2014;32(4):321–9. doi: 10.1016/j.mri.2014.01.004. [DOI] [PMC free article] [PubMed] [Google Scholar]
- 14.Clark K, Vendt B, Smith K, Freymann J, Kirby J, Koppel P, et al. The Cancer Imaging Archive (TCIA): maintaining and operating a public information repository. J Digit Imaging. 2013;26(6):1045–57. doi: 10.1007/s10278-013-9622-7. [DOI] [PMC free article] [PubMed] [Google Scholar]
- 15.Klein S, Staring M, Murphy K, Viergever MA, Pluim JP. elastix: a toolbox for intensity-based medical image registration. IEEE Trans Med Imaging. 2010;29(1):196–205. doi: 10.1109/TMI.2009.2035616. [DOI] [PubMed] [Google Scholar]
- 16.Liberman G, Louzoun Y, Ben Bashat D. T(1) mapping using variable flip angle SPGR data with flip angle correction. J Magn Reson Imaging. 2014;40(1):171–80. doi: 10.1002/jmri.24373. [DOI] [PubMed] [Google Scholar]
- 17.Rohrer M, Bauer H, Mintorovitch J, Requardt M, Weinmann HJ. Comparison of magnetic properties of MRI contrast media solutions at different magnetic field strengths. Invest Radiol. 2005;40(11):715–24. doi: 10.1097/01.rli.0000184756.66360.d3. [DOI] [PubMed] [Google Scholar]
- 18.Parker GJ, Jackson A, Waterton JC, Buckley DL. Automated arterial input function extraction for T1-weighted DCE-MRI. Proc Intl Soc Mag Reson Med. 2003;11:1264. [Google Scholar]
- 19.Roberts C, Little R, Watson Y, Zhao S, Buckley DL, Parker GJ. The effect of blood inflow and B1-field inhomogeneity on Measurement of the arterial input function in axial 3D spoiled gradient echo dynamic contrast-enhanced MRI. Magn Reson Med. 2011;65:108–19. doi: 10.1002/mrm.22593. [DOI] [PubMed] [Google Scholar]
- 20.Tofts PS. Modeling tracer kinetics in dynamic Gd-DTPA MR imaging. J Magn Reson Imaging. 1997;7(1):91–101. doi: 10.1002/jmri.1880070113. [DOI] [PubMed] [Google Scholar]
- 21.Neter J, Kutner MH, Nachtsheim JC, Wasserman W. Applied linear statistical models. Columbus: The McGraw-Hill Companies, Inc.; 1996. [Google Scholar]
- 22.Chandarana H, Feng L, Block TK, Rosenkrantz AB, Lim RP, Babb JS, et al. Free-breathing contrast-enhanced multiphase MRI of the liver using a combination of compressed sensing, parallel imaging, and golden-angle radial sampling. Invest Radiol. 2013;48(1):10–6. doi: 10.1097/RLI.0b013e318271869c. [DOI] [PMC free article] [PubMed] [Google Scholar]
- 23.Chen Y, Lee GR, Wright KL, Badve C, Nakamoto D, Yu A, et al. Free-breathing liver perfusion imaging using 3-dimensional through-time spiral generalized autocalibrating partially parallel acquisition acceleration. Invest Radiol. 2015;50(6):367–75. doi: 10.1097/RLI.0000000000000135. [DOI] [PMC free article] [PubMed] [Google Scholar]
- 24.Blockley NP, Jiang L, Gardener AG, Ludman CN, Francis ST, Gowland PA. Field strength dependence of R1 and R2* relaxivities of human whole blood to ProHance, Vasovist, and deoxyhemoglobin. Magn Reson Med. 2008;60(6):1313–20. doi: 10.1002/mrm.21792. [DOI] [PubMed] [Google Scholar]
- 25.Lin C, Bernstein J, Houston SF. Measurements of T1 relaxation times at 3.0T: Implications for clinical MRA. Proc Intl Soc Mag Reson Med. 2001;9:1391. [Google Scholar]
- 26.Tweedle MF. The ProHance story: the making of a novel MRI contrast agent. Eur Radiol. 1997;5(7 Suppl):225–30. doi: 10.1007/pl00006897. [DOI] [PubMed] [Google Scholar]
- 27.Aime S, Caravan P. Biodistribution of gadolinium-based contrast agents, including gadolinium deposition. J Magn Reson Imaging. 2009;30(6):1259–67. doi: 10.1002/jmri.21969. [DOI] [PMC free article] [PubMed] [Google Scholar]
- 28.Hoffman EJ, Huang SC, Phelps ME. Quantitation in positron emission computed tomography: 1. Effect of object size. J Comput Assist Tomogr. 1979;3(3):299–308. doi: 10.1097/00004728-197906000-00001. [DOI] [PubMed] [Google Scholar]
- 29.Kim H, Morgan DH. Semiautomatic Determination of Arterial Input Function in DCE-MRI of the Abdomen. J Biomed Eng Med Imaging. 2017;4(2):96–104. doi: 10.14738/jbemi.42.3041. [DOI] [PMC free article] [PubMed] [Google Scholar]
- 30.Bokacheva L, Rusinek H, Chen Q, Oesingmann N, Prince C, Kaur M, et al. Quantitative determination of Gd-DTPA concentration in T1-weighted MR renography studies. Magn Reson Med. 2007;57:1012–8. doi: 10.1002/mrm.21169. [DOI] [PubMed] [Google Scholar]
- 31.Knight SP, Browne JE, Meaney JF, Smith DS, Fagan AJ. A novel anthropomorphic flow phantom for the quantitative evaluation of prostate DCE-MRI acquisition techniques. Phys Med Biol. 2016;61(20):7466–83. doi: 10.1088/0031-9155/61/20/7466. [DOI] [PMC free article] [PubMed] [Google Scholar]
- 32.Gabriel C, Gabriel S, Corthout E. The dielectric properties of biological tissues: I. Literature survey. Phys Med Biol. 1996;41(11):2231–49. doi: 10.1088/0031-9155/41/11/001. [DOI] [PubMed] [Google Scholar]
- 33.Cunningham CH, Pauly JM, Nayak KS. Saturated double-angle method for rapid B1+ mapping. Magn Reson Med. 2006;55(6):1326–33. doi: 10.1002/mrm.20896. [DOI] [PubMed] [Google Scholar]
- 34.Choi N, Lee J, Kim MO, Shin J, Kim DH. A modified multi-echo AFI for simultaneous B1(+) magnitude and phase mapping. Magn Reson Imaging. 2014;32(4):314–20. doi: 10.1016/j.mri.2013.12.005. [DOI] [PubMed] [Google Scholar]
- 35.Morrell GR. A phase-sensitive method of flip angle mapping. Magn Reson Med. 2008;60(4):889–94. doi: 10.1002/mrm.21729. [DOI] [PubMed] [Google Scholar]
- 36.Jiru F, Klose U. Fast 3D radiofrequency field mapping using echo-planar imaging. Magn Reson Med. 2006;56(6):1375–9. doi: 10.1002/mrm.21083. [DOI] [PubMed] [Google Scholar]
- 37.Dowell NG, Tofts PS. Fast, accurate, and precise mapping of the RF field in vivo using the 180 degrees signal null. Magn Reson Med. 2007;58(3):622–30. doi: 10.1002/mrm.21368. [DOI] [PubMed] [Google Scholar]
- 38.Balezeau F, Eliat PA, Cayamo AB, Saint-Jalmes H. Mapping of low flip angles in magnetic resonance. Phys Med Biol. 2011;56(20):6635–47. doi: 10.1088/0031-9155/56/20/008. [DOI] [PMC free article] [PubMed] [Google Scholar]
- 39.Sacolick LI, Wiesinger F, Hancu I, Vogel MW. B1 mapping by Bloch-Siegert shift. Magn Reson Med. 2010;63(5):1315–22. doi: 10.1002/mrm.22357. [DOI] [PMC free article] [PubMed] [Google Scholar]
- 40.Chung S, Kim D, Breton E, Axel L. Rapid B1+ mapping using a preconditioning RF pulse with TurboFLASH readout. Magn Reson Med. 2010;64(2):439–46. doi: 10.1002/mrm.22423. [DOI] [PMC free article] [PubMed] [Google Scholar]


