

Abstract
Purpose
To development a high temporal resolution imaging method that measures muscle-specific phosphocreatine (PCr) resynthesis time constant (τPCr) and pH changes in muscles of the lower leg following exercise on a clinical 3T MRI scanner.
Methods
We developed a frequency-selective 3D non-Cartesian FLORET sequence to measure PCr with 17-mm nominal isotropic resolution (28 mm actual resolution) and 6-s temporal resolution to capture dynamic metabolic muscle activity. The sequence was designed to additionally collect inorganic phosphate spectra for pH quantification, which were localized using sensitivity profiles of individual coil elements. Nineteen healthy volunteers were scanned while performing a plantar flexion exercise on an in-house developed ergometer. Data were acquired with a dual-tuned multi-channel coil array that enabled phosphorus imaging and proton localization for muscle segmentation.
Results
After a 90-s plantar flexion exercise at 0.66 Hz with resistance set to 40 % of the maximum voluntary contraction, τPCr was estimated at 22.9 ± 8.8 s (mean ± standard deviation) with statistical coefficient of determination r2 = 0.89 ± 0.05. The corresponding pH values after exercise were in the range of 6.9–7.1 in the gastrocnemius muscle.
Conclusion
The developed technique allows measurement of muscle-specific PCr resynthesis kinetics and pH changes following exercise, with a temporal resolution and accuracy comparable to that of single voxel 31P-MRS sequences.
Keywords: phosphocreatine resynthesis, dynamic 31P MRI, human calf muscle, muscle metabolism, pH assessment, X-nuclei imaging
INTRODUCTION
Mitochondrial impairment is a key feature of many diseases with high socioeconomic impact including diabetes mellitus, peripheral arterial disease, and cardiac failure [1–5]. Phosphorus (31P) magnetic resonance spectroscopy (MRS) has been used extensively to study muscle mitochondrial function by measuring the kinetics of phosphocreatine (PCr) resynthesis after exercise, which relates directly to the production of adenosine triphosphate (ATP) through oxidative phosphorylation in the mitochondria [6–9].
Given the low sensitivity of 31P-MRS, dynamic PCr measurements during rest-exercise and subsequent recovery have been performed mostly using small surface coils and unlocalized MRS methods [10]. However, these measurements are not well-suited to differentiate between muscles that are recruited during exercise and those that are not. Therefore, such methods can introduce errors in the estimation of energy metabolism parameters. As was shown recently by Meyerspeer et al. [11], the improved spatial localization provided by single voxel 31P-MRS resulted in increased specificity of the PCr resynthesis time constant (τPCr) measurement and a more accurate picture of skeletal muscle energy metabolism [12, 13].
Certain diseases, such as type 2 diabetes mellitus, are known to result in spatially heterogeneous alteration of energy metabolism in the skeletal muscle [14]. Therefore, metabolic function mapping with volumetric 31P-MRSI sequences could become a powerful tool for the study of metabolic diseases. Traditional multivoxel MRS methods, such as 31P chemical shift imaging [15, 16], require very long acquisition times, which makes them unsuitable to measure muscle recovery dynamics. More recently, dynamic 31P-MRS and MRI techniques have been developed for ultra-high field MRI (7T) [17–20], which benefit from an almost threefold 31P signal-to-noise ratio (SNR) improvement compared with 3T [21, 22]. While the 3T environment presents obstacles for 31P dynamic imaging, it is far more widespread and thus allows greater access to patients. Furthermore, the 3T platform offers standardized proton techniques such as blood oxygenation level-dependent MRI [23] and arterial spin labeling [24] that are essential for assessing micro- and macrovascular functions in skeletal muscle. Together with 31P-MRI, these techniques provide comprehensive insight on mitochondrial and vascular activity. However, to the best of our knowledge, dynamic 31P-MRI with sufficiently fast temporal resolution has not been reported on the challenging 3T platform. In this study, we focused on the development of a 3T phosphorus imaging technique that is able to acquire dynamic PCr images with a temporal resolution close to that achieved through unlocalized 31P-MRS (i.e., 6 s) while monitoring pH changes after exercise.
METHODS
We recruited 19 healthy volunteers to participate in the study. The study was approved by the New York University Institutional Review Board and human subjects provided written consent before scanning. All experiments were performed on a whole body 3T Siemens Prisma MRI scanner (Siemens Healthineers, Erlangen, Germany). The imaging protocol included one 1H-MRI acquisition for spatial localization and muscle segmentation followed by two 31P acquisitions: one at rest to obtain metabolite maps of PCr and ATP, and one dynamic to assess PCr recovery kinetics and pH measurement after exercise. Subjects exercised on an in-house developed ergometer [25], and dual-tuned array with eight 31P receivers and an integrated eight-channel 1H module was used [26].
For the 31P imaging, we implemented a non-Cartesian pulse sequence, based on a Fermat looped, orthogonally encoded trajectories (FLORET) [27]. The method uses multiple rapid 3D center-out k-space sampling trajectories providing a short minimum acquisition delay. This approach has been shown to be efficient in terms of fast uniform sampling of the k-space and has been successfully applied for non-proton nuclei imaging [28, 29]. The pulse sequence was modified and imaging parameters were optimized for the specific aims of resting and dynamic 31P imaging, taking into account relatively long relaxation times and chemical shift dispersion of phosphorus metabolites.
MR Measurements of Resting Lower Leg Muscle
We acquired 2D 1H axial images using a gradient echo pulse sequence (field of view [FOV] = 400 mm; matrix size = 256×256; repetition time [TR] = 10 ms; echo time = 5.95 ms; flip angle = 5°; slice thickness = 6 mm; slab thickness = 25 cm; number of equidistant slices = 5; voxel size = 1.6×1.6×6 mm3, acquisition time = 35 s) that were used for manual segmentation of the gastrocnemius muscle.
Resting muscle images of PCr and α-ATP were acquired using a modified frequency selective 3D non-Cartesian FLORET sequence (Fig. 1a). The sequence uses spectrally selective Gaussian RF pulses for interleaved excitation of PCr and α-ATP resonances. During each TR, PCr is excited once, whereas α-ATP is excited twice to take advantage of its shorter T1 relaxation time [22]. The imaging parameters of the 31P-FLORET were as follows (for α-ATP/PCr): Gaussian pulse duration = 8/12 ms, TR = 1000/2000 ms, flip angle = 40°/40°. Acquisition of the signal started 1 ms after the end of the excitation pulse. Three-dimensional images were acquired with three hubs at 45°, and 10 interleaves/hub. The acquisition matrix size was 32×32×32, with an FOV of 550 mm isotropic, yielding 17-mm nominal isotropic resolution. Five signal averages of PCr, resulting in 10 signal averages for α-ATP, were acquired with a total acquisition time of 5 min. The α-ATP and PCr excitation pulses had a theoretical bandwidth of 220 and 140 Hz, respectively, which were experimentally confirmed to only excite a single peak of the 31P spectrum. Image reconstruction was performed using standard 3D regridding and density compensation [30, 31]. The signal from different coil arrays was combined using a commonly used sum-of-squares reconstruction method.
Figure 1.

Schematic pulse sequence diagram used for acquisition of a) resting α-ATP and PCr images (30 TRs used to form one image), and b) dynamic PCr images and Pi spectra (12 double spirals per image with TR = 500 ms resulting in 6-s effective temporal resolution).
Total PCr and ATP signals in the gastrocnemius muscle were obtained by segmenting the metabolic images with volumes of interest (VOIs) derived from 1H images. The PCr-to-ATP ratio was estimated and the concentration of PCr was determined after correcting for the Gaussian pulses duration, relaxation effects and other sequence delays, and assuming a constant ATP concentration of 8.1 mM [32].
31P-MR for Dynamic Imaging
Dynamic PCr images and inorganic phosphate (Pi) spectra were acquired during a rest/exercise/recovery paradigm using the 31P-FLORET sequence shown in Figure 1b. PCr excitation was performed using a 12-ms Gaussian pulse with a 25° flip angle. We acquired three hubs at 45°, 4 interleaves/hub with a TR of 500 ms. The dynamic scan consisted of 30 s of rest followed by 90 s of exercise and 4 min of rest for PCr recovery. PCr images had an FOV of 550 mm and were acquired and reconstructed on a 32×32×32 matrix size, which yielded 17-mm nominal isotropic resolution. The sampling efficiency of corresponding FLORET readout trajectories (undersampled by factor of 6) allowed the acquisition of dynamic PCr images with temporal resolution of 6 s. The relatively long T2 relaxation time of PCr at 3T (~ 300 ms) [33] allowed us to acquire two identical spiral readouts per excitation after rewinding the magnetization in order to improve SNR of PCr images. The acquisition time for each spiral was 34 ms. Applying a mask from 1H images, we calculated the total time-resolved PCr signal from the VOI (i.e. the gastrocnemius muscle) and subtracted estimated noise contribution based on the average signal noise outside the leg. The PCr recovery curve after exercise was normalized to the value at rest (by averaging the last five time points of the curve) and fitted to a monoexponential model [8]: PCr(t) = PCr0 + ΔPCr · (1 − exp(−t/τPCr)), resulting in three fitting parameters: normalized PCr signal at the end of exercise (PCr0), normalized PCr depletion (ΔPCr) and τPCr (in seconds). After PCr excitation and acquisition, we implemented a second frequency selective pulse to acquire unlocalized spectra of Pi within the same TR, which allowed us to extract pH information in the muscle (Figure 1b, first TR). The parameters for the free induction decay signal acquisition of the Pi resonance were as follows: Gaussian pulse duration = 12 ms; flip angle = 60°; TR = 6 s; spectral resolution = 2.5 Hz; and bandwidth = 2 kHz. The excitation pulses for PCr and Pi had a theoretical bandwidth of 140 Hz. At the beginning of each scan, we set the center frequency of the scanner to that of the PCr peak and defined a frequency offset for the excitation pulse of the Pi peak. Any shift of the Pi peak due to pH results in a change in the chemical shift offset between the reconstructed Pi peak and the center frequency. This allows quantification of the pH change. For the given pulse, we are able to measure chemical shift changes of the Pi peak up to 60 Hz, which corresponds to a pH drop of 0.9 compared with resting (i.e. pH of ~6.2) and is sufficient even when high intensity exercise is performed. Excitation of Pi using a 12-ms pulse did not result in any measurable excitation of PCr or γ-ATP. Spectral fitting was performed using a matching pursuit fitting algorithm [34]. We estimated the corresponding pH value based on the chemical shift of Pi relative to PCr as inputs to the modified Henderson-Hasselbalch equation [35]. To localize the pH value, we processed data independently for each coil and assigned it to a specific muscle group based on the coil proximity from co-registered 1H images. All offline reconstruction and quantification was implemented in MATLAB (MathWorks, Natick, Massachusetts, USA).
Exercise Paradigm
Participants were familiarized with the plantarflexor exercise procedure before the MRI scan. We determined their maximum voluntary isometric contraction (MVC) and set the resistance of our in-house developed ergometer to 40% MVC. During the pulse sequence development, a total of 19 subjects were scanned to determine the quality of fit for the estimation of τPCr. In a subset of nine subjects, a standardized exercise protocol was performed, which consisted of 90 s of plantar flexion following a metronome at 40 beats per minute. The mechanical mean power output during plantar flexion was estimated based on angular displacement of the ergometer pedal, which was monitored by an angle sensor, and the force generated by the sum of elastic bands that resisted motion [25].
RESULTS
We tested the quality of our imaging data on 19 subjects who performed plantar flexion inside the magnet in terms of the statistical coefficient of determination (r2) for the estimation of ΔPCr and τPCr from the PCr recovery curve after exercise. The coefficient of determination for images reconstructed using only the first spiral (r12) was 0.81 ± 0.10 (mean ± standard deviation), which improved to 0.89 ± 0.05 when images using both spirals were averaged (r22). This is a direct result of the SNR improvement from averaging the two spirals, which increased from 19.9 ± 3.9 for one spiral to 25.9 ± 6.5 for two spirals. Dynamic PCr image SNR was defined as the ratio between the mean PCr signal in the selected VOI and the standard deviation of the signal in the same VOI (10 single images at the end of PCr recovery were used). To achieve sufficiently high temporal resolution to accurately characterize τPCr,31P-FLORET images were undersampled (by a factor of 6 below the Nyquist limit). As a result, the actual resolution of 28 mm (defined as FWHM of the point spread function) is coarser compared with the nominal (17 mm). A simulation of the corresponding point spread function magnitude is shown in 1D (Fig. 2a) and 2D (Fig. 2b) plots. The major side lobe was estimated at ~ 13% of the main peak.
Figure 2.
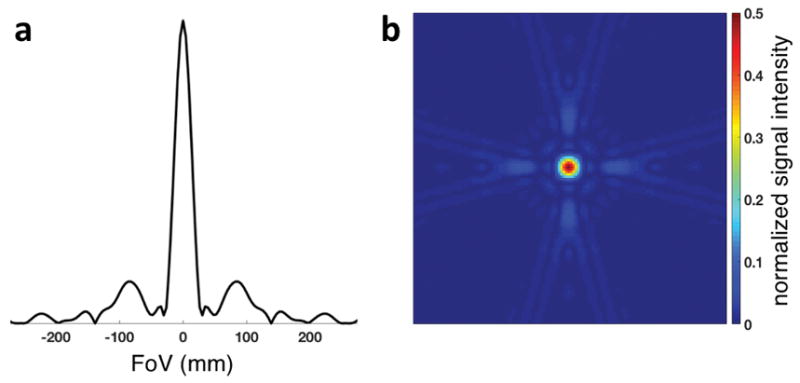
1D plot (a) and 2D map (b) of the theoretically estimated magnitude of the point spread function of the described 3D dynamic PCr imaging pulse sequence. The scale of the 2D map is limited at 50% of the maximum signal intensity to emphasize the full-width half-maximum.
The metabolic parameters in nine subjects that performed the standardized exercise protocol were as follows: ΔPCr = 48.8 % ± 15.2 % (minimum/maximum = 32.2%/73.4 %) and τPCr = 22.9 ± 8.8 s (minimum/maximum = 15.1/40.3 s). We did not observe acidification (pH < 6.88) in any of the nine subjects, with pH values at the end of exercise between 6.9 and 7.1. The concentration of PCr at rest was estimated from the ratio of PCr-to-α-ATP at 34.3 ± 0.9 mM (minimum/maximum = 33.4/36.1 mM), with SNR of PCr and α-ATP, in the same VOI as in the dynamic PCr images, of 56.8 ± 6.6 and 19.8 ± 2.2, respectively. Exemplary PCr and α-ATP images in the resting state are shown in Figure 3. The mechanical work was 3.38 ± 0.87 W (minimum/maximum = 2.03/4.21 W). These results are summarized in Table 1.
Figure 3.

Exemplary resting 1H GRE (a), PCr (b) and α-ATP (c) images with manually segmented VOI of the gastrocnemius muscle (yellow line) based on the 1H image. PCr and α-ATP images were acquired using five and 10 signal averages, respectively, with a total acquisition time of 5 min.
Table 1.
Summarized quantitative data obtained from nine healthy volunteers following the standardized exercise protocol.
| Mean value ± SD | Min / Max | |
|---|---|---|
| Age (y) | 32.9 ± 6.3 | 25.0 / 44.0 |
| Body mass index (kg/m2) | 23.4 ± 4.4 | 19.2 / 32.3 |
| Power output (W) | 3.38 ± 0.87 | 2.03 / 4.21 |
| PCr/ATP ratio | 4.23 ± 0.11 | 4.13 / 4.45 |
| [PCr] at rest (mM) | 34.3 ± 0.9 | 33.4 / 36.1 |
| Depletion ΔPCr (%) | 48.8 ± 15.2 | 32.2 / 73.4 |
| Recovery rate τPCr (s) | 22.9 ± 8.8 | 15.1 / 40.3 |
| r12* (one spiral readout) | 0.81 ± 0.10 | 0.62 / 0.92 |
| r22*( two spiral readouts) | 0.89 ± 0.05 | 0.82 / 0.96 |
Statistical coefficients of determination of fits (r2) are shown for cases of PCr signal reconstructed using one and two spiral readouts (* including additional 10 datasets from non-standardized exercise protocol). PCr depletion and recovery rates were estimated using two spiral readouts.
Figure 4 shows exemplary data of PCr images (reconstructed on a 64×64×64 matrix size for visualization purposes) and time courses of PCr signal and pH in the gastrocnemius muscle. Single average PCr images at two time points at rest (t = 24 s) and after exercise (t = 120 s) are presented. The continuous pH reduction after exercise is consistent with recently reported findings [12]. In our approach, we incorporate a spectrally selective Gaussian pulse to excite the Pi resonance (12 ms duration). Due to the long duration of the pulse, Pi signal experiences dephasing, which results in approximately 30% signal loss compared with a short (1-ms) nonselective excitation pulse. The linewidth of the Pi peak was approximately 10 Hz throughout the experiment (i.e., rest, exercise, and recovery). In all cases, pH was estimated using single posterior coil element located adjacent to the gastrocnemius muscles as shown in Figure 4.
Figure 4.

1H GRE (a) and dynamic single-average PCr images of lower leg muscle before (b) and after (c) exercise (at 24 s and 120 s, respectively) with corresponding pH values (d) and PCr signal time courses (e) from the gastrocnemius muscle (yellow lines). Schematic of eight 31P coils is shown in 1H image with dashed loop assigned to Pi signal from the gastrocnemius muscle for pH estimation. [PCr] time course also shows the result of monoexponential PCr recovery fit, resulting in recovery time constant of 40.3 s (r2 = 0.94).
DISCUSSION AND CONCLUSIONS
In this study we developed a new method for improved resting and dynamic 3D 31P imaging at 3T. The technique is capable of acquiring temporal and spatial resolved data adequate for muscle segmentation and postexercise PCr recovery quantification, while also providing information about muscle acidification. We used the method successfully in a group of 19 healthy volunteers.
Our method is a 3D imaging technique capable of measuring PCr kinetics in several muscle groups of the lower leg at a temporal resolution of 6 s, including the soleus, as well as the two subgroups (medial and lateral) of the gastrocnemius muscle. To recruit the soleus muscle, the subject would be required to perform plantar flexions with their knee partially flexed as has been shown previously [36]. Given the location of the soleus and the sensitivity profile of our coil array [26], we expect a ~ 40% SNR drop in some voxels in the soleus compared with the gastrocnemius muscle. By introducing additional noise to our existing data, we estimated that data fitting would have coefficient of determination (r2) between 0.7 and 0.8, which as expected is lower than that reported for the gastrocnemius muscle (0.89 ± 0.05). In our study, we performed fitting in VOI selected in the medial gastrocnemius, and lateral gastrocnemius. The r2 in the medial gastrocnemius was ~0.8, while in the lateral gastrocnemius it was ~0.75, due to a smaller VOI.
After submaximal exercise in young adults, τPCr is typically in the range of ~ 20–30 s. Therefore, along with the SNR, temporal resolution is crucial for accurate estimation of the kinetics of PCr resynthesis. Our imaging method yields temporal resolution of 6 s, which is comparable with unlocalized spectroscopic methods reported at 3T [37, 38]. The mean coefficient of determination using our method (r22 = 0.89) was improved compared to the previously mentioned studies using unlocalized 31P MRS. Our results, as summarized in Table 1, are in close agreement with those published previously in terms of PCr concentration [32], τPCr [11, 39, 40] and post-exercise pH [12].
To achieve 6 s temporal resolution, 31P-FLORET images were undersampled and reconstructed with 17-mm isotropic resolution (4.9 cm3), which was much smaller than the gastrocnemius muscle volume (~200 cm3) [41] and therefore allowed segmentation with inconsequential partial volume effects. However, the spatial blurring due to the data undersampling leads to the signal contribution of the neighboring voxels of adjoining muscle groups into the segmented VOI and, as result, might affect the specificity of the PCr recovery quantification. The described pulse sequence additionally allowed acquisition of Pi spectra for pH quantification, which were localized using sensitivity profiles of individual coil elements. This might cause a discrepancy between PCr imaging and pH muscle assignment due to different effective spatial resolutions. Although 31P-MRI with pH measurement has been described previously on 7T devices [42], we are not aware of such imaging methods with acceptable temporal resolution and volume coverage on the more widely available 3T scanner. In the GRE method implemented by Schmid et al. [42], pH values can be derived from the chemical shift induced phase differences between PCr and Pi resonances. However, there is no direct relationship between chemical shift and phase in the reconstructed images using the FLORET method.
The assessment of PCr depletion required a noise distribution estimation, which was subsequently subtracted from the acquired PCr signal. It is reasonable to expect error propagation in the estimation of all three fitted parameters, including τPCr. To investigate this, we performed fitting in the VOI with and without noise subtraction. Differences in estimated τPCr using the two methods were negligible. A maximum of 5% difference was found in the estimation of ΔPCr. Further analysis would be required for segmented smaller VOIs with lower SNR.
The low concentration of Pi at rest (~ 4 mM) [32], together with the use of a long (12 ms) excitation pulse, prevented accurate estimation of resting muscle pH. This information can be obtained by increasing the number of measurements before exercise and averaging the signal, but would result in a longer acquisition time. We decided not to acquire such data, because only muscle acidification during recovery affects the PCr resynthesis kinetics. Immediately after exercise, Pi signal was sufficiently high in order for the chemical shift displacement between PCr and Pi to be measured and the local pH to be estimated. Due to the motion during exercise, the position of the subject might change resulting in frequency drifts and, therefore, affecting the pH quantification. In our preliminary exercise tests, we acquired full phosphorus spectra using a standard free induction decay pulse sequence and estimated the maximum frequency drift at less than 4 Hz, which corresponds to the uncertainty in pH estimation of ~ 0.05. Given the 140 Hz bandwidth of the Gaussian pulse for Pi excitation, it is expected to cause a weak excitation of phosphomonoesters and phosphodiesters peaks. However, due to the low concentration of phosphomonoesters and phosphodiesters in the calf muscle, we did not observe these peaks in the acquired spectra.
To estimate PCr concentration at rest, we acquired a PCr-to-ATP ratio using a separate 5-min acquisition with longer TR, higher flip angle, and increased number of interleaves per hub. Acquiring ATP information would be also possible by modifying the dynamic 31P sequence in Figure 1, and adding excitation and acquisition of the α-ATP resonance. However, we decided to acquire these data separately with optimized imaging parameters that improved SNR, reduced the undersampling, and, therefore, increased the accuracy of the PCr-to-ATP ratio measurement. PCr and ATP images were reconstructed using the sum-of-squares method without taking into account coil sensitivities and the B1+ profile of our coil. This is a limitation of our study, which can be solved using efficient B1 mapping methods for 31P-MR [43, 44].
In conclusion, we report an imaging method to measure localized PCr resynthesis and pH changes in muscles of the lower leg after exercise at 3T with a temporal resolution comparable to that of single voxel MRS sequences. The ability to perform quantitative 31P-MRI at 3T will allow us to combine this method with other clinically established 1H imaging methods, such as IDEAL water–fat separation [45], arterial spin labeling or post exercise blood oxygenation level-dependent imaging, which can potentially provide new insights into vasculature function and metabolic activity in muscles.
Acknowledgments
The authors thank Jerzy Walczyk for helping the team with the construction of the ergometer and the coil housing. Ryan Brown discloses the US patent, “Multi-Channel Coil Arrangement” 13/866,728,2013, which is related to this work. This work was supported in part by NIH grants R01DK106292, R03AR065763, R01NS097494, and was performed under the rubric of the Center for Advanced Imaging Innovation and Research (CAI2R, www.cai2r.net), a NIBIB Biomedical Technology Resource Center (NIH P41 EB017183).
References
- 1.Taivassalo T, Shoubridge EA, Chen J, Kennaway NG, DiMauro S, Arnold DL, Haller RG. Aerobic conditioning in patients with mitochondrial myopathies: physiological, biochemical, and genetic effects. Ann Neurol. 2001;50(2):133–141. doi: 10.1002/ana.1050. [DOI] [PubMed] [Google Scholar]
- 2.Crowther GJ, Milstein JM, Jubrias SA, Kushmerick MJ, Gronka RK, Conley KE. Altered energetic properties in skeletal muscle of men with well-controlled insulin-dependent (type 1) diabetes. Am J Physiol Endocrinol Metab. 2003;284(4):E655–E662. doi: 10.1152/ajpendo.00343.2002. [DOI] [PubMed] [Google Scholar]
- 3.Isbell DC, Berr SS, Toledano AY, Epstein FH, Meyer CH, Rogers WJ, Harthun NL, Hagspiel KD, Weltman A, Kramer CM. Delayed calf muscle phosphocreatine recovery after exercise identifies peripheral arterial disease. J Am Coll Cardiol. 2006;47(11):2289–2295. doi: 10.1016/j.jacc.2005.12.069. [DOI] [PMC free article] [PubMed] [Google Scholar]
- 4.Keller U, Oberhansli R, Huber P, Widmer LK, Aue WP, Hassink RI, Muller S, Seelig J. Phosphocreatine content and intracellular pH of calf muscle measured by phosporus NMR spectroscopy in occlusive arterial disease of the legs. Eur J Clin Invest. 1985;15(6):382–388. doi: 10.1111/j.1365-2362.1985.tb00289.x. [DOI] [PubMed] [Google Scholar]
- 5.Chance B, Eleff S, Leigh J. Noninvasive, nondestructive approaches to cell bioenergetics. Proc Natl Acad Sci USA. 1980;77(12):7430–7434. doi: 10.1073/pnas.77.12.7430. [DOI] [PMC free article] [PubMed] [Google Scholar]
- 6.Chance B, Eleff S, Bank W, Leigh JS, Warnell R. 31P NMR-studies of control of mitochondrial-function in phosphofructokinase-deficient human skeletal muscle. Proc Natl Acad Sci USA. 1982;79(24):7714–7718. doi: 10.1073/pnas.79.24.7714. [DOI] [PMC free article] [PubMed] [Google Scholar]
- 7.Prompers JJ, Wessels B, Kemp GJ, Nicolay K. MITOCHONDRIA: investigation of in vivo muscle mitochondrial function by 31P magnetic resonance spectroscopy. Int J Biochem Cell Biol. 2014;50:67–72. doi: 10.1016/j.biocel.2014.02.014. [DOI] [PubMed] [Google Scholar]
- 8.Kemp GJ, Roberts N, Bimson WE, Bakran A, Frostick SP. Muscle oxygenation and ATP turnover when blood flow is impaired by vascular disease. Spectroscopy. 2002;16(3, 4):317–334. doi: 10.1023/a:1020325812680. [DOI] [PubMed] [Google Scholar]
- 9.Kemp GJ, Crowe AV, Anijeet HK, Gong QY, Bimson WE, Frostick SP, Bone JM, Bell GM, Roberts JN. Abnormal mitochondrial function and muscle wasting, but normal contractile efficiency, in haemodialysed patients studied non-invasively in vivo. Nephrol Dial Transplant. 2004;19(6):1520–1527. doi: 10.1093/ndt/gfh189. [DOI] [PubMed] [Google Scholar]
- 10.Prompers JJ, Jeneson JAL, Drost MR, Oomens CCW, Strijkers GJ, Nicolay K. Dynamic MRS and MRI of skeletal muscle function and biomechanics. NMR Biomed. 2006;19(7):927–953. doi: 10.1002/nbm.1095. [DOI] [PubMed] [Google Scholar]
- 11.Meyerspeer M, Robinson S, Nabuurs CI, Scheenen T, Schoisengeier A, Unger E, Kemp GJ, Moser E. Comparing localized and nonlocalized dynamic 31P magnetic resonance spectroscopy in exercising muscle at 7T. Magn Reson Med. 2012;68(6):1713–1723. doi: 10.1002/mrm.24205. [DOI] [PMC free article] [PubMed] [Google Scholar]
- 12.Fiedler GB, Schmid AI, Goluch S, Schewzow K, Laistler E, Niess F, Unger E, Wolzt M, Mirzahosseini A, Kemp GJ, Moser E, Meyerspeer M. Skeletal muscle ATP synthesis and cellular H+ handling measured by localized 31P-MRS during exercise and recovery. Sci Rep. 2016;6:32037. doi: 10.1038/srep32037. [DOI] [PMC free article] [PubMed] [Google Scholar]
- 13.Valkovič L, Chmelík M, Just Kukurová I, Jakubová M, Kipfelsberger MC, Krumpolec P, Tušek Jelenc M, Bogner W, Meyerspeer M, Ukropec J. Depth-resolved surface coil MRS (DRESS)-localized dynamic 31P-MRS of the exercising human gastrocnemius muscle at 7 T. NMR Biomed. 2014;27(11):1346–1352. doi: 10.1002/nbm.3196. [DOI] [PubMed] [Google Scholar]
- 14.Oberbach A, Bossenz Y, Lehmann S, Niebauer J, Adams V, Paschke R, Schon MR, Bluher M, Punkt K. Altered fiber distribution and fiber-specific glycolytic and oxidative enzyme activity in skeletal muscle of patients with type 2 diabetes. Diabetes Care. 2006;29(4):895–900. doi: 10.2337/diacare.29.04.06.dc05-1854. [DOI] [PubMed] [Google Scholar]
- 15.Suzuki E, Kashiwagi A, Hidaka H, Maegawa H, Nishio Y, Kojima H, Haneda M, Yasuda H, Morikawa S, Inubushi T, Kikkawa R. 1H and 31P magnetic resonance spectroscopy and imaging as a new diagnostic tool to evaluate neuropathic foot ulcers in Type II diabetic patients. Diabetologia. 2000;43(2):165–172. doi: 10.1007/s001250050025. [DOI] [PubMed] [Google Scholar]
- 16.Brown TR, Kincaid BM, Ugurbil K. NMR chemical-shift imaging in 3 dimensions. Proc Natl Acad Sci USA. 1982;79(11):3523–3526. doi: 10.1073/pnas.79.11.3523. [DOI] [PMC free article] [PubMed] [Google Scholar]
- 17.Fiedler GB, Meyerspeer M, Schmid AI, Goluch S, Schewzow K, Laistler E, Mirzahosseini A, Niess F, Unger E, Wolzt M, Moser E. Localized semi-LASER dynamic 31P magnetic resonance spectroscopy of the soleus during and following exercise at 7 T. Magn Reson Mater Phy. 2015;28(5):493–501. doi: 10.1007/s10334-015-0484-5. [DOI] [PMC free article] [PubMed] [Google Scholar]
- 18.Valkovič L, Chmelík M, Meyerspeer M, Gagoski B, Rodgers CT, Krššák M, Andronesi OC, Trattnig S, Bogner W. Dynamic 31P–MRSI using spiral spectroscopic imaging can map mitochondrial capacity in muscles of the human calf during plantar flexion exercise at 7 T. NMR Biomed. 2016;29(12):1825–1834. doi: 10.1002/nbm.3662. [DOI] [PMC free article] [PubMed] [Google Scholar]
- 19.Parasoglou P, Xia D, Chang G, Convit A, Regatte RR. Three-dimensional mapping of the creatine kinase enzyme reaction rate in muscles of the lower leg. NMR Biomed. 2013;26(9):1142–1151. doi: 10.1002/nbm.2928. [DOI] [PMC free article] [PubMed] [Google Scholar]
- 20.Parasoglou P, Feng L, Xia D, Otazo R, Regatte RR. Rapid 3D-imaging of phosphocreatine recovery kinetics in the human lower leg muscles with compressed sensing. Magn Reson Med. 2012;68(6):1738–1746. doi: 10.1002/mrm.24484. [DOI] [PMC free article] [PubMed] [Google Scholar]
- 21.Parasoglou P, Xia D, Chang G, Regatte RR. 3D-mapping of phosphocreatine concentration in the human calf muscle at 7 T: Comparison to 3 T. Magn Reson Med. 2013;70(6):1619–1625. doi: 10.1002/mrm.24616. [DOI] [PMC free article] [PubMed] [Google Scholar]
- 22.Bogner W, Chmelik M, Schmid AI, Moser E, Trattnig S, Gruber S. Assessment of 31P Relaxation Times in the Human Calf Muscle: A Comparison between 3 T and 7 T In Vivo. Magn Reson Med. 2009;62(3):574–582. doi: 10.1002/mrm.22057. [DOI] [PubMed] [Google Scholar]
- 23.Noseworthy MD, Bulte DP, Alfonsi J. BOLD magnetic resonance imaging of skeletal muscle. Semin Musculoskelet Radiol. 2003;7(4):307–15. doi: 10.1055/s-2004-815678. [DOI] [PubMed] [Google Scholar]
- 24.West AM, Meyer CH, Epstein FH, Jiji R, Hunter JR, DiMaria JM, Christopher JM, Kramer CM. Arterial spin labeling MRI reproducibly measures peak-exercise calf muscle perfusion in healthy volunteers and patients with peripheral arterial disease. JACC Cardiovasc Imaging. 2012;5(12):1224. doi: 10.1016/j.jcmg.2012.03.022. [DOI] [PMC free article] [PubMed] [Google Scholar]
- 25.Naimon ND, Walczyk J, Babb JS, Khegai O, Che X, Alon L, Regatte RR, Brown R, Parasoglou P. A low-cost Mr compatible ergometer to assess post-exercise phosphocreatine recovery kinetics. Magn Reson Mater Phy. 2017 doi: 10.1007/s10334-016-0605-9. [DOI] [PMC free article] [PubMed] [Google Scholar]
- 26.Brown R, Khegai O, Parasoglou P. Magnetic Resonance Imaging of Phosphocreatine and Determination of BOLD Kinetics in Lower Extremity Muscles using a Dual-Frequency Coil Array. Sci Rep. 2016;6:30568. doi: 10.1038/srep30568. [DOI] [PMC free article] [PubMed] [Google Scholar]
- 27.Pipe JG, Zwart NR, Aboussouan EA, Robison RK, Devaraj A, Johnson KO. A new design and rationale for 3D orthogonally oversampled k-space trajectories. Magn Reson Med. 2011;66(5):1303–11. doi: 10.1002/mrm.22918. [DOI] [PubMed] [Google Scholar]
- 28.Madelin G, Babb J, Xia D, Regatte RR. Repeatability of Quantitative Sodium Magnetic Resonance Imaging for Estimating Pseudo-Intracellular Sodium Concentration and Pseudo-Extracellular Volume Fraction in Brain at 3 T. PloS One. 2015;10(3):e0118692. doi: 10.1371/journal.pone.0118692. [DOI] [PMC free article] [PubMed] [Google Scholar]
- 29.Madelin G, Kline R, Walvick R, Regatte RR. A method for estimating intracellular sodium concentration and extracellular volume fraction in brain in vivo using sodium magnetic resonance imaging. Sci Rep. 2014;4:4763. doi: 10.1038/srep04763. [DOI] [PMC free article] [PubMed] [Google Scholar]
- 30.Schomberg H, Timmer J. The gridding method for image reconstruction by Fourier transformation. IEEE Trans Med Imaging. 1995;14(3):596–607. doi: 10.1109/42.414625. [DOI] [PubMed] [Google Scholar]
- 31.Pipe JG, Menon P. Sampling density compensation in MRI: rationale and an iterative numerical solution. Magn Reson Med. 1999;41(1):179–186. doi: 10.1002/(sici)1522-2594(199901)41:1<179::aid-mrm25>3.0.co;2-v. [DOI] [PubMed] [Google Scholar]
- 32.Kemp GJ, Meyerspeer M, Moser E. Absolute quantification of phosphorus metabolite concentrations in human muscle in vivo by 31P MRS: a quantitative review. NMR Biomed. 2007;20(6):555–565. doi: 10.1002/nbm.1192. [DOI] [PubMed] [Google Scholar]
- 33.Meyerspeer M, Krššák M, Moser E. Relaxation times of 31P-metabolites in human calf muscle at 3 T. Magn Reson Med. 2003;49(4):620–625. doi: 10.1002/mrm.10426. [DOI] [PubMed] [Google Scholar]
- 34.Khegai O, Schulte RF, Janich MA, Menzel MI, Farrell E, Otto AM, Ardenkjaer-Larsen JH, Glaser SJ, Haase A, Schwaiger M, Wiesinger F. Apparent rate constant mapping using hyperpolarized [1–13C]pyruvate. NMR Biomed. 2014;27(10):1256–1265. doi: 10.1002/nbm.3174. [DOI] [PubMed] [Google Scholar]
- 35.Taylor D, Bore P, Styles P, Gadian D, Radda G. Bioenergetics of intact human muscle. A 31P nuclear magnetic resonance study. Mol Biol Med. 1983;1(1):77–94. [PubMed] [Google Scholar]
- 36.Price TB, Kamen G, Damon BM, Knight CA, Applegate B, Gore JC, Eward K, Signorile JF. Comparison of MRI with EMG to study muscle activity associated with dynamic plantar flexion. Magn Reson Imaging. 2003;21(8):853–861. doi: 10.1016/s0730-725x(03)00183-8. [DOI] [PubMed] [Google Scholar]
- 37.Layec G, Bringard A, Le Fur Y, Vilmen C, Micallef J-P, Perrey S, Cozzone PJ, Bendahan D. Reproducibility Assessment of Metabolic Variables Characterizing Muscle Energetics In Vivo: A P-31-MRS Study. Magn Reson Med. 2009;62(4):840–854. doi: 10.1002/mrm.22085. [DOI] [PubMed] [Google Scholar]
- 38.Šedivý P, Kipfelsberger MC, Dezortová M, Krššák M, Drobný M, Chmelík M, Rydlo J, Trattnig S, Hájek M, Valkovič L. Dynamic 31P MR spectroscopy of plantar flexion: Influence of ergometer design, magnetic field strength (3 and 7 T), and RF-coil design. Med Phys. 2015;42(4):1678–1689. doi: 10.1118/1.4914448. [DOI] [PubMed] [Google Scholar]
- 39.Greenman RL, Smithline HA. The Feasibility of Measuring Phosphocreatine Recovery Kinetics in Muscle Using a Single-shot 31P RARE MRI Sequence. Acad Radiol. 2011;18(7):917–923. doi: 10.1016/j.acra.2011.02.014. [DOI] [PMC free article] [PubMed] [Google Scholar]
- 40.Parasoglou P, Xia D, Chang G, Regatte RR. Dynamic three-dimensional imaging of phosphocreatine recovery kinetics in the human lower leg muscles at 3T and 7T: a preliminary study. NMR Biomed. 2013;26(3):348–356. doi: 10.1002/nbm.2866. [DOI] [PMC free article] [PubMed] [Google Scholar]
- 41.Bandholm T, Sonne-Holm S, Thomsen C, Bencke J, Pedersen SA, Jensen BR. Calf Muscle Volume Estimates: Implications for Botulinum Toxin Treatment? Pediatr Neurol. 2007;37(4):263–269. doi: 10.1016/j.pediatrneurol.2007.05.019. [DOI] [PubMed] [Google Scholar]
- 42.Schmid AI, Meyerspeer M, Robinson SD, Goluch S, Wolzt M, Fiedler GB, Bogner W, Laistler E, Krššák M, Moser E, Trattnig S, Valkovič L. Dynamic PCr and pH imaging of human calf muscles during exercise and recovery using 31P gradient-Echo MRI at 7 Tesla. Magn Reson Med. 2016;75:2324–2331. doi: 10.1002/mrm.25822. [DOI] [PubMed] [Google Scholar]
- 43.Chmelík M, Považan M, Jírů F, Kukurová IJ, Dezortová M, Krššák M, Bogner W, Hájek M, Trattnig S, Valkovič L. Flip-angle mapping of 31P coils by steady-state MR spectroscopic imaging. J Magn Reson Imaging. 2014;40(2):391–397. doi: 10.1002/jmri.24401. [DOI] [PubMed] [Google Scholar]
- 44.Clarke WT, Robson MD, Rodgers CT. Bloch-Siegert B1+-mapping for human cardiac 31P-MRS at 7 Tesla. Magn Reson Med. 2016;76:1047–1058. doi: 10.1002/mrm.26005. [DOI] [PMC free article] [PubMed] [Google Scholar]
- 45.Reeder SB, McKenzie CA, Pineda AR, Yu H, Shimakawa A, Brau AC, Hargreaves BA, Gold GE, Brittain JH. Water–fat separation with IDEAL gradient-echo imaging. J Magn Reson Imaging. 2007;25(3):644–652. doi: 10.1002/jmri.20831. [DOI] [PubMed] [Google Scholar]