Abstract
Key points
In two monogenic models of absence epilepsy, interictal beta/gamma power is augmented in homozygous stargazer (stg/stg) but not homozygous tottering (tg/tg) mice.
There are distinct gene‐linked patterns of aberrant phase–amplitude coupling in the interictal EEG of both stg/stg and tg/tg mice, compared to +/+ and stg/+ mice.
Treatment with ethosuximide significantly blocks seizures in both genotypes, but the abnormal phase–amplitude coupling remains.
Seizure‐free stg/+ mice have normal power and phase–amplitude coupling, but beta/gamma power is significantly reduced with NMDA receptor blockade, revealing a latent cortical network phenotype that is separable from, and therefore not a result of, seizures.
Altogether, these findings reveal gene‐linked quantitative electrographic biomarkers free from epileptiform activity, and provide a potential network correlate for persistent cognitive deficits in absence epilepsy despite effective treatment.
Abstract
In childhood absence epilepsy, cortical seizures are brief and intermittent; however there are extended periods without behavioural or electrographic ictal events. This genetic disorder is associated with variable degrees of cognitive dysfunction, but no consistent functional biomarkers that might provide insight into interictal cortical function have been described. Previous work in monogenic mouse models of absence epilepsy have shown that the interictal EEG displays augmented beta/gamma power in homozygous stargazer (stg/stg) mice bearing a presynaptic AMPA receptor defect, but not homozygous tottering (tg/tg) mice with a P/Q type calcium channel mutation. To further evaluate the interictal EEG, we quantified phase–amplitude coupling (PAC) in stg/stg, stg/+, tg/tg and wild‐type (+/+) mice. We found distinct gene‐linked patterns of aberrant PAC in stg/stg and tg/tg mice compared to +/+ and stg/+ mice. Treatment with ethosuximide significantly blocks seizures in both stg/stg and tg/tg, but the abnormal PAC remains. Stg/+ mice are seizure free with normal baseline beta/gamma power and normal theta‐gamma PAC, but like stg/stg mice, beta/gamma power is significantly reduced by NMDA receptor blockade, a treatment that paradoxically enhances seizures in stg/stg mice. Stg/+ mice, therefore, have a latent cortical network phenotype that is veiled by NMDA‐mediated neurotransmission. Altogether, these findings reveal gene‐linked quantitative electrographic biomarkers in the absence of epileptiform activity and provide a potential network correlate for persistent cognitive deficits in absence epilepsy despite effective treatment.
Keywords: comodulogram, stargazer, tottering
Key points
In two monogenic models of absence epilepsy, interictal beta/gamma power is augmented in homozygous stargazer (stg/stg) but not homozygous tottering (tg/tg) mice.
There are distinct gene‐linked patterns of aberrant phase–amplitude coupling in the interictal EEG of both stg/stg and tg/tg mice, compared to +/+ and stg/+ mice.
Treatment with ethosuximide significantly blocks seizures in both genotypes, but the abnormal phase–amplitude coupling remains.
Seizure‐free stg/+ mice have normal power and phase–amplitude coupling, but beta/gamma power is significantly reduced with NMDA receptor blockade, revealing a latent cortical network phenotype that is separable from, and therefore not a result of, seizures.
Altogether, these findings reveal gene‐linked quantitative electrographic biomarkers free from epileptiform activity, and provide a potential network correlate for persistent cognitive deficits in absence epilepsy despite effective treatment.
Abbreviations
- MDS
multidimensional scaling
- MI
modulation index
- PAC
phase–amplitude coupling
- PLV
phase‐locking value
Introduction
Childhood absence epilepsy is a genetic seizure disorder characterized by frequent spontaneous episodes of behavioural arrest associated with generalized spike‐wave discharges in the electroencephalogram (EEG). Some patients with absence epilepsy also have neurocognitive deficits that are known to persist despite effective pharmacological seizure treatment (Masur et al. 2013). This suggests that genetic mutations responsible for the epileptic phenotype may also be independently responsible for cognitive deficits even without the presence of seizures. Therefore, even though the interictal EEG is generally considered to appear clinically normal, closer examination beyond standard electrographic markers may yield abnormalities that serve as biomarkers for underlying gene‐linked cortical dysfunction. For example, augmented high frequency oscillations have been reported in patients with childhood absence epilepsy using magnetoencephalography (Xiang et al. 2014).
The homozygous stargazer (stg/stg) and tottering (tg/tg) mouse models of absence epilepsy are due to distinct monogenic mutations. stg/stg mice bear a mutation in Cacng2 leading to AMPA receptor trafficking dysfunction in a subset of inhibitory neurons (Noebels et al. 1990; Barad et al. 2012; Maheshwari et al. 2013), and a mutation in the tg/tg gene Cacna1a impairs neurotransmitter release within the thalamocortical circuit (Noebels & Sidman, 1979; Rossignol et al. 2013; Bomben et al. 2016). We have previously found that stg/stg mice have significantly elevated interictal beta and gamma power, in contrast to tg/tg mice, which have normal power across frequencies between 2 and 300 Hz (Maheshwari et al. 2016). Therefore, a simple change in baseline EEG power alone is not a uniform finding in absence epilepsy and therefore may not selectively reflect genetic dysfunction or the potential neurocognitive deficits experienced by patients with absence epilepsy.
Another potential EEG biomarker of circuit level dynamics is cross‐frequency coupling (Canolty & Knight, 2010). One common type of cross‐frequency coupling is phase–amplitude coupling (PAC) where the phase of a slower oscillation is correlated with the amplitude of a faster oscillation. The magnitude of PAC represents the putative interactions between underlying circuits which behave abnormally in models of focal epilepsy (Guirgis et al. 2015; Amiri et al. 2016; Edakawa et al. 2016), but has not yet been evaluated in generalized epilepsies. Critically, PAC is a potentially useful metric as the correlation between different oscillatory EEG components may vary without overt changes in the power spectrum, and can therefore uniquely differ for similar power spectra. Here we examine the relationship between genetic mutations, absence epilepsy and PAC in the interictal EEG. We show that even in the absence of epileptiform activity, there are reproducible electrographic biomarkers of genetic dysfunction.
Methods
Ethical approval
Experiments were carried out according to the guidelines laid down by the Baylor Institutional Animal Care and Use Committee (IACUC) and conform to the principles and regulations of The Journal of Physiology (Grundy, 2015). Mice were adult (> 6 weeks old) homozygous stargazer (stg/stg) and tottering (tg/tg) mutants, heterozygous stargazer mice (stg/+), and wild‐type (+/+) mice of either sex, originally obtained from The Jackson Laboratory (Bar Harbor, Maine) and maintained on a C57BL6/J background for over 10 generations. Genotypes were confirmed by PCR of tail DNA (Burgess & Noebels, 1999). For electrode implantation, mice were anaesthetized by tribromoethanol (Avertin; 20 μl g−1 i.p.) or isoflurane (2–4% in O2) anaesthesia and surgically implanted with silver wire electrodes (0.127 mm diameter) inserted into the epidural space over the somatosensory cortex (1 mm posterior and 3 mm lateral to bregma) bilaterally through cranial burr holes and attached to a microminiature connector cemented to the skull. The reference electrode was placed over the right frontal lobe (1 mm anterior and 1 mm lateral to bregma) and the ground electrode was placed over the left frontal lobe. Mice were allowed to recover for at least 2 weeks prior to recording. Access to food and water was available ad libitum. If necessary, mice were euthanized by CO2 inhalation using an automated CO2 delivery system (SmartBox, Euthanex, Palmer, PA, USA).
Video‐EEG data recording
EEG and behavioural activity in freely moving mice were recorded using simultaneous video‐EEG monitoring (Harmonie software version 6.1c, Stellate Systems, Natus Medical, Pleasanton, CA, USA). All in vivo experiments were performed between 12.00 and 15.00 h to prevent confounding diurnal variation (Smyk et al. 2011). EEG signals were sampled at 2 kHz with an anti‐aliasing filter. Prior to recording, mice were allowed to acclimate to the recording environment for 30 min, and video‐EEG was then collected for a 30 min sampling period (the baseline period for both power and PAC analysis), followed by intraperitoneal drug injection. Drug effect was analysed between 30 and 60 min after drug administration.
Video‐EEG data pre‐processing
Investigators were blinded to genotype and drug administered prior to data analysis. EEG data were then screened for seizure activity under the supervision of a board‐certified epileptologist (A.M.). Seizures were defined by episodes of bilateral spike and wave discharges with amplitude greater than or equal to 1.5× baseline voltage and concomitant video‐recorded behavioural arrest. EEGs were reviewed without knowledge of genotype or treatment, and any recording artefacts were removed from analysis. Since the power of high frequency oscillations may be falsely measured when there are sharp electrographic contours (Kramer et al. 2008; Scheffer‐Teixeira et al. 2013), identified seizure episodes were digitally extracted in EEGLab (Delorme & Makeig, 2004) to allow evaluation of only interictal activity periods. Raw data were notch filtered with a 1 Hz window around 60, 120 and 180 Hz using EEGLab (Delorme & Makeig, 2004) in MATLAB (Mathworks, Inc., Natick, MA, USA).
Phase–amplitude coupling analysis
PAC analyses were performed in EEGLab (Delorme & Makeig, 2004), Brainstorm (Tadel et al. 2011) and custom routines (MATLAB). The pre‐processed interictal EEG was analysed independently in both left and right recording leads. The right parietal lead was used for further analysis, unless there was significant artefact, in which case the left recording lead was used. Baseline PAC was evaluated in Brainstorm by creating a PAC comodulogram with frequencies of 2–30 Hz for phase (x‐axis) and 30–200 Hz (y‐axis) for amplitude. The PAC algorithm in Brainstorm uses the mean vector length method of determining a ‘direct PAC’ measure (Özkurt & Schnitzler, 2011). Given significant PAC dependence on state (Scheffzük et al. 2011), animals with peak direct PAC below 10−2 indicated were excluded from the analysis. As a control measure, comodulograms were also estimated using two other common methods: phase‐locking value (Penny et al. 2008) and modulation index (Tort et al. 2010). As described below, these methods produced highly similar results as statistically assessed by rank correlation of comodulogram matrices between methods, and therefore the main analyses focused on the direct PAC estimation data. Comodulograms were then used to identify and compare peak PAC frequency pairs (phase and amplitude). Periods of active wakefulness were determined by exporting segments of EEG that corresponded to locomotor activity on simultaneous video recording.
Power analysis
Pre‐ and post‐drug interictal EEG power spectrum was estimated using the spectral analysis function (spectropo()) in EEGLab (Delorme & Makeig, 2004). Left and right recording leads were analysed separately for power between 2 and 200 Hz with a window size of 8 s and a window overlap of 6 s; AP was then averaged across both leads. Relative power (RP) was calculated by dividing the absolute power values for each frequency by the total power (TP; 2–200 Hz), and then normalized with a log transformation before comparison between mice (RP = AP/TP), similar to methods previously described (Koopman et al. 1996; Jobert et al. 2012).
Drugs
Ethosuximide (Sigma‐Aldrich, St Louis, MO, USA) and the NMDA antagonist MK‐801 (Tocris Bioscience, Minneapolis, MN, USA) were first dissolved in DMSO, brought to 1% volume/weight of each animal being tested in a phosphate‐buffered saline solution (Thermo Fisher Scientific, Waltham, MA, USA), and then injected intraperitoneally.
Statistics
The statistical significance of peak PAC pairs was estimated using circular data shuffling to create 2000 surrogates for comparison via a Rayliegh test at P < 0.05. Group analysis of the resultant data was performed using a one‐way repeated measures ANOVA with Tukey's test for multiple comparisons (for baseline studies) or Wilcoxon's test (for drug studies), and the adjusted significance was set at P < 0.05. Comparisons between maximum PAC, phase for frequency and phase for amplitude before and after medication administration was analyzed with a Student's paired t‐test. Finally, given the clear differences observed in mean PAC comodulograms between animal groups (see below), we explored the utility of PAC profiles to identify group similarity between single animals in an unsupervised data driven manner. Similar to the PAC method comparison above, comodulograms for each animal were transformed into vectors and correlated (Spearman's rank correlation). This correlation/similarity matrix (comprising all animals) was then converted to a dissimilarity matrix (1 − correlation value). Multidimensional scaling (MDS) was then applied to the dissimilarity matrix to visualize the PAC based similarity of each animal (where geometric distance conveys similarity). These analytic steps are highly similar to representational similarity analysis commonly performed in functional brain imaging (Kriegeskorte et al. 2008).
For power analysis, statistical differences between groups at baseline were tested using a two‐way ANOVA with Dunnett's post hoc test comparing to +/+ at each frequency. Differences due to drug exposure were tested using a repeated‐measures two‐way ANOVA to compare groups before and after drug administration with Sidak's post hoc test at each frequency. Statistical significance was set at an adjusted P < 0.05 at two or more consecutive frequencies to avoid spurious significance. All statistical analysis was performed using Prism version 7.01 (GraphPad Software, La Jolla, CA, USA).
Results
Gene‐specific shift in maximal phase amplitude coupling in stargazer and tottering mice
Comodulograms between the phase of 2–30 Hz and the amplitude of 30–200 Hz were created for +/+, stg/+, stg/stg and tg/tg mice using the baseline interictal EEG. Sample PAC comodulograms are displayed in Fig. 1 A–D. In wild‐type and stg/+ mice, there was significant coupling between gamma oscillations at the peak of theta (Fig. 1 A and E). In contrast, stg/stg mice showed maximal coupling between the phase of alpha/beta and high‐gamma oscillations (Fig. 1 C and G), while tg/tg mice showed maximal coupling between the phase of delta and high‐gamma oscillations (Fig. 1 D and H).
Figure 1. Representative examples of PAC in +/+, stg/+, stg/stg, and tg/tg mice.

Comodulograms showed prominent theta–gamma coupling in +/+ and stg/+ mice. In contrast, there was maximal PAC with alpha/beta–high gamma coupling in stg/stg mice, and maximal PAC with delta–high gamma coupling in tg/tg mice (A–D, red arrows). One second of raw seizure‐free data traces is displayed in E–H (vertical bar, 100 μV for raw and low frequency traces, 300 μV for high frequency traces).
Group PAC data are shown in Fig. 2. There was no significant difference between +/+ and stg/+ mice in the average overall PAC, the maximum PAC value, maximum frequency for phase, or maximum frequency for amplitude. stg/stg mice had no difference in maximum PAC value, but a significantly increased average PAC and increased frequencies for both peak phase and peak amplitude, shifting the peak in the comodulogram rightward and upward. tg/tg mice also had no difference in maximum PAC value and had no difference in average PAC. However, tg/tg mice did have significantly decreased peak frequency for phase and increased peak frequency for amplitude, shifting the comodulogram peak leftward and upward (Fig. 2 D and E).
Figure 2. Gene‐specific shifts in the PAC comodulogram.
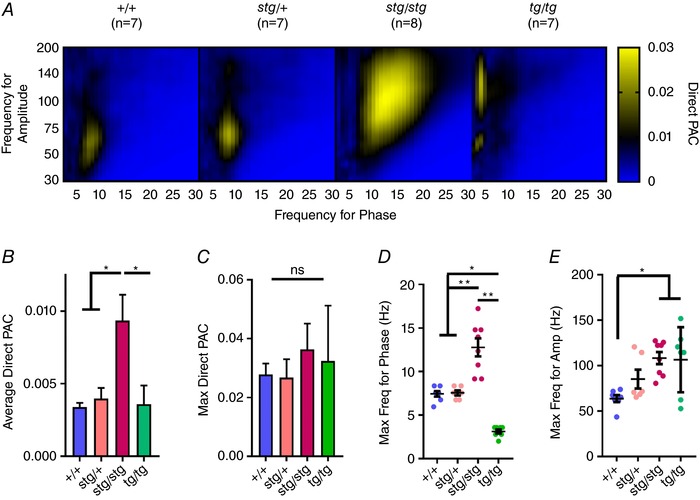
A, average comodulograms for +/+, stg/+, stg/stg and tg/tg mice reveal distinct abnormal patterns in both homozygous mutants. B, increased average direct PAC in stg/stg mice compared to all other genotypes. C, no significant change in the maximum PAC. D, there is a significant shift to a greater phase frequency in stg/stg and to a lower phase frequency in tg/tg mice. E, there is a significant increase in the amplitude frequency in both stg/stg and tg/tg mice (one‐way ANOVA with multiple comparisons, *adjusted P < 0.05, **adjusted P < 0.005).
Validation of phase–amplitude coupling
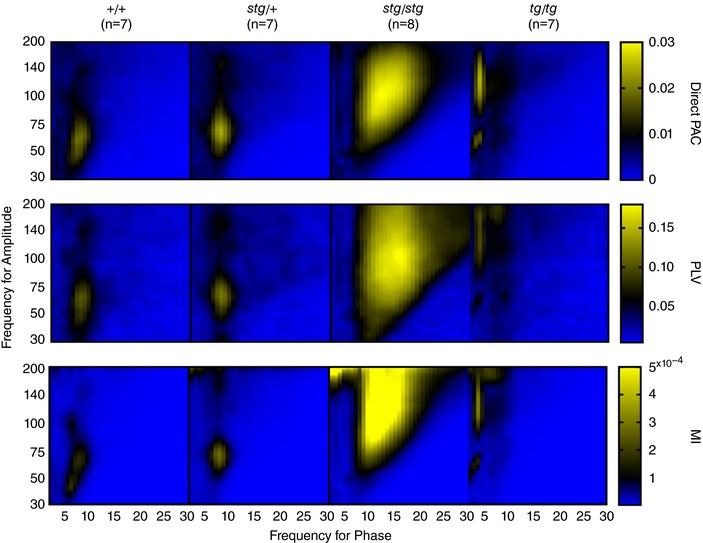
To ensure that group differences in mean PAC comodulograms were invariant to estimation method, we also calculated mean comodulograms using the phase‐locking value (PLV; Penny et al. 2008) and modulation index (MI; Tort et al. 2010) techniques (see Methods). As seen in Fig. 3, all three methods of PAC estimation produce highly similar mean comodulograms. To quantify this similarity we performed rank‐correlations (Spearman) on comodulograms between methods for each animal group. Both alternative PAC techniques showed highly similar comodulogram profiles compared with the initial direct PAC method: (i) PLV vs. direct PAC (+/+ = 0.93, stg/+ = 0.92, stg/stg = 0.90, tg/tg = 0.96); (ii) MI vs. direct PAC (+/+ = 0.98, stg/+ = 0.97, stg/stg = 0.96, tg/tg = 0.99); all P < 0.001.
Figure 3. Similar comodulograms with different methods of calculating PAC: original Brainstorm method (direct PAC, top), phase‐locking value (PLV, middle) and modulation index (MI, bottom).
To ensure that state of arousal was not confounding the difference in PAC between genotypes, we next asked whether there was a significant difference between the time mice were actively wakeful during the baseline recordings. The activity was quite variable across all genotypes, ranging from 4.15% to 98.9% active, with no significant difference between groups (Fig. 4 A). When only these blocks of active wakefulness were analysed, the maximum frequency for phase and frequency for amplitude were not significantly changed across all genotypes (Fig. 4 B).
Figure 4. Similar comodulograms when evaluating only active wakefulness.

A, no significant difference in the percentage of time in active wakefulness across genotypes. B, comodulograms show similar peak frequencies for phase and amplitude with shifts in stg/stg and tg/tg but not in stg/+ mice.
Persistent abnormal phase–amplitude coupling with ethosuximide
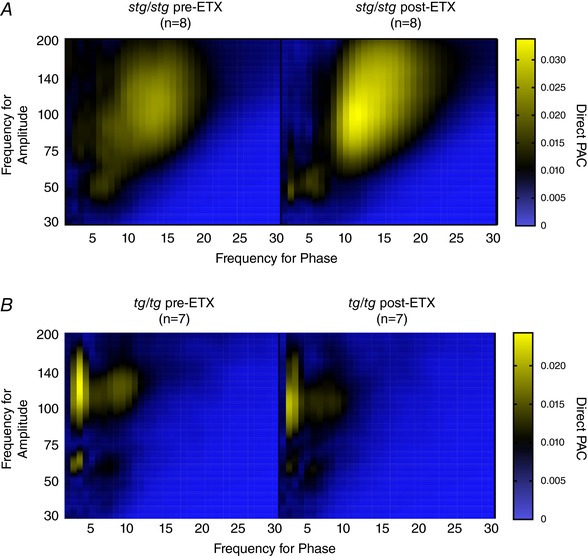
We next evaluated the degree of PAC before and after treating seizures with the antiepileptic drug ethosuximide, the preferred treatment for human childhood absence epilepsy (Glauser et al. 2013). As we have shown previously, a 200 mg kg−1 intraperitoneal dose of ethosuximide significantly reduces seizure activity for several hours for both stg/stg and tg/tg mice (Maheshwari et al. 2013). Compared to the 30 min baseline period prior to injection, there was no observable change to the comodulogram between 30 and 60 min after injection (Fig. 5 A and B). The average PAC, maximum PAC, maximum frequency for phase, and maximum frequency for amplitude all had no significant difference comparing pre‐ and post‐injection (stg/stg, n = 8, tg/tg, n = 7, paired t test, P > 0.05, Fig. 5).
Figure 5. Persistent aberrant interictal PAC following abolition of seizures with ethosuximide in both stg/stg (A) and tg/tg mice (B).
Comodulogram profiles partially cluster genetic groups
To explore the utility of comodulogram profiles as putative EEG biomarkers of genetic class at the single animal level, we performed unsupervised similarity analysis. We compared the similarity of PAC comodulograms between all animals, and visualized this comparison geometrically using MDS (see Methods). Consistent with the qualitative features of the mean comodulograms (Fig. 2), MDS reveals a clear dissociation of stg/stg mice from overlapping members of the +/+ and stg/+ mice (Fig. 6). In addition, aberrant patterns in tg/tg mice were more distant from stg/stg mice, but partially overlapping with +/+ and stg/+, consistent with comodulogram features. These relatively clear genotypic differences in group membership predict the potential for more formal classification approaches and possible diagnostic utility utilizing PAC comodulogram features.
Figure 6. Group multidimensional scaling (MDS) plot showing distinct clustering of stg/stg away from tg/tg, +/+, and stg/+.
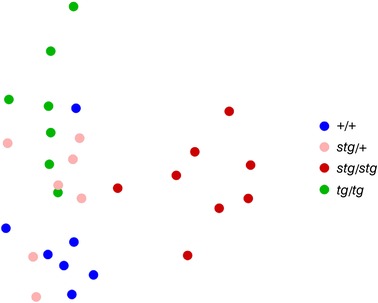
MDS was applied to a dissimilarity matrix (1 − Spearman rank correlation value) to visualize the PAC based similarity of each animal, where geometric distance conveys similarity (see Methods).
Heterozygous mice display no epilepsy with normal absolute and relative beta/gamma power
In all baseline recordings, +/+ and stg/+ mice never exhibited seizures. Both stg/+ (n = 11) and tg/tg (n = 11) mice had no significant change in baseline absolute power compared to +/+ (n = 11) mice, while stg/stg mice had significantly augmented absolute power between 11.25 and 39.5 Hz as well as 188.25–200 Hz (Fig. 7 A). When correcting for total power, stg/+ and tg/tg mice continued to have no significant difference from +/+ mice, but stg/stg mice had augmented 13.25–19.0 Hz relative power and a resultant reduction in 81.75–152.5 Hz relative power between 81.75 and 152.5 Hz (Fig. 7 B).
Figure 7. Mean ± SEM EEG power spectra for absolute and relative power.
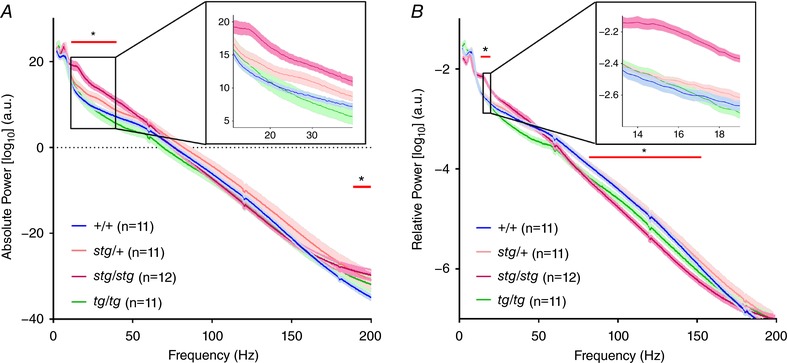
A, augmented absolute power in stg/stg compared to +/+ mice between 11.25 and 39.5 Hz (inset) as well as 188.25–200 Hz. There is no significant difference in power at any frequency for stg/+ or tg/tg mice. B, augmented relative power between 13.25 and 19 Hz in stg/stg mice compared to +/+ mice with reduced relative power between 81.75 and 152.5 Hz. There is a non‐significant trend toward augmented relative power in the delta range (3–4 Hz) for tg/tg compared to +/+ (two‐way ANOVA with Sidak's correction for multiple comparisons, *adjusted P < 0.05).
Heterozygous stargazer mice display a reduction in beta/gamma power with NMDA receptor blockade
We previously found that the augmented beta/gamma power in stg/stg mice was reduced after administration of NMDA receptor blockade (Maheshwari et al. 2016), consistent with the hypothesis that impaired AMPA receptor trafficking in cortical parvalbumin‐expressing neurons in stg/stg mice leads to an abnormal dependence on NMDA receptors to maintain these fast oscillations. Therefore, we next evaluated the response of stg/+ to the NMDA antagonist MK‐801 and found a response similar to stg/stg (Fig. 8), with both a reduction of beta/gamma power and the absence of a high gamma peak (150–180 Hz) that is seen in both +/+ and tg/tg mice. Therefore, despite freedom from seizures and a normal baseline gamma power, stg/+ mice have electrographic abnormalities that are unmasked by NMDA receptor blockade. Altogether, these results are consistent with evidence that the AMPA receptor trafficking deficit, primarily located on cortical interneuron dendrites (Maheshwari et al. 2013), leads to an abnormal dependence on NMDA receptors for maintenance of beta/gamma power in stg/+ mice.
Figure 8. Change in relative power (mean ± SEM) with NMDA receptor blockade.
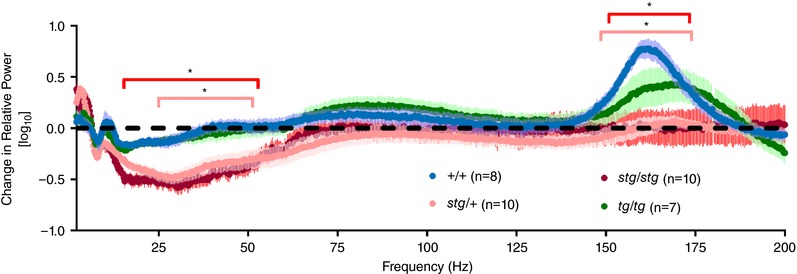
The response to MK‐801 in stg/+ mice is similar to the response in stg/stg mice. Compared to +/+, both have significantly reduced relative power in the beta/gamma range (stg/stg, 15.25–53 Hz; stg/+, 24.75–51 Hz), with a lack of activation at high gamma range (stg/stg, 151.25–174.25 Hz; stg/+, 148.5–173.75 Hz, *adjusted P < 0.05). tg/tg mice respond to MK‐801 in a similar manner to +/+ mice (adjusted P > 0.05 at all frequencies).
Abnormal PAC response to NMDA receptor blockade in stargazer mice
Since MK‐801 brought gamma power back down to normal levels in stg/stg mice, we next asked if NMDA receptor blockade could also normalize PAC. Overall, +/+, stg/+ and tg/tg mice had a similar response, shifting the maximum PAC to an island centred in theta for phase and high‐gamma for amplitude, whereas the maximum PAC in stg/stg mice shifted over to delta for phase and broad gamma for amplitude (Fig. 9 A, E and F; n = 6 for each genotype). In +/+ mice, MK‐801 caused the maximum direct PAC to increase to 0.102 ± 0.0133, significantly greater than the post‐MK‐801 maximum direct PAC in stg/stg (0.034 ± 0.009, mean ± SEM, one‐way ANOVA with Tukey's correction for multiple comparisons; adjusted P = 0.0288, Fig. 9 B). While stg/+ and tg/tg did not have as robust a response to MK‐801 as +/+, only stg/stg had a significantly reduced change in maximum PAC (−0.001 ± 0.006) compared to +/+ (0.079 ± 0.015, one‐way ANOVA with Tukey's correction for multiple comparisons; adjusted P = 0.0115, Fig. 9 C).
Figure 9. Change in PAC with NMDA receptor blockade.
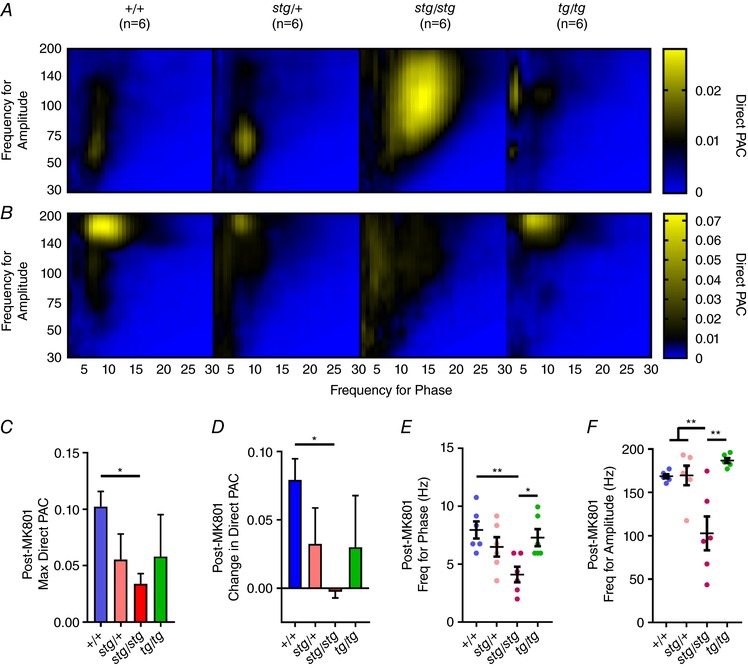
Compared to PAC before MK‐801 (A), PAC after MK‐801 (B) shifted to theta for phase and high‐gamma for amplitude in all genotypes except for stg/stg mice. Note that the colour map range is adjusted to appreciate changes in comodulogram structure. C, the maximum direct PAC after MK‐801 was significantly greater in +/+ than stg/stg, with intermediate responses in stg/+ and tg/tg. D, similarly, the change in direct PAC was significantly greater in +/+ than in stg/stg mice. E, frequency for phase shifted to delta for stg/stg, significantly lower than theta for phase in +/+ and tg/tg, and (F) frequency for amplitude for stg/stg was significantly lower than all other genotypes post‐MK801 (n = 6 in each group, one‐way ANOVA with Tukey's correction for multiple comparisons; *adjusted P < 0.05, **adjusted P < 0.01, **adjusted P < 0.0005).
Discussion
In this study, we investigated whether oscillations within the EEG were significantly changed in mice with monogenic mutations associated with absence epilepsy in three states: (1) in the interictal state in stg/stg and tg/tg which have active epilepsy; (2) in treated epileptic mice which no longer have seizures; and (3) with stg/+ mice which have no epilepsy. In each of these categories, we found potential EEG biomarkers for monogenic cortical dysfunction by evaluating absolute/relative power and phase–amplitude coupling at baseline and in response to medications.
Phase–amplitude coupling in stg/+ mice was unchanged compared to +/+ mice, showing prominent theta–gamma coupling. Theta–gamma coupling in parietal neocortex has been previously reported, predominantly in the awake state, with the greatest coupling occurring at the peak of the theta phase (Scheffzük et al. 2011). stg/stg and tg/tg mice, however, both had significantly shifted interictal comodulograms compared to +/+ mice. stg/stg mice were significantly shifted rightward and upward, while tg/tg mice were significantly shifted leftward and upward. Since absolute and relative power were otherwise unaffected in tg/tg mice (Maheshwari et al. 2016), abnormal interictal PAC may have a greater association with absence epilepsy than abnormal baseline power. Further studies of interictal PAC in other models and patients with absence epilepsy are necessary to more thoroughly evaluate this hypothesis. Part of this confirmation should involve close consideration of EEG waveform morphology and its confounding influence on PAC estimation (Cole & Voytek, 2017). While sleep–wake cycles can also affect the degree of neocortical PAC in mice (Scheffzük et al. 2011), the shifts in phase–amplitude coupling remained when only periods of active wakefulness were examined (Fig. 4 B). Nonetheless, a detailed analysis of the effect of brain state on interictal phase–amplitude coupling in epileptic mice is another important avenue of future research.
Treatment of seizures with ethosuximide in both genotypes did not significantly alter the underlying aberrant PAC. This finding suggests that the genetic mutations in these models, to some degree, generate abnormal circuit behaviour present during both the interictal and ictal states. Persistent abnormal PAC may underlie attention deficits in patients with absence epilepsy that are otherwise seizure‐free after treatment of their epilepsy (Masur et al. 2013). This hypothesis is supported by recent work that correlates theta–gamma coupling with attention tasks in humans (Szczepanski et al. 2014) as well as impaired theta–gamma coupling in patients with attention deficit disorder (Kim et al. 2015). However, it is also possible that abnormal PAC and absence seizures are both epiphenomenal manifestations of underlying genetic dysfunction, without a causal link between abnormal PAC and deficits in attention. Further studies are necessary to dissect potential causal relationships between these phenomena.
Since we did not specifically test cognitive performance, we can only speculate as to the meaning of the shift in baseline PAC in the epileptic mice. Reduced theta–gamma coupling has been seen in amyloid precursor protein‐deficient Alzheimer model mice (Zhang et al. 2016) and with reduced fast inhibition onto PV interneurons in the hippocampus (Wulff et al. 2009). However, a shift in PAC has not previously been seen specifically due to a genetic mutation. A shift in PAC has been seen in the consciousness transition with anaesthesia (Mukamel et al. 2014), and a shift from theta–gamma to alpha–gamma coupling has also been seen with visual tasks and attention (Voytek et al. 2010; Jensen et al. 2014). We hypothesize that the shifts we see in these mutant epileptic mice may be due to the specific effects of each genetic mutation on the underlying circuit responsible for phase–amplitude coupling (Onslow et al. 2014). Experiments modelling changes in cell type‐specific connectivity have shown that theoretically these shifts can occur (Sotero, 2015).
Finally, stg/+ mice had no seizures and normal power. However, similar to stg/stg mice, stg/+ mice were found to have a significant drop in beta/gamma power with the NMDA receptor blocker MK‐801. Therefore, despite the absence of electroclinical seizures, the EEG was able to reveal a biomarker for pharmacogenetic dysfunction when challenged with NMDA receptor blockade. In contrast to ethosuximide, which reduced seizure activity but had no effect on PAC in stg/stg mice, MK‐801 worsened seizures and significantly shifted PAC to the left. In +/+ mice, MK‐801 shifted PAC from theta–gamma to theta–high gamma, which has been similarly shown in wild‐type rats in response to ketamine, another NMDA receptor blocker (Cordon et al. 2015). Interestingly, PAC did not normalize to baseline +/+ levels, nor did it respond like +/+, but rather shifted to delta for phase and broadly over low and high gamma for amplitude. Since PAC in tg/tg responded similarly to +/+ in response to MK‐801 which also significantly reduced seizures, we have shown that interictal PAC in mutant mice is not necessarily fixed, and there is a potential for pharmacologically shifting PAC while also concomitantly treating seizures.
With these experiments, we have demonstrated three different ways in which an EEG can show the potential for genetic dysfunction independent from seizures or any sharp activity. First, interictal PAC was abnormal at baseline in epileptic mice. Second, PAC remained abnormal despite pharmacological treatment with ethosuximide. Finally, heterozygous dysfunction was unmasked by a drop in beta/gamma power with NMDA receptor blockade. Therefore, when evaluating mouse models or patients with epilepsy, we have found that analysing both power and PAC, in addition to challenging subjects with various medications, is critical before declaring the interictal EEG as ‘normal’.
Additional information
Competing interests
There are no conflicts of interest for any of the authors.
Author contributions
A.M. conceived and designed the work; A.M., I.A., M.W., R.M., K.Y. and S.P. acquired, analysed and interpreted the data; B.L.F. and J.L.N. analysed and interpreted the data. All authors revised the work critically for important intellectual content, approved the final version of the manuscript, and agreed to be accountable for all aspects of the work in ensuring that questions related to the accuracy or integrity of any part of the work were appropriately investigated and resolved. Al persons designated as authors qualify for authorship, and all those who qualify for authorship are listed.
Funding
Funding sources include the National Institutes of Health National Institute of Neurological Disorders and Stroke NIH NINDS K08 NS096029 (A.M.), NIH NINDS R01 NS29709 (J.L.N.); and National Institute for Mental Health NIH NIMH R00 MH103479 (B.L.F.).
Translational perspective
Patients with epilepsy frequently have comorbidities that may persist despite successful treatment of seizures, but the current focus of clinical EEG is limited to detection of the presence or absence of epileptiform activity. With an appropriate sampling rate, careful attention to patients’ state of arousal, and selection of epochs free from myogenic artefact, the work presented here suggests that quantitative analysis of features encoded in human scalp EEG, such as phase–amplitude coupling, may serve as a biomarker for cognitive deficits, which may then be treated in parallel with seizures. Further behavioural studies in rodents and humans with simultaneous intracranial and scalp EEG will be necessary to validate this hypothesis.
Linked articles This article is highlighted by a Perspective by Lüttjohann. To read this Perspective, visit https://doi.org/10.1113/JP275132.
References
- Amiri M, Frauscher B & Gotman J (2016). Phase‐amplitude coupling is elevated in deep sleep and in the onset zone of focal epileptic seizures. Front Hum Neurosci 10, 387. [DOI] [PMC free article] [PubMed] [Google Scholar]
- Barad Z, Shevtsova O, Arbuthnott GW & Leitch B (2012). Selective loss of AMPA receptors at corticothalamic synapses in the epileptic stargazer mouse. Neuroscience 217, 19–31. [DOI] [PubMed] [Google Scholar]
- Bomben VC, Aiba I, Qian J, Mark MD, Herlitze S & Noebels JL (2016). Isolated P/Q calcium channel deletion in layer VI corticothalamic neurons generates absence epilepsy. J Neurosci 36, 405–418. [DOI] [PMC free article] [PubMed] [Google Scholar]
- Burgess DL & Noebels JL (1999). Single gene defects in mice: the role of voltage‐dependent calcium channels in absence models. Epilepsy Res 36, 111–122. [DOI] [PubMed] [Google Scholar]
- Canolty RT & Knight RT (2010). The functional role of cross‐frequency coupling. Trends Cogn Sci 14, 506–515. [DOI] [PMC free article] [PubMed] [Google Scholar]
- Cole SR & Voytek B (2017). Brain oscillations and the importance of waveform shape. Trends Cogn Sci 21, 137–149. [DOI] [PubMed] [Google Scholar]
- Cordon I, Nicolás MJ, Arrieta S, Lopetegui E, López‐Azcárate J, Alegre M, Artieda J & Valencia M (2015). Coupling in the cortico‐basal ganglia circuit is aberrant in the ketamine model of schizophrenia. Eur Neuropsychopharmacol 25, 1375–1387. [DOI] [PubMed] [Google Scholar]
- Delorme A & Makeig S (2004). EEGLAB: an open source toolbox for analysis of single‐trial EEG dynamics including independent component analysis. J Neurosci Methods 134, 9–21. [DOI] [PubMed] [Google Scholar]
- Edakawa K, Yanagisawa T, Kishima H, Fukuma R, Oshino S, Khoo HM, Kobayashi M, Tanaka M & Yoshimine T (2016). Detection of epileptic seizures using phase‐amplitude coupling in intracranial electroencephalography. Sci Rep 6, 25422. [DOI] [PMC free article] [PubMed] [Google Scholar]
- Glauser TA, Cnaan A, Shinnar S, Hirtz DG, Dlugos D, Masur D, Clark PO, Adamson PC & Childhood Absence Epilepsy Study Team (2013). Ethosuximide, valproic acid, and lamotrigine in childhood absence epilepsy: initial monotherapy outcomes at 12 months. Epilepsia 54, 141–155. [DOI] [PMC free article] [PubMed] [Google Scholar]
- Grundy D (2015). Principles and standards for reporting animal experiments in The Journal of Physiology and Experimental Physiology . J Physiol 593, 2547–2549. [DOI] [PMC free article] [PubMed] [Google Scholar]
- Guirgis M, Chinvarun Y, Del Campo M, Carlen PL & Bardakjian BL (2015). Defining regions of interest using cross‐frequency coupling in extratemporal lobe epilepsy patients. J Neural Eng 12, 026011. [DOI] [PubMed] [Google Scholar]
- Jensen O, Gips B, Bergmann TO & Bonnefond M (2014). Temporal coding organized by coupled alpha and gamma oscillations prioritize visual processing. Trends Neurosci 37, 357–369. [DOI] [PubMed] [Google Scholar]
- Jobert M, Wilson FJ, Ruigt GSF, Brunovsky M, Prichep LS, Drinkenburg WHIM & IPEG Pharmaco‐EEG Guidelines Committee (2012). Guidelines for the recording and evaluation of pharmaco‐EEG data in man: The International Pharmaco‐EEG Society (IPEG). Neuropsychobiology 66, 201–220. [DOI] [PubMed] [Google Scholar]
- Kim JW, Lee J, Kim B‐N, Kang T, Min KJ, Han DH & Lee YS (2015). Theta‐phase gamma‐amplitude coupling as a neurophysiological marker of attention deficit/hyperactivity disorder in children. Neurosci Lett 603, 25–30. [DOI] [PubMed] [Google Scholar]
- Koopman PA, Wouters PA & Krijzer FN (1996). Mean power spectra from pharmaco‐electrocorticographic studies: relative baseline correction and log transformation for a proper analysis of variance to assess drug effects. Neuropsychobiology 33, 100–105. [DOI] [PubMed] [Google Scholar]
- Kramer MA, Tort ABL & Kopell NJ (2008). Sharp edge artifacts and spurious coupling in EEG frequency comodulation measures. J Neurosci Methods 170, 352–357. [DOI] [PubMed] [Google Scholar]
- Kriegeskorte N, Mur M & Bandettini P (2008). Representational similarity analysis – connecting the branches of systems neuroscience. Front Syst Neurosci 2, 4. [DOI] [PMC free article] [PubMed] [Google Scholar]
- Maheshwari A, Marks RL, Yu KM & Noebels JL (2016). Shift in interictal relative gamma power as a novel biomarker for drug response in two mouse models of absence epilepsy. Epilepsia 57, 79–88. [DOI] [PMC free article] [PubMed] [Google Scholar]
- Maheshwari A, Nahm WK & Noebels JL (2013). Paradoxical proepileptic response to NMDA receptor blockade linked to cortical interneuron defect in stargazer mice. Front Cell Neurosci 7, 156. [DOI] [PMC free article] [PubMed] [Google Scholar]
- Masur D, Shinnar S, Cnaan A, Shinnar RC, Clark P, Wang J, Weiss EF, Hirtz DG, Glauser TA & Childhood Absence Epilepsy Study Group (2013). Pretreatment cognitive deficits and treatment effects on attention in childhood absence epilepsy. Neurology 81, 1572–1580. [DOI] [PMC free article] [PubMed] [Google Scholar]
- Mukamel EA, Pirondini E, Babadi B, Wong KFK, Pierce ET, Harrell PG, Walsh JL, Salazar‐Gomez AF, Cash SS, Eskandar EN, Weiner VS, Brown EN & Purdon PL (2014). A transition in brain state during propofol‐induced unconsciousness. J Neurosci 34, 839–845. [DOI] [PMC free article] [PubMed] [Google Scholar]
- Noebels JL, Qiao X, Bronson RT, Spencer C & Davisson MT (1990). Stargazer: a new neurological mutant on chromosome 15 in the mouse with prolonged cortical seizures. Epilepsy Res 7, 129–135. [DOI] [PubMed] [Google Scholar]
- Noebels JL & Sidman RL (1979). Inherited epilepsy: spike‐wave and focal motor seizures in the mutant mouse tottering. Science 204, 1334–1336. [DOI] [PubMed] [Google Scholar]
- Onslow ACE, Jones MW & Bogacz R (2014). A canonical circuit for generating phase‐amplitude coupling. PloS One 9, e102591. [DOI] [PMC free article] [PubMed] [Google Scholar]
- Özkurt TE & Schnitzler A (2011). A critical note on the definition of phase‐amplitude cross‐frequency coupling. J Neurosci Methods 201, 438–443. [DOI] [PubMed] [Google Scholar]
- Penny WD, Duzel E, Miller KJ & Ojemann JG (2008). Testing for nested oscillation. J Neurosci Methods 174, 50–61. [DOI] [PMC free article] [PubMed] [Google Scholar]
- Rossignol E, Kruglikov I, van den Maagdenberg AMJM, Rudy B & Fishell G (2013). CaV2.1 ablation in cortical interneurons selectively impairs fast‐spiking basket cells and causes generalized seizures. Ann Neurol 74, 209–222. [DOI] [PMC free article] [PubMed] [Google Scholar]
- Scheffer‐Teixeira R, Belchior H, Leão RN, Ribeiro S & Tort ABL (2013). On high‐frequency field oscillations (>100 Hz) and the spectral leakage of spiking activity. J Neurosci 33, 1535–1539. [DOI] [PMC free article] [PubMed] [Google Scholar]
- Scheffzük C, Kukushka VI, Vyssotski AL, Draguhn A, Tort ABL & Brankačk J (2011). Selective coupling between theta phase and neocortical fast gamma oscillations during REM‐sleep in mice. PloS One 6, e28489. [DOI] [PMC free article] [PubMed] [Google Scholar]
- Smyk MK, Coenen AML, Lewandowski MH & van Luijtelaar G (2011). Endogenous rhythm of absence epilepsy: relationship with general motor activity and sleep‐wake states. Epilepsy Res 93, 120–127. [DOI] [PubMed] [Google Scholar]
- Sotero RC (2015). Modeling the generation of phase‐amplitude coupling in cortical circuits: from detailed networks to neural mass models. Biomed Res Int 2015, 915606. [DOI] [PMC free article] [PubMed] [Google Scholar]
- Szczepanski SM, Crone NE, Kuperman RA, Auguste KI, Parvizi J & Knight RT (2014). Dynamic changes in phase‐amplitude coupling facilitate spatial attention control in fronto‐parietal cortex. PLoS Biol 12, e1001936. [DOI] [PMC free article] [PubMed] [Google Scholar]
- Tadel F, Baillet S, Mosher JC, Pantazis D & Leahy RM (2011). Brainstorm: a user‐friendly application for MEG/EEG analysis. Comput Intell Neurosci 2011, 879716. [DOI] [PMC free article] [PubMed] [Google Scholar]
- Tort ABL, Komorowski R, Eichenbaum H & Kopell N (2010). Measuring phase‐amplitude coupling between neuronal oscillations of different frequencies. J Neurophysiol 104, 1195–1210. [DOI] [PMC free article] [PubMed] [Google Scholar]
- Voytek B, Canolty RT, Shestyuk A, Crone NE, Parvizi J & Knight RT (2010). Shifts in gamma phase‐amplitude coupling frequency from theta to alpha over posterior cortex during visual tasks. Front Hum Neurosci 4, 191. [DOI] [PMC free article] [PubMed] [Google Scholar]
- Wulff P, Ponomarenko AA, Bartos M, Korotkova TM, Fuchs EC, Bähner F, Both M, Tort ABL, Kopell NJ, Wisden W & Monyer H (2009). Hippocampal theta rhythm and its coupling with gamma oscillations require fast inhibition onto parvalbumin‐positive interneurons. Proc Natl Acad Sci USA 106, 3561–3566. [DOI] [PMC free article] [PubMed] [Google Scholar]
- Xiang J, Tenney JR, Korman AM, Leiken K, Rose DF, Harris E, Yuan W, Horn PS, Holland K, Loring DW & Glauser TA (2014). Quantification of interictal neuromagnetic activity in absence epilepsy with accumulated source imaging. Brain Topogr 28, 904–914. [DOI] [PubMed] [Google Scholar]
- Zhang X, Zhong W, Brankačk J, Weyer SW, Müller UC, Tort ABL & Draguhn A (2016). Impaired theta‐gamma coupling in APP‐deficient mice. Sci Rep 6, 21948. [DOI] [PMC free article] [PubMed] [Google Scholar]


