

Abstract
Fibrosis and organ failure is a common endpoint for many chronic liver diseases. Much is known about the upstream inflammatory mechanisms provoking fibrosis and downstream potential for tissue remodeling. However, less is known about the transcriptional regulation in vivo governing fibrotic matrix deposition by liver myofibroblasts. This gap in understanding has hampered molecular predictions of disease severity and clinical progression and restricted targets for antifibrotic drug development. In this study, we show the prevalence of SOX9 in biopsies from patients with chronic liver disease correlated with fibrosis severity and accurately predicted disease progression toward cirrhosis. Inactivation of Sox9 in mice protected against both parenchymal and biliary fibrosis, and improved liver function and ameliorated chronic inflammation. SOX9 was downstream of mechanosignaling factor, YAP1. These data demonstrate a role for SOX9 in liver fibrosis and open the way for the transcription factor and its dependent pathways as new diagnostic, prognostic, and therapeutic targets in patients with liver fibrosis.
Keywords: extracellular matrix, hepatic stellate cells, liver fibrosis, SOX9, YAP1
Subject Categories: Digestive System, Metabolism
Introduction
In response to inflammation, the secretion of collagen‐rich pathological extracellular matrix (ECM) by liver myofibroblasts, called hepatic stellate cells (HSCs), destroys normal tissue architecture and causes fibrosis. Fibrosis occurs in both hepatic parenchymal and biliary diseases and is a major cause of morbidity and mortality against which there are no approved drug treatments (Iredale, 2007; Friedman, 2008; Lee & Friedman, 2011; Lee et al, 2015). Even after withdrawal of the inflammatory insult, fibrosis can progress unchecked to organ failure and death. Alternatively, in some individuals liver fibrosis may not advance despite persisting insult (Ellis & Mann, 2012; Kisseleva et al, 2012; Troeger et al, 2012). Addressing this uncertainty requires in vivo knowledge of the molecular mechanisms that regulate fibrosis.
The transcription factor sex determining region Y box 9 (SOX9) is responsible in vivo for the organized deposition of collagen as part of cartilage formation. In humans, mutations in the SOX9 gene cause the haploinsufficiency disorder campomelic dysplasia (CD), characterized by failed chondrogenesis (Foster et al, 1994; Wagner et al, 1994; Pritchett et al, 2011). In the liver, SOX9 is ordinarily expressed in cholangiocytes lining the bile ducts and plays roles in bile duct development and in hepatic regeneration (Antoniou et al, 2009; Carpentier et al, 2011; Yanger et al, 2013; Tarlow et al, 2014; Font‐Burgada et al, 2015; Jors et al, 2015; Lu et al, 2015). In vitro, we have shown that SOX9 becomes expressed during the activation of HSCs by profibrotic signaling factors when it promotes production of ECM components, such as type 1 collagen (COL1) and osteopontin (OPN) (Hanley et al, 2008; Pritchett et al, 2012). However, these studies relied on imperfect in vitro cell models. Direct in vivo evidence for SOX9 function in liver fibrosis (rather than regeneration) has been lacking.
In this study, we have studied SOX9 in patients with chronic liver disease where sequential liver biopsies enabled fibrosis severity and disease progression to be deciphered over time and examined the consequences of inactivating SOX9 in rodent models of parenchymal and biliary liver fibrosis.
Results
SOX9 profile in the liver of patients with chronic liver disease
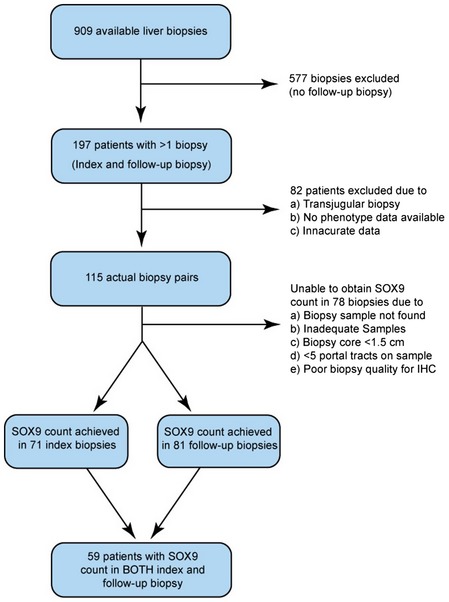
Patients chronically infected with hepatitis C virus (HCV) show variable severity of liver fibrosis with the potential for marked disease progression within a few years. While these patients are now routinely treated with antiviral drugs, this clinical setting offered a distinctive opportunity to study SOX9 and fibrosis progression because previous routine surveillance entailed patients undergoing accurately staged serial biopsies from their liver. We accessed the UK Trent HCV Cohort and identified 115 patients with initial and follow‐up biopsy categorized for severity by a histopathologist using the 7‐point Ishak (IS) fibrosis stage, IS0 to IS6; the latter representing the most severe fibrosis/cirrhosis (Ishak et al, 1995) (Table EV1). 70% of patients had no or mild fibrosis on initial biopsy (IS0‐1; n = 80) rather than more intermediate (IS2‐3; 16%, n = 19) or severe disease (IS4‐6; 14%, n = 16). However, at follow‐up biopsy 36.9 ± 2.5 months later, this percentage declined to 54% (n = 62) with corresponding increases in both the IS2‐3 category (24%, n = 28) and severe (22%, n = 25) fibrosis. Thus, over 3 years liver fibrosis had progressed in 30 patients (26%), regressed in eight patients (7%), and remained unchanged in 77 (67%) allowing us to correlate SOX9 with severity (tissue remained from 152 biopsies for this purpose; Fig EV1) and disease progression (where tissue remained from 59 paired biopsies; Fig EV1).
Figure EV1. Patient flowchart for biopsy selection.
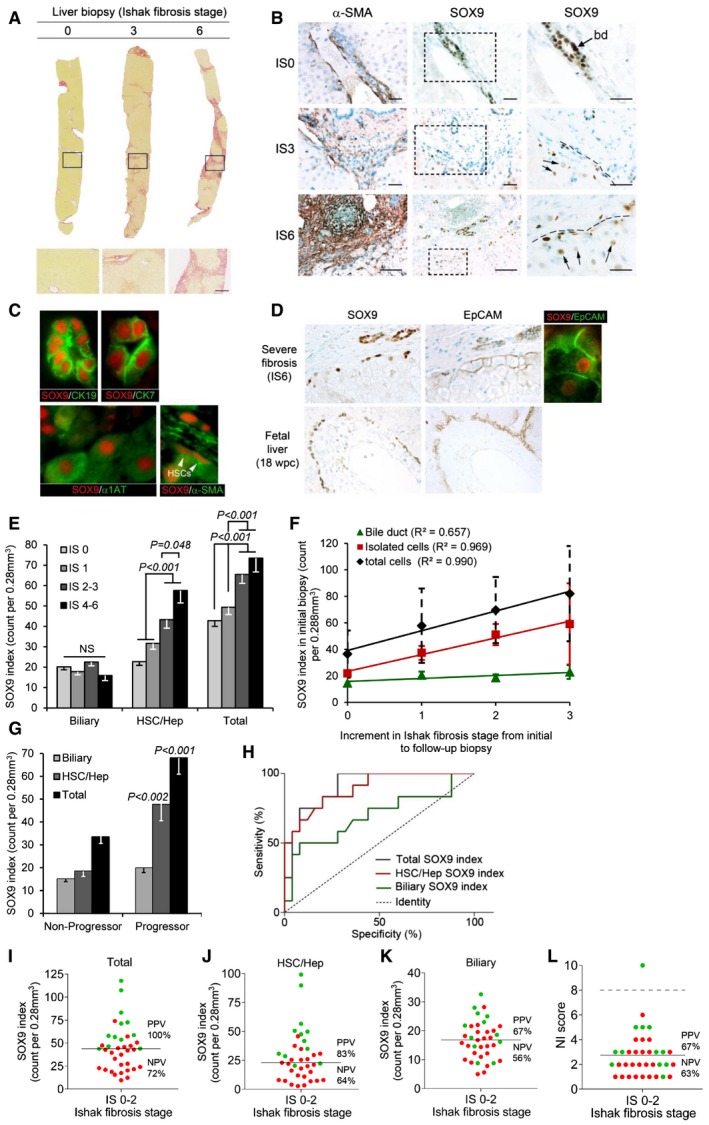
Staining for collagen using picrosirius red (PSR) and αSMA (a marker of activated myofibroblasts) was increased with higher Ishak fibrosis stage particularly in regions of scarring (Fig 1A and B). In IS0 (no liver fibrosis), SOX9 was observed in the nuclei of cholangiocytes (Fig 1B; Antoniou et al, 2009; Rowe et al, 2013). In moderate and severe fibrosis, nuclear SOX9 was progressively more noticeable in cells with elongated nuclei and αSMA. SOX9 was also detected at slightly lower levels in cells with large round nuclei adjacent to the scar costained for the hepatocyte marker, α1‐antitrypsin (α1AT), consistent with regenerative hepatocytes (termed Hep from here on) (Fig 1B and C). SOX9 was present in all CK19+ and CK7+ cholangiocytes lining bile ducts; these cells were not detected outside of duct structures. SOX9 was not detected in the CD34+ vasculature. Given the role of SOX9 in regenerative hepatocytes (Kawaguchi, 2013), we studied EpCAM which marks cholangiocytes and nascent hepatocytes (Yoon et al, 2011) and compared this to the SOX9+ ductal plate in human fetal liver, which gives rise to periportal hepatocytes and biliary cells (Carpentier et al, 2011; Furuyama et al, 2011; Rowe et al, 2013). In moderate and severe fibrosis, EpCAM localized to the SOX9+ Heps adjacent to the scar in an arrangement remarkably similar to the fetal ductal plate (Fig 1D). Thus, SOX9 could be partitioned discretely into bile duct nuclei and post‐injury expression in isolated cells demarcating a putative HSC/Hep population.
Figure 1. SOX9 in human liver fibrosis.
-
ALiver biopsies showing no (IS0), moderate (IS3), and severe (IS6) fibrosis stained by PSR. Size bar, 300 μm.
-
BImmunohistochemistry (brown staining) for αSMA and SOX9 on consecutive sections from patients with no (IS0), moderate (IS3), and severe (IS6) fibrosis. Boxed areas are shown to the right at higher magnification. Bile duct (bd). SOX9 detected in HSCs with elongated nuclei (hatched line) next to scar and in hepatocytes with rounded nuclei (arrows). Size bars, 200 μm.
-
CImmunofluorescence for SOX9 (red) costained with CK19, CK7, α1AT, and αSMA (green). Arrowheads show elongated nuclei in αSMA‐positive HSCs.
-
DImmunohistochemistry for SOX9 and EpCAM (brown staining) on consecutive sections from severe (IS6) fibrosis and normal fetal liver at 18 weeks post‐conception (wpc). Dual immunofluorescence confirms SOX9 and EpCAM in the same cell in severe fibrosis.
-
E–GData for SOX9 index for the biliary, HSC/Hep, and total (biliary + HSC/Hep) populations. In worsening categories of liver fibrosis (E). In the initial biopsy plotted against the increment in Ishak fibrosis stage between the initial and follow‐up biopsy (F). The lines show the best fit by ordinal logistic regression analysis. In the initial biopsy categorized by whether patients did or did not progress by at least two stages on follow‐up biopsy (G).
-
HReceiver operator curves for the sensitivity and specificity of the SOX9 index in the initial biopsy as a predictor of non‐progressors and progressors.
-
I–LPlots of SOX9 index (total, HSC/Hep, and biliary) and NI score marking progressors in green and non‐progressors in red. The solid line indicates the mean in each graph. The broken line in NI dot plot (L) indicates the threshold (score = 8) below which all NI is categorized as “mild”.
SOX9 index correlates with severity of liver fibrosis in patients and predicts progression
We used the above profiles to construct a SOX9 index of positive nuclei per surface area of biopsy. We counted the biliary, HSC/Hep, and total SOX9+ populations in 152 biopsies. While there was no change in SOX9+ biliary cells at different stages of fibrosis, the HSC/Hep SOX9 index doubled as fibrosis severity increased; a finding which was also reflected in the total count (Fig 1E). HSC/Hep and total SOX9 indices from the initial biopsies correlated very strongly with the increment in Ishak fibrosis stage between initial and follow‐up biopsies, while the biliary count did not alter (Fig 1F). The HSC/Hep SOX9 index was progressively higher for those patients whose liver fibrosis worsened over the subsequent 3 years. To see whether we could detect mild disease that was destined to progress, we identified all patients whose initial biopsy was IS0‐2 and classified them into two groups: “progressors” (n = 12), defined by a worsening fibrosis at follow‐up biopsy of ≥ 2 Ishak stages; or “non‐progressors” (n = 25) where the fibrosis either improved was static or worsened by no more than one stage. Patients across the two groups had not received anti‐HCV treatment, showed no significant difference in age, gender, alcohol consumption, ethnicity, serum alanine aminotransferase (ALT), necroinflammation, or HCV genotype (Appendix Table S1). In contrast, the HSC/Hep SOX9 index was significantly increased, more than double, in the initial biopsy of the “progressors” compared to “non‐progressors” (P < 0.01; Fig 1G). The potential to predict future progression was analyzed by calculating the area under the receiver operating characteristic curve (AUROC). The ideal test would have an AUROC of 1, where a random guess would have an AUROC of 0.5. The HSC/Hep SOX9 index (AUROC = 0.895, P < 0.001), and consequently the total SOX9 index (AUROC = 0.910, P < 0.05), forecast significant worsening of fibrosis amongst patients in the “progressor” category (Fig 1H). Moreover, when the initial biopsy was subdivided into individual Ishak stages (rather than an amalgamated IS0‐2) or into gender, the total SOX9 index significantly predicted progression in each instance except for patients at IS2 where low numbers were limiting (Appendix Table S2). We determined positive and negative predictive values (PPV and NPV) around the mean SOX9 count for total, HSC/Hep, and biliary populations (Fig 1I–K). The HSC/Hep and total SOX9 indices were predictive (Fig 1I and J), while the biliary count was unhelpful (Fig 1K). For additional comparison, we also quantified necroinflammation (NI) using the 0–18 scale of minimal (1–3), mild (4–8), moderate (9–12), and severe (13–18) NI (Ishak et al, 1995). The mean NI score in the initial biopsy was 2.75. Applying this threshold gave a PPV of 67% (NPV 63%). Setting the threshold at the upper limit of mild NI (score = 8) excluded all except one patient (Fig 1L; i.e., less predictive than the HSC/Hep and total SOX9 indices).
Univariate logistic regression analysis identified age, the HSC/Hep (or total) SOX9 count, and NI to be significant risk factors in disease progression (Table 1; P < 0.05). However, when adjusted for time between biopsies using multivariate analysis, only age and the SOX9 index retained significance. The odds ratios indicated that each 1‐year increase in age was associated with a 4% increase in the risk of becoming a “progressor”, whereas each cell increase in either the HSC/Hep or total SOX9 index increased the risk of fibrosis progression by 12% (Table 1). Male gender, serum ALT levels, or NI at first biopsy did not associate significantly with fibrosis progression.
Table 1.
Logistical regression analysis indicating risk factor association with progression of liver fibrosis
| Predictor | Odds ratio (95% CI) | ||
|---|---|---|---|
| Unadjusted | Adjusted for age | Adjusted for time to progression | |
| Age, per year increase | 1.08 (1.00, 1.17)a | – | 1.04 (1.00, 1.08)a |
| Age, > 55 versus ≤ 55 years | 4.36 (0.36, 53.39) | – | – |
| Gender, male versus female | 3.09 (0.56, 17.17) | 3.32 (0.50, 21.92) | 2.87 (0.44, 18.70) |
| Total Sox9, per unit increase | 1.13 (1.04, 1.23)a | 1.13 (1.03, 1.23)a | 1.12 (1.03, 1.22)a |
| Sox9 isolated cells, per unit increase | 1.13 (1.04, 1.23)a | 1.14 (1.04, 1.25)a | 1.12 (1.03, 1.23)a |
| Sox9 BD, per unit increase | 1.14 (1.00, 1.29)a | 1.14 (0.99, 1.31) | 1.09 (0.95, 1.25) |
| ALT, per unit increase | 1.01 (0.99, 1.02) | 1.01 (0.99, 1.02) | 1.01 (0.99, 1.02) |
| NI, per unit increase | 1.63 (0.98, 2.71)a | 1.55 (0.90, 2.68) | 1.68 (0.94, 3.01) |
Significant association (P < 0.05).
Sox9 is induced in HSCs by liver injury and its loss protects against fibrosis and chronic inflammation
To investigate the mechanism underlying SOX9 function in liver fibrosis, we explored the consequence of its loss in two well‐established rodent models of the disease. Liver fibrosis was induced by carbon tetrachloride (CCl4) (with olive oil control) injections given twice weekly for 8 weeks to induce parenchymal disease or the bile duct ligated (BDL) to cause peribiliary fibrosis at 2 weeks. While SOX9 persisted in cholangiocytes, the nuclear transcription factor became detected in both models in a subset of HNF4α+ cells with large round nuclei scattered around the bile ducts, equivalent to the regenerative Heps observed in human tissue (Fig 2A and B, and Appendix Fig S1). SOX9 protein and mRNA were detected in αSMA‐positive spindle‐shaped cells in sections of liver fibrosis induced by CCl4 and BDL (Fig 2C) as previously (Hanley et al, 2008; Pritchett et al, 2012). To corroborate that these cells were indeed activated HSCs, we isolated HSCs following acute liver injury with CCl4 (i.e., before scarring interferes with the HSC isolation procedure) and showed without culture that SOX9 was increased compared to control (Fig 2D and Appendix Fig S2). This ex vivo isolation from fibrotic liver has led to these cells being termed “in vivo activated” HSCs (De Minicis et al, 2007; Mederacke et al, 2015; Martin et al, 2016). Taken together, these data were entirely consistent with our observations in fibrotic human liver (Fig 1).
Figure 2. SOX9 is involved in liver fibrosis in vivo .
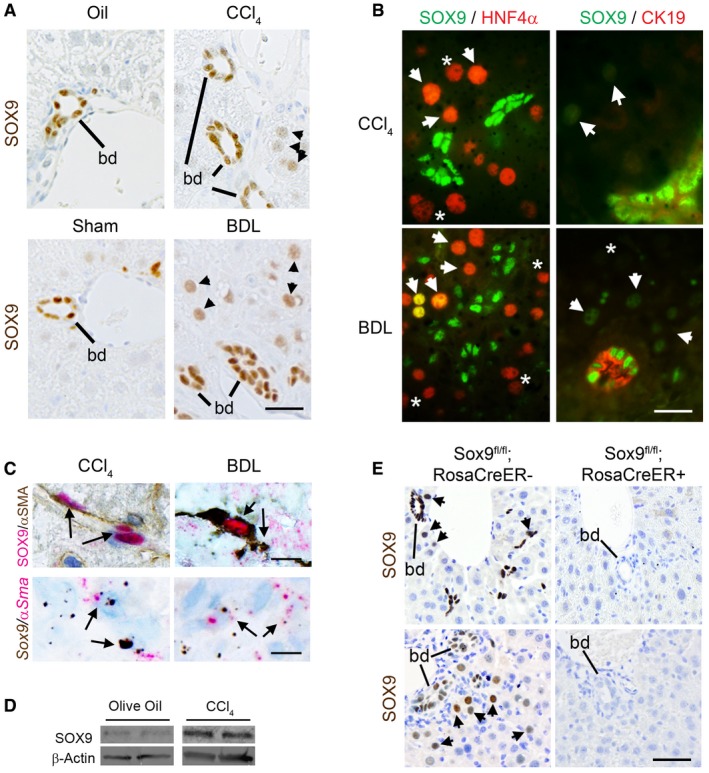
- Immunohistochemistry for SOX9 (brown) in wild‐type (WT) mice following CCl4‐ or BDL‐induced fibrosis. SOX9‐positive bile ducts (bd) and hepatocytes (arrowheads) indicated.
- (Left panel) Immunofluorescence for SOX9 (green) and HNF4α (red) in WT fibrotic mice. Arrowheads (orange/yellow staining) indicate SOX9+/HNF4α+ hepatocytes, and star (*; red) indicates SOX−/HNF4α+ hepatocytes. (Right panel) Immunofluorescence for SOX9 (green nucleus) and CK19 (red cytoplasm) in WT fibrotic mice. Arrowheads (green) indicate SOX9+ hepatocytes, and star (*) indicates SOX− hepatocytes identified by DAPI staining in Appendix Fig S1.
- Co‐localization by immunohistochemistry (top panel) and in situ hybridization (lower panel) for SOX9 (red) and αSMA (brown) in wild‐type (WT) mice following CCl4‐ or BDL‐induced fibrosis.
- Expression of SOX9 protein by immunoblotting of in vivo activated HSCs extracted from WT mice following CCl4 injections compared to olive oil control.
- Immunohistochemistry for SOX9 (brown) in control (Sox9fl/fl;RosaCreER−) or Sox9‐null (Sox9fl/fl;RosaCreER+) mice following fibrosis. Bile ducts (bd) and hepatocytes (arrowheads) indicated. SOX9 is absent, even in bile ducts in Sox9‐null liver.
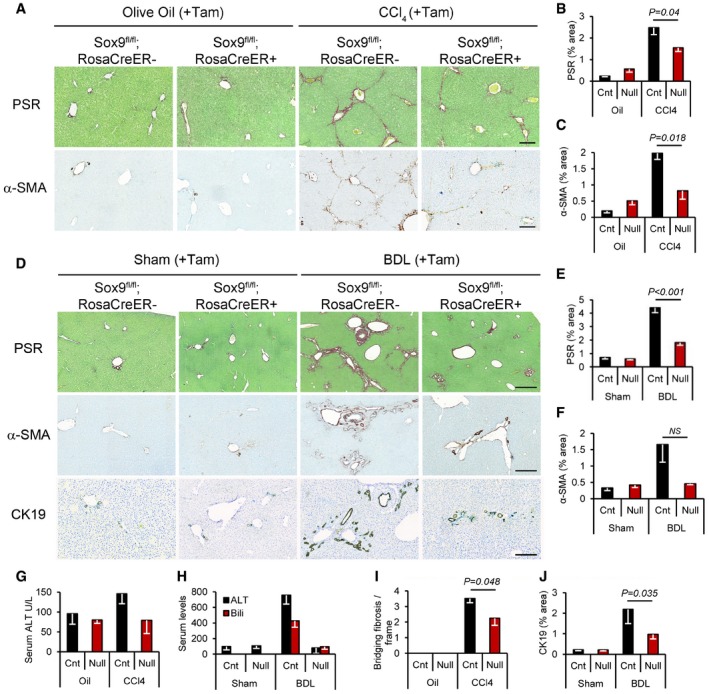
Sox9 null mice develop severe developmental defects and die in the perinatal period (Pritchett et al, 2011). Therefore, we used tamoxifen (Tam) to remove SOX9 expression in Sox9fl/fl;ROSACreER+/− adult mice with Sox9fl/fl;ROSACreER− animals as control. Tamoxifen was injected twice in the week prior to fibrosis induction in both BDL and CCl4 models and every 2 weeks during the 8‐week regime of CCl4 injury. Tamoxifen effectively excised the Sox9 gene and removed SOX9 protein (Fig 2E and Appendix Fig S3). Removal of SOX9 in adult mice did not compromise survival (corroborated by others Mori‐Akiyama et al, 2007). Tamoxifen did not induce ectopic SOX9 expression in uninjured control livers (Appendix Fig S3) or alter SOX9 detection in the HSC/Hep and biliary compartments of injured control livers. Knocking out Sox9 did not alter the liver/body weight ratio in uninjured or fibrotic settings (Appendix Fig S4). In both parenchymal and peribiliary models, fibrosis was clearly improved by loss of Sox9 with reduced deposition of collagen by PSR staining and less surface area covered by αSMA staining (Fig 3A–F). Liver function, assessed by serum biochemistry, was also markedly improved, especially in the BDL model in which serum ALT and bilirubin were normalized (Fig 3G and H). In patients with parenchymal liver injury, scars which extend from one portal tract to another are termed “bridging fibrosis” and, when numerous, are a marker of severity (Ishak fibrosis score ≥ 4 on the IS0‐6 7‐point scale) (Ishak et al, 1995). Loss of SOX9 reduced the incidence of bridging fibrosis induced by CCl4 injury by at least one‐third (Fig 3I), while in BDL, bile duct hyperplasia (assessed by surface area immunostained for CK19) was halved (Fig 3J). In both CCl4 and BDL models, tissue architecture was improved by H&E histology staining and, in keeping with our previous work (Hanley et al, 2008; Pritchett et al, 2012, 2014; Martin et al, 2016), profibrotic COL1 expression was greatly reduced in response to Sox9 loss in vivo and in vitro (Appendix Figs S5–S7).
Figure 3. Loss of Sox9 improves liver fibrosis in vivo .
-
APicrosirius red (PSR) staining (collagen deposition in red) counterstained with fast green (top row) and immunohistochemistry for α‐SMA (brown staining bottom row; activated HSC/myofibroblast marker) in olive oil‐treated (left) or chronic CCl4‐induced fibrosis (right) in control and Sox9‐null mice. Size bars = 200 μm.
-
B, CQuantification of surface area covered by the PSR staining or α‐SMA in control (Cnt) and Sox9‐null (Null) in (A).
-
DPSR staining (red; top row) and immunohistochemistry for α‐SMA (brown; middle row) and CK19 (brown; bottom row) in control and Sox9‐null mice following Sham operation (left) or BDL‐induced fibrosis (right). Size bars = 500 μm.
-
E, FQuantification of surface area covered by the PSR staining or α‐SMA in (D).
-
G, HLiver function is improved in Sox9‐null mice following CCl4 (G)‐ or BDL (H)‐induced fibrosis compared to control mice. Reduction in serum alanine aminotransferase (ALT; G, H) and bilirubin (H) down to levels shown in non‐fibrotic mice (olive oil‐treated groups; oil).
-
ISox9 loss improved severity of fibrosis compared to control mice indicated by quantification of bridging fibrosis in PSR sections following CCl4. Olive oil‐treated mice had no bridging fibrosis, in line with a non‐fibrotic liver histology in (A).
-
JDuctal hyperplasia as quantified by the surface area covered by CK19‐positive ducts in (D) is reduced in Sox9‐null mice compared to control following BDL.
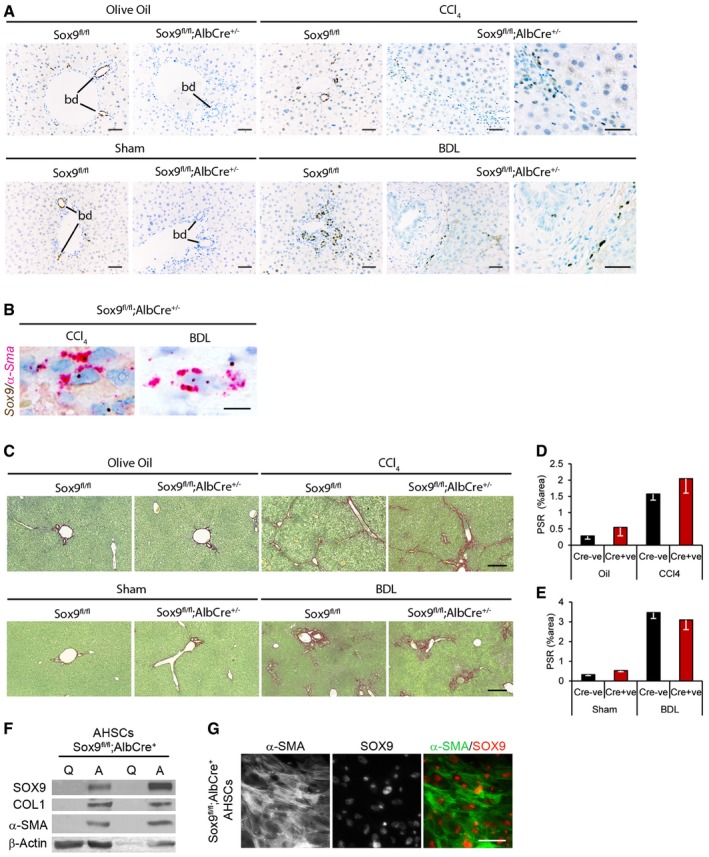
Given the critical developmental role for SOX9 in multiple tissues (Pritchett et al, 2011), it was not possible to knock out SOX9 in HSCs using the currently published PdgfrB, AP2, and LRAT Cre models (Henderson et al, 2013; Mederacke et al, 2013; Moran‐Salvador et al, 2013). PdgfrB expression overlaps SOX9 in neural crest cell (NCC) populations responsible for heart development (Akiyama et al, 2004; Van den Akker et al, 2008; Smith & Tallquist, 2010). In keeping with this, > 80% of our Sox9fl/fl;PdgfrBCre+ mice died at birth. AP2 also has a major role in NCCs (and chondrogenesis) (Wenke & Bosserhoff, 2010; Pritchett et al, 2011). LRAT expression overlaps SOX9 during development [e.g., in liver, lung, pancreas (Batten et al, 2004; Jennings et al, 2013; Pritchett et al, 2011)]. Thus, none of these Cre drivers were suitable for HSC‐specific SOX9 inactivation. In light of this, to determine which of the three SOX9+ liver cell types (cholangiocyte, HSC, and/or Hep) harbored the transcription factor's profibrotic function we took advantage of an AlbuminCre (AlbCre) allele to generate Sox9fl/fl;AlbCre+/− mice, which excised Sox9 from hepatocytes and cholangiocytes (both lineages develop from Alb+ progenitors) but not HSCs (Fig 4A and B, and Appendix Figs S8 and S9). Uninjured adult animals were healthy with normal hepatic and biliary function as expected (Poncy et al, 2015). Fibrotic ECM deposition in Sox9fl/fl;AlbCre+/− mice was as extensive as in control mice in both chronic CCl4 and BDL models (Fig 4C–E). The liver/body weight ratio was unaltered (Appendix Fig S10). Surface area covered by αSMA staining was no different (Appendix Fig S11). SOX9 protein remained in discrete elongated cells in Sox9fl/fl;AlbCre+/− mice, and transcript was localized to αSma + cells (Fig 4A and B, and Appendix Fig S8). To further demonstrate retention of SOX9 in the HSC lineage, in vitro activation of HSCs from Sox9fl/fl;AlbCre+/− livers showed normal induction of SOX9 protein (Fig 4F and G, and Appendix Fig S9). From these combined data in Sox9fl/fl;ROSACreER+/− and Sox9fl/fl;AlbCre+/− mice, we conclude that SOX9's major profibrotic function is in HSCs.
Figure 4. Fibrosis in Sox9fl/fl;AlbCre+/− mice.
-
A–CRepresentative images shown for olive oil‐treated (n = 5) or chronic CCl4 (n = 5)‐induced fibrosis or following sham operation (n = 6 Sox9fl/fl;AlbCre−; n = 5 Sox9fl/fl;AlbCre+) or BDL (n = 5 Sox9fl/fl;AlbCre−; n = 8 Sox9fl/fl;AlbCre+)‐induced fibrosis. SOX9 immunohistochemistry (brown; A), in situ hybridization for Sox9 (brown) and α‐Sma (red) and collagen deposition by PSR staining (red; B) in control (Sox9fl/fl;AlbCre−) or Sox9‐null (Sox9fl/fl;AlbCre+) mice following fibrosis. Higher magnified image of SOX9 localization in discrete cells within the scar is shown for CCl4 and BDL in the Sox9fl/fl;AlbCre+ mice (A).
-
D, EQuantification of surface area covered by the PSR staining in (C).
-
FExpression of SOX9 protein by immunohistochemistry in quiescent (Q) and activated (A) HSCs extracted from Sox9fl/fl;AlbCre+ mice.
-
GIndividual fluorescent channels showing localization and expression of α‐SMA (left panel), SOX9 (middle panel), and composite image for α‐SMA (green) and SOX9 (red) in right panel in activated Sox9fl/fl;AlbCre+ HSCs (genotyping shown in Appendix Fig S9).
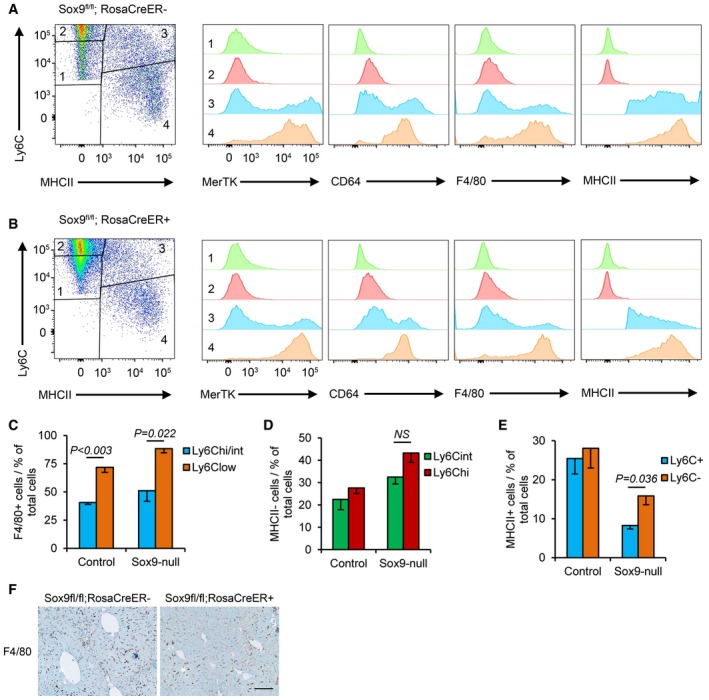
Next, we explored the effect of eliminating SOX9 expression on chronic inflammation in liver fibrosis. In mice, there is a natural tendency for liver fibrosis to resolve after cessation of CCl4 injury reliant on a phenotypic switch in monocyte‐derived liver macrophages from high (profibrotic) to low (“restorative”) Ly6C expression (Ramachandran et al, 2012). This observation was maximal 72‐h post‐CCl4 injection amongst an F4/80+ cell population (Ramachandran et al, 2012). To probe this further, we isolated the monocyte–macrophage lineage (Ly6C+CD64+) from the wider pool of CD45+CD11B+ myeloid cells 72 h after conclusion of a 4‐week program of biweekly CCl4 injections (Appendix Fig S12). The fibrotic livers from control and Sox9 null mice contained four distinct populations according to levels of Ly6C and MHCII, a specific macrophage marker (Fig 5A and B, and Appendix Fig S12). Populations 1 and 2 with intermediate or high Ly6C levels lacked macrophage maturity markers (MerTK, CD64, and F4/80) consistent with infiltrating monocytes (Fig 5A and B). Population 3 (MHCII+Ly6CHi/Int) contained a proportion of cells positive for MerTK, CD64, and F4/80, while virtually all population 4 (the Ly6CLow cells) expressed high levels of the macrophage maturity markers (Fig 5A and B). In fibrotic livers from control mice, sorting by F4/80+ identified more Ly6CLow than Ly6CHigh/int cells consistent with previous work (Ramachandran et al, 2012; Fig 5C). However, by MHCII sorting, the proportion of Ly6CHi/+ and Ly6CInt/− cells were equivalent (Fig 5D and E). Against this backdrop, we scrutinized chronic inflammation in the tamoxifen‐treated Sox9fl/fl;ROSACreER+/− mice. The size of the monocyte–macrophage infiltrate in the liver was similar [i.e., the sum of populations 1–4 was unchanged (Fig 5D and E)]. However, populations 1 and 2 were expanded, while populations 3 and 4 were diminished (visible in Fig 5A and B and quantified in Fig 5D and E). The intensity of F4/80 immunostaining was also reduced in the absence of SOX9 (Fig 5F). As SOX9 is not expressed in the hematopoietic lineage, the implications of these data are twofold: that monocyte recruitment following injury is unaffected; however, in the context of SOX9‐dependent reduced scarring and improved liver function, maturation of macrophages is blocked.
Figure 5. Ly6Clow pro‐resolution macrophages predominate in Sox9‐null animals.
-
A, BFlow cytometry of CD45+ CD11B+ cells in control (Sox9fl/fl;RosaCre−; A) and Sox9‐null (Sox9fl/fl;RosaCre+; B) livers stained for Ly6C and MHCII (far left) to identify four populations of cells with differences in their expression of MerTK, CD64, F4/80, and MHCII.
-
CGraphical representation of Ly6C and F4/80 staining in macrophages from populations 3 and 4.
-
D, EGraphical representation of cell numbers in the four Ly6C and MHCII cell populations in control and Sox9‐null livers. Data are representative of four independent experiments.
-
FF4/80 immunohistochemistry (brown staining) in control and Sox9‐null mice livers following 4‐week CCl4‐induced fibrosis. Size bar = 100 μm.
Mechanosensitive signaling regulates SOX9 via YAP1 during liver fibrosis
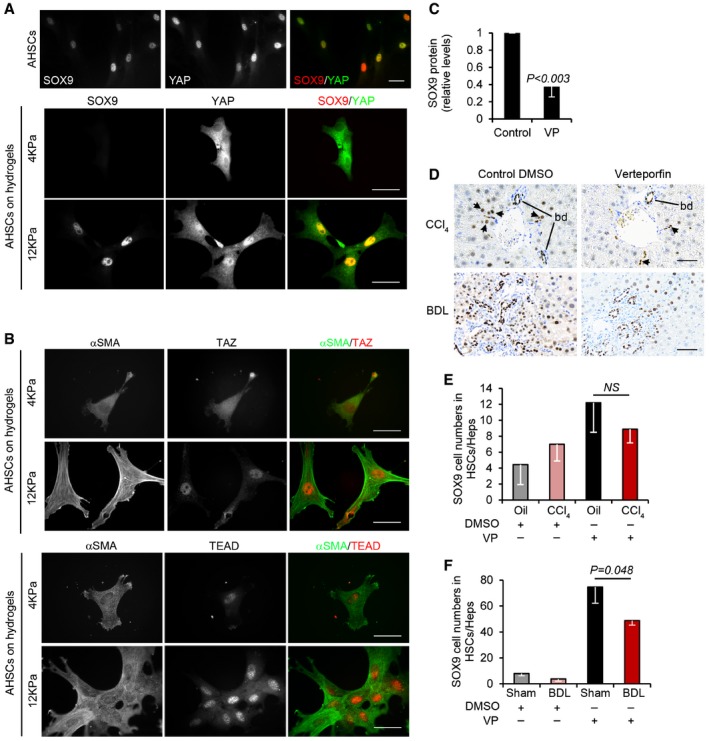
We have previously shown SOX9 is induced by the key profibrotic signaling factors transforming growth factor beta (TGF‐β) and hedgehog (HH). To explore this further, we reasoned that upregulated SOX9, and consequently increased ECM deposition, in fibrotic liver might relate to tissue stiffness. Therefore, we extracted HSCs and cultured them on acrylamide hydrogels to model normal liver elasticity or the fibrotic environment at 4 or 12 kPa, respectively. Yes‐associated protein‐1 (YAP1) is a mechanosensitive transcription factor that when dephosphorylated is nuclear and active with co‐factors, transcriptional coactivator with PDZ‐binding motif (TAZ, also known as WWTR1) and TEA domain factor (TEAD). In contrast, when phosphorylated, YAP1 is cytoplasmic and inactive. In HSCs cultured on 4 kPa hydrogels, YAP1 was cytoplasmic, SOX9 not detected, and αSMA, TAZ, and TEAD only weakly present (Fig 6A and B). In stark contrast, under the 12 kPa conditions modeling fibrosis, YAP1, TAZ, and TEAD were robustly detected in the nucleus with cytoplasmic αSMA (Fig 6A and B). Moreover, when YAP1:TEAD complexes were disrupted using their specific inhibitor, verteporfin, SOX9 protein levels were reduced by 60% in activated HSCs (Fig 6C). Previous studies by us and others have shown that verteporfin improves aspects of liver fibrosis in vivo (Mannaerts et al, 2015; Martin et al, 2016). In the setting of verteporfin treatment, SOX9 counts were reduced in the HSC/Hep compartment in both CCl4‐induced liver injury and BDL (Fig 6E and F).
Figure 6. YAP signaling regulates SOX9.
-
A, BImmunofluorescence of activated mouse HSCs cultured on plastic (A) or hydrogels (A, B). Individual fluorescent channels showing localization and expression of SOX9 (left), YAP (middle), and composite image for SOX9 (red) and YAP (green) in right panel. (B) Individual and composite images for αSMA (green) and TAZ (red) or TEAD (red). Size bars, 25 μm.
-
CQuantified decrease in SOX9 protein levels following inhibition of YAP using verteporfin (VP) in activated mouse HSCs expressed relative to DMSO control (n = 3).
-
DImmunohistochemistry for SOX9 (brown) following CCl4‐ or BDL‐induced fibrosis in mice treated with DMSO (CCl4 n = 4, BDL n = 7) or verteporfin (CCl4 n = 3, BDL n = 5). Size bar, 50 μm.
-
E, FQuantification of SOX9 cell numbers in the HSC/Hep population.
Discussion
SOX9 is a key transcription factor regulating multiple components of the ECM during normal development and in studies modeling isolated HSC function in vitro (Hanley et al, 2008; Pritchett et al, 2012). Here, we studied the requirement for SOX9 in vivo in liver fibrosis. Several conclusions can be drawn. Firstly, loss of SOX9 in vivo abrogated fibrosis in response to liver injury. SOX9 expression was restricted to cholangiocytes, and post‐injury HSCs and some hepatocytes (most likely regenerative). There was no impact from eliminating SOX9 in hepatocytes and cholangiocytes [which furthers the argument against epithelial‐to‐mesenchymal transition as a significant mechanism for liver fibrosis (Scholten et al, 2010; Taura et al, 2010; Wells, 2010)]. Our data point toward the HSC as the causative cell type‐mediating fibrosis and that this lineage emerges separately from albumin‐expressing hepatobiliary precursors (Yin et al, 2013). Unaltered biliary hyperplasia in our injured Sox9fl/fl;AlbCre+/− mice also implies that SOX9 is not an intrinsic requirement for post‐injury proliferation of cholangiocytes.
To translate, the functional requirement for SOX9 in fibrosis from mouse to human is challenging. Genetic evidence in human would require inactivating mutations or haploinsufficiency protecting against liver fibrosis, but campomelic dysplasia is a multisystem disorder lethal around birth (Foster et al, 1994; Wagner et al, 1994). Activating mutations or duplications of the SOX9 locus (a cause of 46,XX disorder of sex development) that might promote liver fibrosis are exceptionally rare and lack the additional context of liver injury. Our data on a cohort of patients with serial biopsies over time and variable fibrosis progression (Ghany et al, 2009; Liang & Ghany, 2013) provide three strands of evidence that SOX9's role in liver fibrosis in mouse seems likely in human: The profile of SOX9 detection following liver injury in patients was identical to that observed in mouse; the prevalence of de novo SOX9 expression in biopsies correlated precisely with fibrosis severity; and thirdly, the extent of SOX9 at early stages of disease predicted progression within 3 years. Indeed, the SOX9 index performed better than other fibrosis risk factors and could potentially assist the stratification of patients with liver fibrosis alongside other measures, such as the cirrhosis risk score (Huang et al, 2007; Marcolongo et al, 2009; Trepo et al, 2011).
Taken together, our data support a model whereby injury induces SOX9 downstream of YAP1 in HSCs to promote liver fibrosis. Our data open up the potential for SOX9 and its dependent pathways as biomarkers or as targets for lessening liver scarring, improving hepatic chronic inflammation and halting the progression of liver fibrosis toward cirrhosis.
Materials and Methods
Study design
The goal of this study was to provide comprehensive evidence in vivo in mouse and human that the transcription factor SOX9 and its associated pathways promote liver fibrosis and its progression toward cirrhosis. All experiments were blinded to the person analyzing the data. For animal experiments, where possible, the minimum number of animals per fibrosis protocol was five based on accepting an 80% chance of detecting a 30% change in collagen content from normal versus fibrotic animals at the level of P ≥ 0.05. However, where additional animals have been available, we have included these in our analysis to improve power and our ability to statistically detect smaller physiological effects.
For all human studies, informed consent was obtained from all subjects (including embryonic and fetal tissue) and experiments conformed to the principals set out in the WMA Declaration of Helsinki and the Department of Health and Human Services Belmont Report.
Animal experiments
All mouse strains were maintained on a C57BL/6J background in a 12‐h light–dark cycle with water and food provided ad libitum. Sox9fl/fl mice were a kind gift from Professor Gerd Scherer (Kist et al, 2002). RosaCreER (Seibler et al, 2003) and AlbuminCre (Postic et al, 1999) were purchased from Jackson Laboratories. To allow inducible global Sox9 deletion, Sox9fl/fl mice were crossed with RosaCreER mice to generate Sox9fl/fl;RosaCreER animals. To delete Sox9 in cholangiocytes and hepatocytes, Sox9fl/fl mice were crossed with AlbCre mice to give Sox9fl/fl;AlbCre+/− animals. REDExtract‐N‐AMP™ Tissue PCR kit (Sigma, UK) was used to genotype DNA prepared from ear clips. Three primers were used to detect Sox9 floxed alleles and recombination events (Reverse: CGCTGGTATTCAGGGAGGTACA; F1: CTCCGGTAGCAAAGGCGTTTAG; F2: CCGGCTGCTGGGAAAGTATATG). Reverse and F1 gave a 314‐bp product only if recombination had occurred. Reverse and F2 gave either a 247‐bp product (wild type) or a 419‐bp (floxed allele) product (Kist et al, 2002). For RosaCreER genotyping, forward (CCATCATCGAAGCTTCACTGAAG) and reverse (GGAGTTTCAATACCCGAGATCATGC) primers gave a 310‐bp product. To keep the possibility of spontaneous Cre activity in the absence of tamoxifen to a minimum, only RosaCreER heterozygote animals were used. To allow detection of the wild‐type Rosa26 allele and to confirm animals were heterozygous wild type, forward (CATGTCTTTAATCTACCTCGATGG) and reverse primers (CTCTTCCCTCGTGATCTGCAACTCC) were used to give a 299‐bp product. To delete Sox9 in cholangiocytes and hepatocytes, Sox9fl/fl mice were crossed with AlbCre mice to give Sox9fl/fl:AlbCre+/− animals. Only heterozygous animals were used, and genotype was confirmed using three primers (common Cre reverse: TCGTTGCATCGACCGGTAAT; Albumin gene reverse: TAGCATGGTCGAGCAGGCAG; Albumin promoter forward: AGAGCGAGTCTTTCTGCACACAG) which gives a 430‐bp product in the presence of the wild‐type albumin allele and a 200‐bp product in the presence of the AlbCre allele.
Animals were housed and maintained and animal experiments performed under approval from the University of Manchester Ethical Review Committee and in accordance with UK Government Home Office license for animal research. Carbontetrachloride (CCl4) or bile duct ligation (BDL) was used to induce chronic liver fibrosis in age‐matched male mice (between 8 and 14 weeks old at the start of experiments), and YAP signaling was interrogated during fibrosis using verteporfin (VP) (Sigma, UK) as previously described (Martin et al, 2016). All randomly assigned experimental and controls were littermate sex‐ and age‐matched mice.
For CCl4 fibrosis was induced by 2‐μl intraperitoneal (i.p.) injections of sterile CCl4 (Sigma, UK) per g body weight in a ratio of 1:3 by volume in olive oil, or olive oil alone (control) twice weekly for 8 weeks. Tissue and serum were collected at the end of the experiments. For BDL‐induced fibrosis, under anesthesia two ligatures were placed around the exposed bile duct. Sham (control) animals underwent the same procedure without ligation of the bile duct. To improve post‐operative survival, animals were kept in a thermoneutral warm cabinet (30°C) following BDL, and given soaked diet. Tissue and serum were collected 14 days after surgery.
To induce activation of Cre and global deletion of Sox9 in Sox9fl/fl;RosaCreER animals, tamoxifen (Sigma, UK) was given by i.p injection. To control for any unexpected effects of tamoxifen, both Sox9fl/fl;RosaCreER+/− and Sox9fl/fl;RosaCreER−/− animals were injected. For CCl4, 4 mg tamoxifen (20 mg/ml in olive oil) was injected 8 and 7 days before the first CCl4 injection (Day 0). Subsequent 2 mg doses were given fortnightly, starting on day 6, for the duration of the experiment. For BDL, 4 mg tamoxifen (20 mg/ml in olive oil) was injected i.p. 8 and 7 days prior to surgery. 2 mg was injected i.p. 7 days after surgery.
For both CCl4 and BDL models of fibrosis in Sox9fl/fl;RosaCreER animals, there were four experimental groups. CCl4: Sox9fl/fl;RosaCreER−/− Olive Oil (n = 6); Sox9fl/fl;RosaCreER+/− Olive Oil (n = 6), Sox9fl/fl;RosaCreER−/− CCl4 (n = 5), and Sox9fl/fl;RosaCreER+/− CCl4 (n = 8). BDL: Sox9fl/fl;RosaCreER−/− Control (n = 5); Sox9fl/fl;RosaCreER+/− Control (n = 5), Sox9fl/fl;RosaCreER−/− BDL (n = 7), and Sox9fl/fl;RosaCreER+/− BDL (n = 5). To determine the effects of deleting Sox9 in both cholangiocytes and hepatocytes, CCl4 or BDL were used to induce liver fibrosis in Sox9fl/fl;AlbCre−/− and Sox9fl/fl;AlbCre+/− mice. For both models of fibrosis, this gave four experimental groups. CCl4: Sox9fl/fl;AlbCre−/− olive oil (n = 5); Sox9fl/fl;AlbCre+/− olive oil (n = 5), Sox9fl/fl;AlbCre−/− CCl4 (n = 5) and Sox9fl/fl;AlbCre+/− CCl4 (n = 5). BDL: Sox9fl/fl;AlbCre−/− sham (n = 6); Sox9fl/fl;AlbCre+/− sham (n = 5), Sox9fl/fl;AlbCre−/− BDL (n = 5) and Sox9fl/fl;AlbCre+/− BDL (n = 8). A minimum of 5 mice were used per group. Recombination status and genotype were confirmed by PCR of DNA extracted from liver tissue.
To interrogate YAP signaling during fibrosis, in vivo verteporfin (VP) (Sigma, UK) was injected by i.p. (Martin et al, 2016). Wild‐type C57BL/6J mice (Charles River, UK) were given i.p. CCl4 or olive oil vehicle control as described above [and described previously (Martin et al, 2016)] for a period of 6 weeks; or bile duct ligated. 10 μl/g body weight of 10 mg/ml VP in 10% DMSO in PBS was injected i.p. three times weekly during the last 3 weeks of CCl4 treatment (on alternate days to CCl4 or olive oil), or every 48 h starting on day 7 after BDL, to give a dose of 100 mg/kg body weight. Control mice were injected with 10 μl/g body weight of 10% DMSO in PBS. This gave four treatment groups for each model of liver fibrosis. CCl4: olive oil with DMSO (n = 5); olive oil with VP (n = 3), CCl4 with DMSO (n = 3); and CCl4 with VP (n = 4). BDL: sham with DMSO (n = 8), sham with VP (n = 4), BDL with DMSO (n = 7), BDL with VP (n = 5). Levels of fibrosis and liver function serum tests have been previously described for these animals (Martin et al, 2016).
Liver tissue from all in vivo experiments was fixed in 4% PFA and processed for histology as previously reported (Martin et al, 2016).
Primary cell extraction and culture
Primary rat and mouse (Male Sprague Dawley, Charles River, UK) hepatic stellate cells (rHSCs/mHSCs, respectively) or mouse in vivo activated HSCs were isolated and cultured as previously described (Hanley et al, 2008; Pritchett et al, 2012; Martin et al, 2016). To interrogate YAP1 signaling, verteporfin (VP) (Sigma, UK) was used to disrupt YAP1:TEAD complexes (Liu‐Chittenden et al, 2012). HSCs were cultured for 8 days, treated with 10 μM VP or vehicle control for 24 h and then harvested for protein or qPCR analysis. To model changes in mechanical stiffness, HSCs were seeded on gels of varying stiffness (4 or 12 kPa, Cell Guidance Systems, UK). HSCs were then harvested for protein or qPCR analysis, or fixed with 4% paraformaldehyde (Pritchett et al, 2014) for immunofluorescence.
Protein expression
Protein expression was analyzed as previously described (Martin et al, 2016). Antibodies used were raised against SOX9 (Millipore AB5535 1:5,000) and anti‐rabbit HRP‐conjugated secondary antibody (GE Healthcare NA934V 1:10,000). Quantity One software (Bio‐Rad) was used for image acquisition and data analysis. HRP‐conjugated anti‐β‐actin antibody (Sigma A3854 1:30,000) was used as a loading control.
Immunohistochemistry and immunocytochemistry
Tissue samples were fixed in 4% paraformaldehyde and processed either for paraffin embedding and sectioning. Livers were embedded in identical orientation to allow direct comparison of tissue. For paraffin sections, tissue was dehydrated and embedded in paraffin. Cells cultured on chamber slides were fixed in 4% paraformaldehyde and stored at 4°C in PBS. For diaminobenzidine (DAB) labeling, only tissue sections were incubated in 3% (v/v) H2O2 (Sigma, UK) to quench endogenous peroxidase activity. Antigen retrieval was carried out by boiling in 10 mM sodium citrate (pH 6) for 10 min, except for EpCAM IHC, for which antigen retrieval was performed using pepsin reagent (Sigma, UK) at 37°C for 10 min. Antigen retrieval was not performed on cells grown on hydrogels. Tissue sections or cells were incubated in primary antibody in 0.1% Triton X‐100 in PBS containing 3% serum (serum was from the same species the secondary antibody was raised in), overnight at 4°C. Antibodies used were anti‐CK19 (Developmental Studies Hybridoma Bank 1:300), anti‐CK7‐FITC (Abcam AB118958 1:50), anti‐EpCAM (Leica Novocastra NCL‐ESA 1:200), anti‐F4/80 (Abcam AB6640 1:500), anti‐HNF4α (R&D Systems PP‐H1415‐00 1:100), anti‐SOX9 (Millipore AB5535 1:2,000), anti‐TAZ (Cell Signaling #4883 1:1,000), anti‐TEAD (Cell Signaling #12292 1:1,000), anti‐YAP1 (Santa Cruz Sc‐1011199 1:200), anti‐α1AT (Bethyl Labs A80‐122A 1:1,000), anti‐α‐SMA (ICC: Leica Novocastra SMA‐R‐7‐CE 1:100; IHC: DAKO M0851 1:100), and anti‐COL1 (IHC: Southern Biotech 1310‐01 1:100). For α‐SMA IHC on mouse tissue sections, Mouse on Mouse basic detection kit (Vector Laboratories) and Vectastain Elite Avidin Biotin Complex (ABC) system (Vector Laboratories) were used. For bright‐field αSMA/SOX9 dual, the Mouse on Mouse Impress HRP polymer kit (MP‐2400) and Impress AP anti‐rabbit (alkaline phosphatase) Polymer Detection kit (MP‐5401)/Impact Vector Red AP substrate (SK‐5105; all from Vector Laboratories) were used, respectively. After DAB (or Red AP) labeling tissue was counterstained with Toluidine Blue. For immunofluorescence, secondary antibodies used were 488 or 594 Alexa Fluors (Molecular Probes, Invitrogen) raised against the appropriate species (1:1,000).
In situ mRNA hybridization
In situ detection of Sox9 and αSma RNA transcripts was carried out on paraffin‐embedded tissue sections using the RNAScope assay (Advanced Cell Diagnostics). Sections were pretreated using an extended protease treatment and hybridized under conditions as described (RNAScope Sample Preparation and Pretreatment Guide) using automated RNAScope probes for Sox9, αSma, and standard negative Dapb (a bacterial gene) and positive Ppib control probes. Detection was by RNAScope LS 2.5 Duplex red/brown Assay for the Leica Bond RX autostainer (Catalog no. 322440) and Bond Polymer Refine Red (DS9390) and Brown DAB (DS9800). Slides were counterstained with hematoxylin.
Histology and analysis
Slides for morphological analysis were stained with hematoxylin and eosin (H & E) as previously described (Piper et al, 2004). Fast green picrosirius red (PSR) was used to stain liver sections for collagen (Pritchett et al, 2014; Martin et al, 2016). The extent of scarring was determined by morphometric analysis of PSR and myofibroblast accumulation by surface area covered by α‐SMA staining. The 3D Histech Panoramic 250 Flash II slide scanner was used to acquire images of all three liver lobes on each slide. At 10× magnification, 10 images were selected from each slide at random and analyzed with Adobe Photoshop. Stained pixels were selected using the Colour Range tool and expressed as a fraction of the total number of pixels. Analysis was performed blind following randomization of slides and the acquired images.
FACS
Mononuclear blood cells (MNCs) were prepared from whole livers of ROSACreER−/− and ROSACreER+/− mice following 4 weeks’ CCl4 treatment as described above. Animals were perfused with HBSS (0.5 mM EDTA) via the left ventricle of the heart 72 h after the final CCl4 injection. Liver tissue was incubated with 5 ml/g digestion buffer (0.8 U/ml Liberase‐TM (Roche), 160 U/ml DNase I Type IV (Sigma) in HBSS) for 30 min at 37°C. After homogenization using a 100‐μm cell strainer and subsequent wash steps, MNCs were purified by centrifugation in a 33% Percoll density gradient. Red blood cells were lysed using RBC Lysis buffer (Sigma). Following FCR block, cells were stained for 30 min on ice with antibodies of interest at the appropriate dilutions as determined by titration: B220‐BV785 (1:100 Biolegend), CD11b‐BV711 (1:450 Biolegend), CD11c‐BV605 (1:200 Biolegend), CD45‐AF700 (1:400 eBioscience), CD64‐PE (1:100 Biolegend), F4/80‐APC (1:300 eBioscience), Ly‐6C‐PE/Cy7 (1:500 Biolegend), Ly‐6G‐PerCP/eF710 (1:400 eBioscience), MerTK‐Biotin (1:100 R&D Systems), MHCII‐eF450 (1:500 eBioscience), Siglec‐F‐PE/CF594 (1:400 BD Biosciences), Streptavidin‐PE/Cy5 (Biolegend). Cells were washed in PBS and analyzed (BD FACS LSR Fortessa and FlowJo software). Compensation was performed using UltraComp eBeads (eBioscience). Cells passed through the cytometer were gated by granularity and size to select single cells. Live/Dead Blue (Invitrogen) was used to select live cells. CD45+ cells were gated as shown in Appendix Fig S7 to eliminate eosinophils, neutrophils, and B cells. CD64+ Ly6C+ monocytes and macrophages were selected from the Cd45+ Cd11b+ myeloid population for further analysis.
Human embryonic and fetal tissue
Human embryonic and fetal tissue was collected, used, and stored with ethical approval from the North West Research Ethics Committee, following codes of practice given by the Human Tissue Authority under the legislation of the UK Human Tissue Act 2008. Tissue collection and handling was as previously described (Piper et al, 2004; Hanley et al, 2008; Jennings et al, 2013). Briefly, following medical or surgical terminations of pregnancy, human embryos and fetal tissues were collected and fixed in 4% paraformaldehyde and embedded in paraffin wax for sectioning at 5‐μm intervals.
Human liver biopsy collection and cell counting
Paired human liver biopsies were obtained with informed consent and ethical approval from the Trent Cohort Study of HCV antibody‐positive patients from across the former UK Trent Health Region (Mohsen, 2001; Ryder et al, 2004). Patient selection and data collection have been described previously (Mohsen, 2001; Ryder et al, 2004; Williams et al, 2009). Patients who received intervening therapy or were infected with human immunodeficiency virus (HIV) were excluded (Ryder et al, 2004). Liver biopsies were assessed blindly by one of three histopathologists (Ryder et al, 2004). Biopsy specimens > 1.5 cm long with ≥ 5 portal tracts that stained for SOX9 by IHC were digitized using a Nanozoomer 2.0‐HT slide scanner and viewed with the accompanying imager (Hamamatsu, Japan). In stained biopsy sections, five portal tract regions were selected per slide at 200× magnification leading to the analysis of 0.28 mm2 per portal tract, within which all SOX9‐positive cells were counted and categorized by location within or outside bile ducts to provide a mean ± standard error (“SOX9 index”). The SOX9 index was determined with no prior knowledge of disease stage, whether initial or follow‐up biopsy or whether fibrosis had progressed.
Statistics
For in vivo experiments, two‐way ANOVA followed by Bonferroni post hoc analysis was used to determine statistical significance. For FACS experiments, significance was calculated using unpaired t‐tests with Welch's correction. Unless otherwise stated, for all other experiments statistical significance was determined by two‐tailed Student's t‐test. All experiments were carried out three times or more (n = 3) as indicated.
For analysis of SOX9 in human liver biopsies, statistical analysis (SPSS version 19) used either a paired two‐tailed Student's t‐test (paired data) or a chi‐squared (χ2) test (categorical data). In groups with 3 or more nominal variables, means were compared by one‐way analysis of variance (ANOVA) with Tukey's honest significance test (HSD) post hoc correction. Ordinal logistical regression analysis was used to evaluate the relationship between SOX9 cell count and the progression of liver fibrosis categorized by Ishak stage with McFadden R 2 indicating the degree of correlation. Area under the receiver operator curve (AUROC) was used to quantify the potential of the SOX9 count to predict progression of liver fibrosis between initial and follow‐up biopsy. Logistic regression (STATA version 10) examined the impact of a number of factors on the likelihood of showing disease progression. Results were reported as odds ratios (OR) with 95% confidence intervals (CI).
Author contributions
KPH and NAH conceived and designed experiments. VSA and JP contributed to experimental planning and design. KM, AMZ, AM, AP‐A, GD, SLF, WLI, and ING provided reagents and contributed to experimental design. VSA, JP, JL, KM, SMAR, APA LJB, AFM, KS, and LP performed experiments. VSA, JP, JL, AP‐A, and KPH analyzed the data. VSA and EC performed statistical analysis. KPH and NAH guided experiments, analyzed data, and wrote the manuscript.
Conflict of interest
The authors declare that they have no conflict of interest.
The paper explained.
Problem
Liver fibrosis is a major, increasing cause of death characterized by extracellular matrix (ECM) secretion from myofibroblasts that causes scarring and, ultimately, organ failure requiring transplant. Although potentially reversible, predicting progression is limited and there are currently no approved antifibrotic therapies to treat the disease. To address, this requires in vivo knowledge of the core molecular mechanisms that regulate fibrosis.
Results
SOX9 is a key transcription factor regulating expression of multiple ECM components during normal development and in studies modeling isolated liver myofibroblast function in vitro. Here, we show that prevalence of SOX9 in biopsies from patients with chronic liver disease correlates with fibrosis severity and accurately predicts disease progression toward cirrhosis. Inactivation of Sox9 in mice protects against both parenchymal and biliary fibrosis, improves liver function, and ameliorates chronic inflammation. Using multiple transgenic models to inactivate SOX9, results support hepatic myofibroblasts as the causative cell type‐mediating fibrosis.
Impact
This study addresses an area of enormous unmet clinical need. SOX9 outperformed all other current measures predicting outcome in liver fibrosis and would allow novel patient stratification for care and treatment. Our data support a critical role for SOX9 in liver myofibroblasts to promote liver fibrosis and open up the potential for SOX9 and its dependent pathways as biomarkers or antifibrotic targets for improving liver scarring.
Supporting information
Appendix
Expanded View Figures PDF
Table EV1
Source Data for Appendix
Review Process File
Source Data for Figure 2
Source Data for Figure 4
Acknowledgements
This work was supported by the Medical Research Council (MRC; KPH, MR/J003352/1 & MR/P023541/1; KM and VSA are MRC Clinical Training Fellows; SR is a KRUK Clinical Training Fellow); the Manchester Biomedical Research Centre and the Wellcome Trust (NAH, WT088566MA). The Core Histology Facility at the University of Manchester is acknowledged for their technical help and support. We acknowledge technical assistance from Kara Simpson.
EMBO Mol Med (2017) 9: 1696–1710
References
- Akiyama H, Chaboissier MC, Behringer RR, Rowitch DH, Schedl A, Epstein JA, de Crombrugghe B (2004) Essential role of Sox9 in the pathway that controls formation of cardiac valves and septa. Proc Natl Acad Sci USA 101: 6502–6507 [DOI] [PMC free article] [PubMed] [Google Scholar]
- Antoniou A, Raynaud P, Cordi S, Zong Y, Tronche F, Stanger BZ, Jacquemin P, Pierreux CE, Clotman F, Lemaigre FP (2009) Intrahepatic bile ducts develop according to a new mode of tubulogenesis regulated by the transcription factor SOX9. Gastroenterology 136: 2325–2333 [DOI] [PMC free article] [PubMed] [Google Scholar]
- Batten ML, Imanishi Y, Maeda T, Tu DC, Moise AR, Bronson D, Possin D, Van Gelder RN, Baehr W, Palczewski K (2004) Lecithin‐retinol acyltransferase is essential for accumulation of all‐trans‐retinyl esters in the eye and in the liver. J Biol Chem 279: 10422–10432 [DOI] [PMC free article] [PubMed] [Google Scholar]
- Carpentier R, Suner RE, Van Hul N, Kopp JL, Beaudry JB, Cordi S, Antoniou A, Raynaud P, Lepreux S, Jacquemin P et al (2011) Embryonic ductal plate cells give rise to cholangiocytes, periportal hepatocytes and adult liver progenitor cells. Gastroenterology 41: 1432–1438 [DOI] [PMC free article] [PubMed] [Google Scholar]
- De Minicis S, Seki E, Uchinami H, Kluwe J, Zhang Y, Brenner DA, Schwabe RF (2007) Gene expression profiles during hepatic stellate cell activation in culture and in vivo . Gastroenterology 132: 1937–1946 [DOI] [PubMed] [Google Scholar]
- Ellis EL, Mann DA (2012) Clinical evidence for the regression of liver fibrosis. J Hepatol 56: 1171–1180 [DOI] [PubMed] [Google Scholar]
- Font‐Burgada J, Shalapour S, Ramaswamy S, Hsueh B, Rossell D, Umemura A, Taniguchi K, Nakagawa H, Valasek MA, Ye L et al (2015) Hybrid periportal hepatocytes regenerate the injured liver without giving rise to cancer. Cell 162: 766–779 [DOI] [PMC free article] [PubMed] [Google Scholar]
- Foster JW, Dominguez‐Steglich MA, Guioli S, Kwok C, Weller PA, Stevanovic M, Weissenbach J, Mansour S, Young ID, Goodfellow PN et al (1994) Campomelic dysplasia and autosomal sex reversal caused by mutations in an SRY‐related gene. Nature 372: 525–530 [DOI] [PubMed] [Google Scholar]
- Friedman SL (2008) Mechanisms of hepatic fibrogenesis. Gastroenterology 134: 1655–1669 [DOI] [PMC free article] [PubMed] [Google Scholar]
- Furuyama K, Kawaguchi Y, Akiyama H, Horiguchi M, Kodama S, Kuhara T, Hosokawa S, Elbahrawy A, Soeda T, Koizumi M et al (2011) Continuous cell supply from a Sox9‐expressing progenitor zone in adult liver, exocrine pancreas and intestine. Nat Genet 43: 34–41 [DOI] [PubMed] [Google Scholar]
- Ghany MG, Strader DB, Thomas DL, Seeff LB (2009) Diagnosis, management, and treatment of hepatitis C: an update. Hepatology 49: 1335–1374 [DOI] [PMC free article] [PubMed] [Google Scholar]
- Hanley KP, Oakley F, Sugden S, Wilson DI, Mann DA, Hanley NA (2008) Ectopic SOX9 mediates extracellular matrix deposition characteristic of organ fibrosis. J Biol Chem 283: 14063–14071 [DOI] [PubMed] [Google Scholar]
- Henderson NC, Arnold TD, Katamura Y, Giacomini MM, Rodriguez JD, McCarty JH, Pellicoro A, Raschperger E, Betsholtz C, Ruminski PG et al (2013) Targeting of alphav integrin identifies a core molecular pathway that regulates fibrosis in several organs. Nat Med 19: 1617–1624 [DOI] [PMC free article] [PubMed] [Google Scholar]
- Huang H, Shiffman ML, Friedman S, Venkatesh R, Bzowej N, Abar OT, Rowland CM, Catanese JJ, Leong DU, Sninsky JJ et al (2007) A 7 gene signature identifies the risk of developing cirrhosis in patients with chronic hepatitis C. Hepatology 46: 297–306 [DOI] [PubMed] [Google Scholar]
- Iredale JP (2007) Models of liver fibrosis: exploring the dynamic nature of inflammation and repair in a solid organ. J Clin Invest 117: 539–548 [DOI] [PMC free article] [PubMed] [Google Scholar]
- Ishak K, Baptista A, Bianchi L, Callea F, De Groote J, Gudat F, Denk H, Desmet V, Korb G, MacSween RN et al (1995) Histological grading and staging of chronic hepatitis. J Hepatol 22: 696–699 [DOI] [PubMed] [Google Scholar]
- Jennings RE, Berry AA, Kirkwood‐Wilson R, Roberts NA, Hearn T, Salisbury RJ, Blaylock J, Piper Hanley K, Hanley NA (2013) Development of the human pancreas from foregut to endocrine commitment. Diabetes 62: 3514–3522 [DOI] [PMC free article] [PubMed] [Google Scholar]
- Jors S, Jeliazkova P, Ringelhan M, Thalhammer J, Durl S, Ferrer J, Sander M, Heikenwalder M, Schmid RM, Siveke JT et al (2015) Lineage fate of ductular reactions in liver injury and carcinogenesis. J Clin Invest 125: 2445–2457 [DOI] [PMC free article] [PubMed] [Google Scholar]
- Kawaguchi Y (2013) Sox9 and programming of liver and pancreatic progenitors. J Clin Invest 123: 1881–1886 [DOI] [PMC free article] [PubMed] [Google Scholar]
- Kisseleva T, Cong M, Paik Y, Scholten D, Jiang C, Benner C, Iwaisako K, Moore‐Morris T, Scott B, Tsukamoto H et al (2012) Myofibroblasts revert to an inactive phenotype during regression of liver fibrosis. Proc Natl Acad Sci USA 109: 9448–9453 [DOI] [PMC free article] [PubMed] [Google Scholar]
- Kist R, Schrewe H, Balling R, Scherer G (2002) Conditional inactivation of Sox9: a mouse model for campomelic dysplasia. Genesis 32: 121–123 [DOI] [PubMed] [Google Scholar]
- Lee UE, Friedman SL (2011) Mechanisms of hepatic fibrogenesis. Best Pract Res Clin Gastroenterol 25: 195–206 [DOI] [PMC free article] [PubMed] [Google Scholar]
- Lee YA, Wallace MC, Friedman SL (2015) Pathobiology of liver fibrosis: a translational success story. Gut 64: 830–841 [DOI] [PMC free article] [PubMed] [Google Scholar]
- Liang TJ, Ghany MG (2013) Current and future therapies for hepatitis C virus infection. N Engl J Med 368: 1907–1917 [DOI] [PMC free article] [PubMed] [Google Scholar]
- Liu‐Chittenden Y, Huang B, Shim JS, Chen Q, Lee SJ, Anders RA, Liu JO, Pan D (2012) Genetic and pharmacological disruption of the TEAD‐YAP complex suppresses the oncogenic activity of YAP. Genes Dev 26: 1300–1305 [DOI] [PMC free article] [PubMed] [Google Scholar]
- Lu WY, Bird TG, Boulter L, Tsuchiya A, Cole AM, Hay T, Guest RV, Wojtacha D, Man TY, Mackinnon A et al (2015) Hepatic progenitor cells of biliary origin with liver repopulation capacity. Nat Cell Biol 17: 971–983 [DOI] [PMC free article] [PubMed] [Google Scholar]
- Mannaerts I, Leite SB, Verhulst S, Claerhout S, Eysackers N, Thoen LF, Hoorens A, Reynaert H, Halder G, van Grunsven LA (2015) The Hippo pathway effector YAP controls mouse hepatic stellate cell activation. J Hepatol 63: 679–688 [DOI] [PubMed] [Google Scholar]
- Marcolongo M, Young B, Dal Pero F, Fattovich G, Peraro L, Guido M, Sebastiani G, Palu G, Alberti A (2009) A seven‐gene signature (cirrhosis risk score) predicts liver fibrosis progression in patients with initially mild chronic hepatitis C. Hepatology 50: 1038–1044 [DOI] [PubMed] [Google Scholar]
- Martin K, Pritchett J, Llewellyn J, Mullan AF, Athwal VS, Dobie R, Harvey E, Zeef L, Farrow S, Streuli C et al (2016) PAK proteins and YAP‐1 signalling downstream of integrin beta‐1 in myofibroblasts promote liver fibrosis. Nat Commun 7: 12502 [DOI] [PMC free article] [PubMed] [Google Scholar]
- Mederacke I, Hsu CC, Troeger JS, Huebener P, Mu X, Dapito DH, Pradere JP, Schwabe RF (2013) Fate tracing reveals hepatic stellate cells as dominant contributors to liver fibrosis independent of its aetiology. Nat Commun 4: 2823 [DOI] [PMC free article] [PubMed] [Google Scholar]
- Mederacke I, Dapito DH, Affo S, Uchinami H, Schwabe RF (2015) High‐yield and high‐purity isolation of hepatic stellate cells from normal and fibrotic mouse livers. Nat Protoc 10: 305–315 [DOI] [PMC free article] [PubMed] [Google Scholar]
- Mohsen AH (2001) The epidemiology of hepatitis C in a UK health regional population of 5.12 million. Gut 48: 707–713 [DOI] [PMC free article] [PubMed] [Google Scholar]
- Moran‐Salvador E, Titos E, Rius B, Gonzalez‐Periz A, Garcia‐Alonso V, Lopez‐Vicario C, Miquel R, Barak Y, Arroyo V, Claria J (2013) Cell‐specific PPARgamma deficiency establishes anti‐inflammatory and anti‐fibrogenic properties for this nuclear receptor in non‐parenchymal liver cells. J Hepatol 59: 1045–1053 [DOI] [PubMed] [Google Scholar]
- Mori‐Akiyama Y, van den Born M, van Es JH, Hamilton SR, Adams HP, Zhang J, Clevers H, de Crombrugghe B (2007) SOX9 is required for the differentiation of paneth cells in the intestinal epithelium. Gastroenterology 133: 539–546 [DOI] [PubMed] [Google Scholar]
- Piper K, Brickwood S, Turnpenny LW, Cameron IT, Ball SG, Wilson DI, Hanley NA (2004) Beta cell differentiation during early human pancreas development. J Endocrinol 181: 11–23 [DOI] [PubMed] [Google Scholar]
- Poncy A, Antoniou A, Cordi S, Pierreux CE, Jacquemin P, Lemaigre FP (2015) Transcription factors SOX4 and SOX9 cooperatively control development of bile ducts. Dev Biol 404: 136–148 [DOI] [PubMed] [Google Scholar]
- Postic C, Shiota M, Niswender KD, Jetton TL, Chen Y, Moates JM, Shelton KD, Lindner J, Cherrington AD, Magnuson MA (1999) Dual roles for glucokinase in glucose homeostasis as determined by liver and pancreatic beta cell‐specific gene knock‐outs using Cre recombinase. J Biol Chem 274: 305–315 [DOI] [PubMed] [Google Scholar]
- Pritchett J, Athwal V, Roberts N, Hanley NA, Hanley KP (2011) Understanding the role of SOX9 in acquired diseases: lessons from development. Trends Mol Med 17: 166–174 [DOI] [PubMed] [Google Scholar]
- Pritchett J, Harvey E, Athwal V, Berry A, Rowe C, Oakley F, Moles A, Mann DA, Bobola N, Sharrocks AD et al (2012) Osteopontin is a novel downstream target of SOX9 with diagnostic implications for progression of liver fibrosis in humans. Hepatology 56: 1108–1116 [DOI] [PMC free article] [PubMed] [Google Scholar]
- Pritchett J, Athwal VS, Harvey E, Martin K, Llewellyn J, Ireland P, Nicolaides A, Humphries MJ, Bobola N, Hanley NA et al (2014) Epimorphin alters the inhibitory effects of SOX9 on Mmp13 in activated hepatic stellate cells. PLoS ONE 9: e100091 [DOI] [PMC free article] [PubMed] [Google Scholar]
- Ramachandran P, Pellicoro A, Vernon MA, Boulter L, Aucott RL, Ali A, Hartland SN, Snowdon VK, Cappon A, Gordon‐Walker TT et al (2012) Differential Ly‐6C expression identifies the recruited macrophage phenotype, which orchestrates the regression of murine liver fibrosis. Proc Natl Acad Sci USA 109: E3186–E3195 [DOI] [PMC free article] [PubMed] [Google Scholar]
- Rowe C, Gerrard DT, Jenkins R, Berry A, Durkin K, Sundstrom L, Goldring CE, Park BK, Kitteringham NR, Hanley KP et al (2013) Proteome‐wide analyses of human hepatocytes during differentiation and dedifferentiation. Hepatology 58: 799–809 [DOI] [PMC free article] [PubMed] [Google Scholar]
- Ryder SD, Irving WL, Jones DA, Neal KR, Underwood JC (2004) Progression of hepatic fibrosis in patients with hepatitis C: a prospective repeat liver biopsy study. Gut 53: 451–455 [DOI] [PMC free article] [PubMed] [Google Scholar]
- Scholten D, Osterreicher CH, Scholten A, Iwaisako K, Gu G, Brenner DA, Kisseleva T (2010) Genetic labeling does not detect epithelial‐to‐mesenchymal transition of cholangiocytes in liver fibrosis in mice. Gastroenterology 139: 987–998 [DOI] [PMC free article] [PubMed] [Google Scholar]
- Seibler J, Zevnik B, Kuter‐Luks B, Andreas S, Kern H, Hennek T, Rode A, Heimann C, Faust N, Kauselmann G et al (2003) Rapid generation of inducible mouse mutants. Nucleic Acids Res 31: e12 [DOI] [PMC free article] [PubMed] [Google Scholar]
- Smith CL, Tallquist MD (2010) PDGF function in diverse neural crest cell populations. Cell Adh Migr 4: 561–566 [DOI] [PMC free article] [PubMed] [Google Scholar]
- Tarlow BD, Finegold MJ, Grompe M (2014) Clonal tracing of Sox9+ liver progenitors in mouse oval cell injury. Hepatology 60: 278–289 [DOI] [PMC free article] [PubMed] [Google Scholar]
- Taura K, Miura K, Iwaisako K, Osterreicher CH, Kodama Y, Penz‐Osterreicher M, Brenner DA (2010) Hepatocytes do not undergo epithelial‐mesenchymal transition in liver fibrosis in mice. Hepatology 51: 1027–1036 [DOI] [PMC free article] [PubMed] [Google Scholar]
- Trepo E, Potthoff A, Pradat P, Bakshi R, Young B, Lagier R, Moreno C, Verset L, Cross R, Degre D et al (2011) Role of a cirrhosis risk score for the early prediction of fibrosis progression in hepatitis C patients with minimal liver disease. J Hepatol 55: 38–44 [DOI] [PubMed] [Google Scholar]
- Troeger JS, Mederacke I, Gwak GY, Dapito DH, Mu X, Hsu CC, Pradere JP, Friedman RA, Schwabe RF (2012) Deactivation of hepatic stellate cells during liver fibrosis resolution in mice. Gastroenterology 143: 1073–83.e22 [DOI] [PMC free article] [PubMed] [Google Scholar]
- Van den Akker NM, Winkel LC, Nisancioglu MH, Maas S, Wisse LJ, Armulik A, Poelmann RE, Lie‐Venema H, Betsholtz C, Gittenberger‐de Groot AC (2008) PDGF‐B signaling is important for murine cardiac development: its role in developing atrioventricular valves, coronaries, and cardiac innervation. Dev Dyn 237: 494–503 [DOI] [PubMed] [Google Scholar]
- Wagner T, Wirth J, Meyer J, Zabel B, Held M, Zimmer J, Pasantes J, Bricarelli FD, Keutel J, Hustert E et al (1994) Autosomal sex reversal and campomelic dysplasia are caused by mutations in and around the SRY‐related gene SOX9. Cell 79: 1111–1120 [DOI] [PubMed] [Google Scholar]
- Wells RG (2010) The epithelial‐to‐mesenchymal transition in liver fibrosis: here today, gone tomorrow? Hepatology 51: 737–740 [DOI] [PMC free article] [PubMed] [Google Scholar]
- Wenke AK, Bosserhoff AK (2010) Roles of AP‐2 transcription factors in the regulation of cartilage and skeletal development. FEBS J 277: 894–902 [DOI] [PubMed] [Google Scholar]
- Williams MJ, Lawson A, Neal KR, Ryder SD, Irving WL (2009) Autoantibodies in chronic hepatitis C virus infection and their association with disease profile. J Viral Hepat 16: 325–331 [DOI] [PubMed] [Google Scholar]
- Yanger K, Zong Y, Maggs LR, Shapira SN, Maddipati R, Aiello NM, Thung SN, Wells RG, Greenbaum LE, Stanger BZ (2013) Robust cellular reprogramming occurs spontaneously during liver regeneration. Genes Dev 27: 719–724 [DOI] [PMC free article] [PubMed] [Google Scholar]
- Yin C, Evason KJ, Asahina K, Stainier DY (2013) Hepatic stellate cells in liver development, regeneration, and cancer. J Clin Invest 123: 1902–1910 [DOI] [PMC free article] [PubMed] [Google Scholar]
- Yoon SM, Gerasimidou D, Kuwahara R, Hytiroglou P, Yoo JE, Park YN, Theise ND (2011) Epithelial cell adhesion molecule (EpCAM) marks hepatocytes newly derived from stem/progenitor cells in humans. Hepatology 53: 964–973 [DOI] [PubMed] [Google Scholar]
Associated Data
This section collects any data citations, data availability statements, or supplementary materials included in this article.
Supplementary Materials
Appendix
Expanded View Figures PDF
Table EV1
Source Data for Appendix
Review Process File
Source Data for Figure 2
Source Data for Figure 4