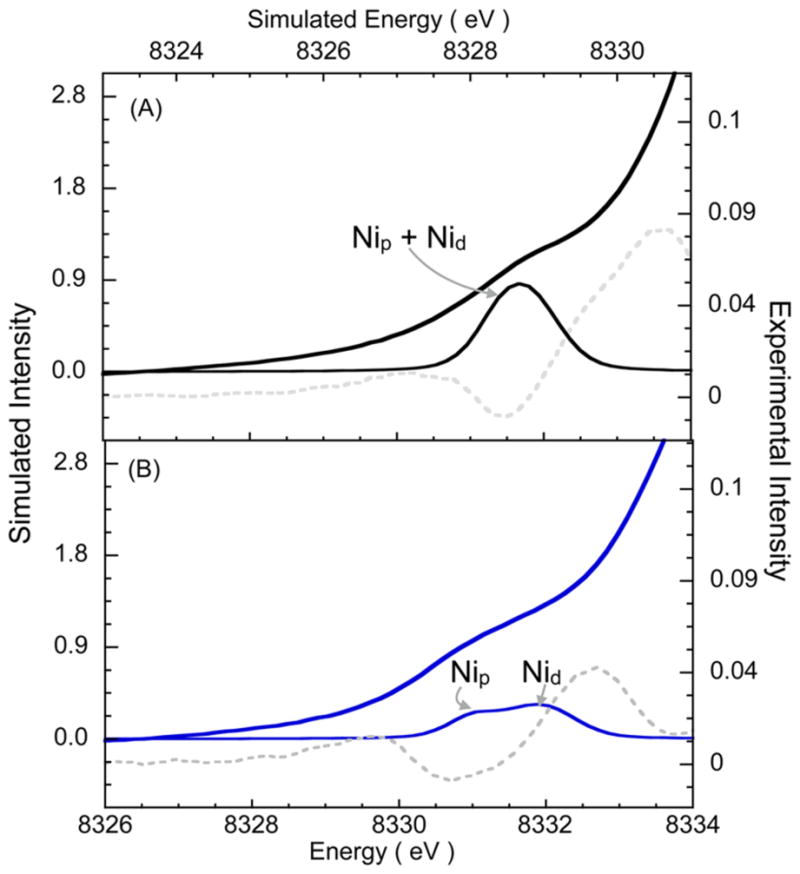
Figure 7.

TD-DFT-calculated XAS spectra. TD-DFT-calculated 1s → 3d data compared to the Ni K-pre-edge data (—) and their second derivatives (---) for (A) AOX and (B) ANiFeC using the structures depicted in Figure 6. The arrows indicate the dominant contribution of Nip and Nid sites to individual pre-edge features.
