Abstract
Recent studies on the controllability of complex systems offer a powerful mathematical framework to systematically explore the structure-function relationship in biological, social and technological networks1–3. Despite theoretical advances, we lack direct experimental proof of the validity of these widely used control principles. Here we fill this gap by applying a control framework to the connectome of the nematode C. elegans4–6, allowing us to predict the involvement of each C. elegans neuron in locomotor behaviours. We predict that control of the muscles or motor neurons requires twelve neuronal classes, which include neuronal groups previously implicated in locomotion by laser ablation7–13, as well as one previously uncharacterised neuron, PDB. We validate this prediction experimentally, finding that the ablation of PDB leads to a significant loss of dorsoventral polarity in large body bends. Importantly, control principles also allow us to investigate the involvement of individual neurons within each neuronal class. For example, we predict that, within the class of DD motor neurons, only three (DD04, DD05, or DD06) should affect locomotion when ablated individually. This prediction is also confirmed, with single-cell ablations of DD04 or DD05, but not DD02 or DD03, specifically affecting posterior body movements. Our predictions are robust to deletions of weak connections, missing connections, and rewired connections in the current connectome, indicating the potential applicability of this analytical framework to larger and less well-characterised connectomes.
Control theory probes a system’s ability to drive its output towards a desired outcome through the application of suitable input signals to selected driver nodes3. With a connectome featuring well-defined input nodes, and experimentally testable behavioural responses acting as outputs, the nematode worm C. elegans provides an ideal test-bed for network control principles. For example, C. elegans responds to anterior (posterior) gentle body touch with backward (forward) locomotion. It senses touch via the sensory neurons ALM, AVM and PLM, which serve as input nodes (Fig. 1a), processing this information through a network of 279 nonpharyngeal neurons connected by 2,194 directed synaptic connections and 1,028 reciprocal gap junctions. Of these, 124 motor neurons connect to 95 muscles via 552 neuromuscular junctions, inducing the experimentally observable locomotive patterns. To date C. elegans is the only organism for which the wiring diagram of its complete nervous system has been mapped with reasonable accuracy at the cellular level4–6. Despite this structural information, available for decades, it has proven difficult to systematically predict the functional involvement of specific neurons in defined behavioural responses.
Figure 1. Controlling the C. elegans neural network.
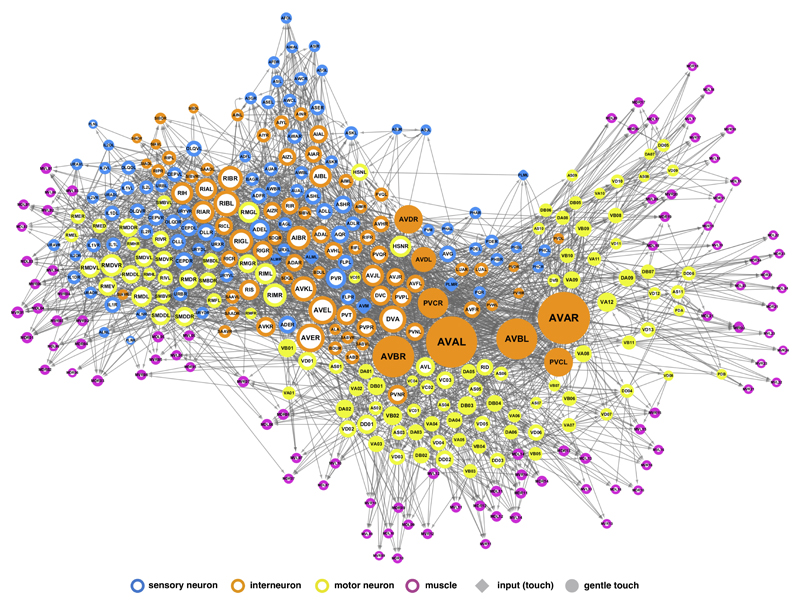
(a) Schematic neural circuit for locomotor response to gentle touch in C. elegans (adapted after Ref. 30; see SI Sec. III A). (b) Graphical representation of the proposed control framework. According to the principles illustrated in Fig. 2(a-d), if removal of a neuron disrupts controllability of the muscles, we designate it “essential” for locomotion; if not, we call it “non-essential”. To make this assessment, we first mapped the C. elegans responsive locomotor behaviours into a target network control problem, asking to what degree the sensory neurons (blue) can control the muscles (pink). This allowed us to predict the previously-unknown involvement of PDB in C.elegans locomotion, and functional differences between individual neurons within the DD neuronal class. (c) The C. elegans connectome used in our study, consisting of 279 neurons (the 282 nonpharyngeal neurons, excluding CANL/R and VC06 which do not make connections with the rest of the network) and 95 muscles. Node size is proportional to the sum of its in- and out- degrees. Filled nodes represent the neurons traditionally assigned to the circuits responsible for gentle touch response, hinting at the complexity of predicting neuronal function from the wiring diagram alone.
From a network perspective, if the removal of a neuron physically disconnects one or more muscles from the input, its effect on locomotion is self-evident. Yet, given the dense wiring of the C. elegans connectome (Fig. 1c, ED Fig. 1), no single neuron class ablation can disconnect the pathways between touch sensory receptors and muscles in the adult worm (see SI Sec. II B). Consequently, straightforward connectivity analyses cannot reveal the involvement of individual neurons in locomotion. Prompted by this failure, we hypothesised that neurons whose absence alters the controllability of specific groups of muscles would lead to changes in locomotion patterns when ablated in vivo. We then applied network control principles to this connectome, expecting to reveal both neurons with known importance to locomotion, as well as neurons whose involvement in locomotion was previously unknown, hence offering novel, experimentally testable predictions.
We model the nematode nervous system as a directed network whose nodes include neurons and muscles, and whose links represent the electrical and chemical synaptic connections between them, including neuromuscular junctions. Formally, the dynamics of the system composed of N neurons and M muscles is described by
| (1) |
where z(t) = [z1(t),z2(t),…,zN+M(t)]T denotes the states of N+M nodes at time t, f(∗) = [f1(∗),f2(∗),…, fN+M(∗)]T captures the nonlinear dynamics of each node, and v(t) = [v1(t),v2(t),…, vs(t)]T represents the external stimuli applied to the S touch receptor neurons. Assuming that in the absence of additional stimuli the nervous system is at a fixed point z*, where f(z*,v*,t) = 0, and using x(t) = z(t) − z* and u(t) = v(t) − v*, Eq. (1) can be linearised, obtaining
| (2) |
where corresponds to the adjacency matrix of the connectome, with non-zero elements Aii that represent the nodal dynamics of node i; the input matrix represents the receptor neurons on which the external signals are imposed, e.g. ALML/R and AVM for anterior gentle touch; and the vector y(t), selected by the output matrix C, represents the states of the M muscle cells. In other words, the response of C. elegans to external stimuli can be formalised as a target control problem14, asking if the inputs received by receptors in B can control the state of the muscles listed in C. The muscles are controllable if, with a suitable choice of inputs u(t), they can move in any desired manner, i.e. y(t) can reach an arbitrary position of the M-dimensional state space15. The nonlinearity of system (1) must be considered if we want to find out how to control the muscles. Here, however, we ask which neurons are necessary for control, which is defined by the controllability of the linearised system (2). Indeed, if (2) is locally controllable along a specific trajectory in state space, then the original nonlinear system (1) is also controllable along the same trajectory15. Furthermore, linear controllability predictions are consistent with simulations of neuronal networks with nonlinear dynamics16,17.
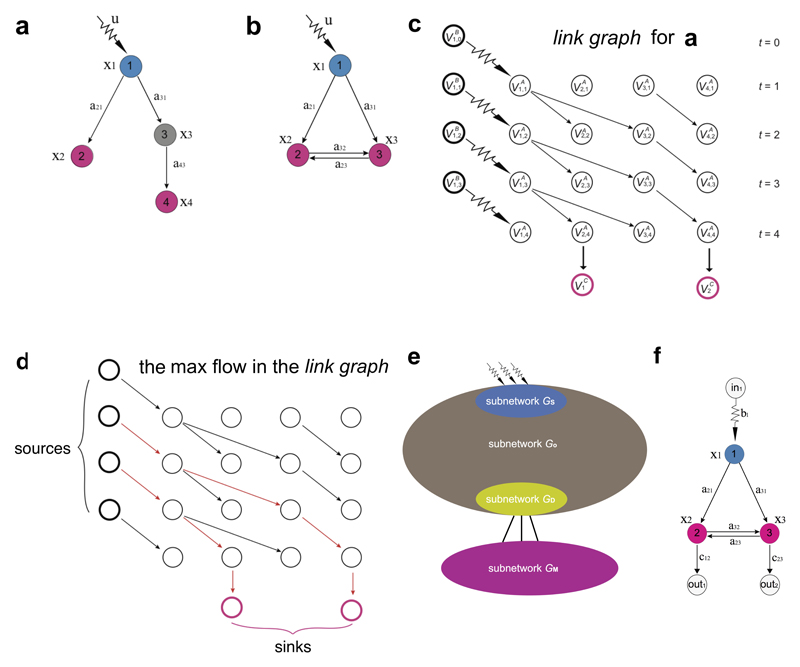
To understand how control considerations differ from simple connectivity-based predictions, consider Fig. 2a, exploring whether nodes 2 and 3 can be controlled by a signal applied to node 1. Topologically the system appears controllable, as the signal can reach all nodes. Yet, the classic Kalman condition18 tells us that the responses of nodes 2 and 3 to this signal are always correlated, hence we cannot control them independently, making the system as a whole uncontrollable. To gain full control over all three nodes, we need to apply one additional control signal to node 2 or 3 (Fig. 2b). We encounter the same situation when m independent signals aim to control k nodes, a configuration that is controllable only if m ≤ k (Figs. 2c, d). In a similar spirit, we derive the criterion for muscle controllability and apply it to analyse the C. elegans nervous system (SI Sec. II B, ED Fig. 2).
Figure 2. Novel prediction and experimental confirmation of PDB involvement in locomotion.
(a) According to control theory, nodes 2 and 3 (pink) cannot be controlled by a single signal u1(t). By Eq. (2), the time evolution of x2(t) of and x3(t) follows a31ẋ2(t) = a31ẋ3(t), hence no signal u1(t) is able to control x2(t) and x3(t) independently of each other. To independently control nodes 2 and 3, we need two input signals, as shown in (b). Similarly, when m independent signals aim to control k nodes connected to them, as shown in (c), the pink nodes are not controllable unless m ≥ k, which is the case shown in (d). (e) To explore the control role of PDB, we show the paths through which control signals can pass from receptor neurons (blue) to downstream muscles (pink). Control analysis finds that the five motor neurons, {VB11, VD13, PDB, VA12, VD12}, receive independent signals from {ALML, ALMR, AVM} (see SI Sec. II B). According to the principle illustrated in (c), in the intact worm, five of the seven muscles are independently controllable. When PDB is ablated, control signals can still reach all seven muscles, but the ablation of PDB forces the signal through only four neurons, reducing the number of independently controllable muscles from five to four. (f) Experimental validation of the involvement of PDB in locomotion. N = 43 PDB ablations were tested in the same experiment together with n = 35 mock-ablated controls. Error bars indicate mean ± standard deviation. Ablation of PDB resulted in significant abnormalities in Eigen Projection 1 features and a loss of ventral bias to deep body bends (SI Table III). Statistical test: multiple t-tests, significance level = 0.05, n.s. = not significant. See SI Sec. III B for experimental details of laser ablations, subsequent data analysis and exact p-values.
Here, we applied this network control framework to predict which neurons are critical in the response to gentle touch, in the sense that their removal (ablation) would decrease the number of controllable muscles. We found that even in the intact worm, only 89 of the 95 muscles are independently controllable. We then explored the impact of ablating each of the 103 classes (see SI Sec. I B for neuron classification) individually. We found that the removal of the vast majority of neuron classes had no impact on muscle controllability. Our initial analysis did identify, however, nine classes predicted to affect muscle control: the seven major classes of motor neurons (DA, DB, DD, VA, VB, VD, and AS), and the premotor interneuron AVA (Table 1; see also ED Figs. 3-5). Each of these classes has been previously implicated, through genetic, neuroimaging, optogenetic, and cell ablation experiments, in the direct control of the body neuromusculature (see SI Sec. III A).
Table 1. Neuronal predictions.
The twelve neuron classes predicted by control theoretic tools to be effective in locomotion and the known experimental results for ablation in adult C. elegans 10–13. Highlighted in red is PDB, not previously associated with locomotion.
| CONTROL | PREDICTED NEURON CLASSES | EXPERIMENTAL FACTS |
|---|---|---|
|
CONTROL MUSCLES |
DA, DB | loss of backward/forward locomotion |
| DD | uncoordinated motion | |
| AVA | uncoordinated motion | |
| VA, VB, VD, AS | likely loss of locomotion | |
| PDB | verified by new experiments | |
|
CONTROL MOTOR NEURONS |
AVA, AVB | uncoordinated motion |
| AVD | loss of reversal response | |
| PVC | loss of reversal response |
Interestingly, control analysis also predicted locomotor defects following the ablation of a ninth neuron, PDB, not previously implicated in locomotion. As shown in Fig. 2e, while PDB directly connects to muscles MVR21 and MVL22, it apparently plays no key topological role as in its absence the signal transmitted by the receptor neurons of anterior gentle touch, AVM and ALML/R, can still reach all muscles. However, from a control perspective, we expect that the ablation of PDB should affect worm locomotion (see Fig. 2e for a full explanation). Since ablation experiments for PDB have not previously been reported, this prediction offers the first direct, falsifiable experimental test of the network control framework.
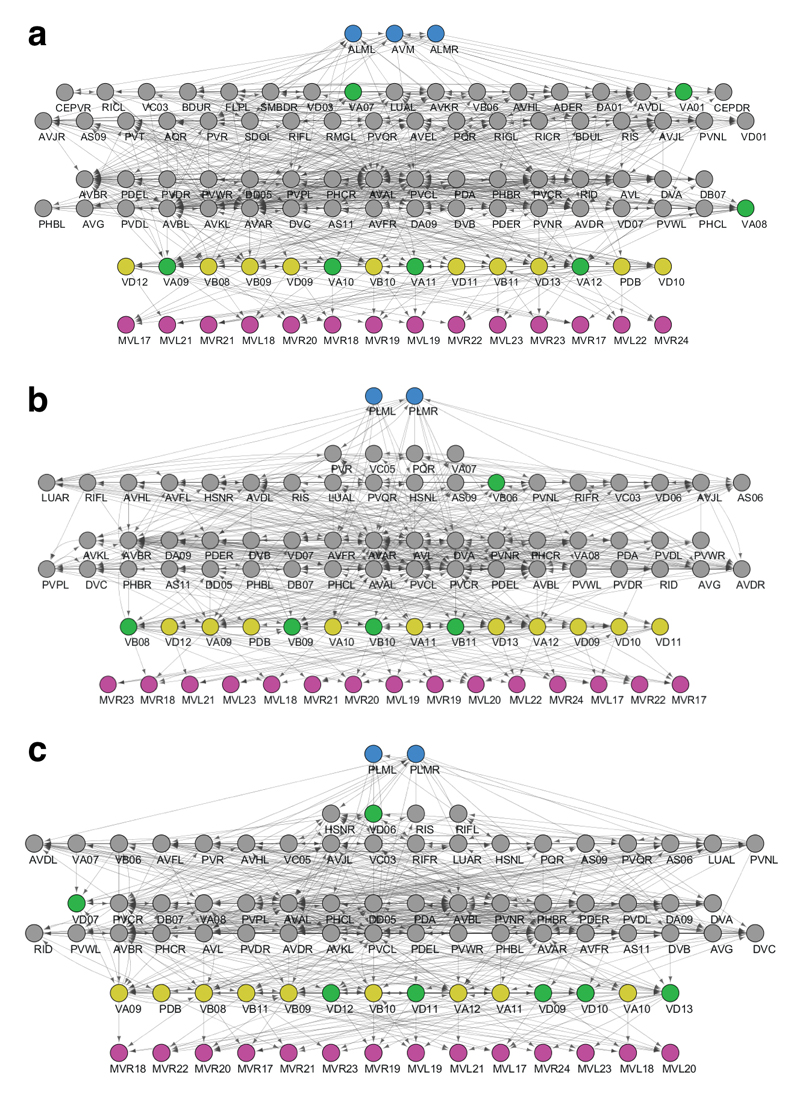
Most existing results on neuron ablation remove all members of a neuron class simultaneously7,10–12, but control principles can go further, predicting which of the individual neurons are responsible for the loss of control. To show this we applied (2) to each individual neuron within the DD class. Intriguingly, we found that the individual ablation of DD01, DD02, or DD03 did not alter the controllability of the muscles, but DD04, DD05, and DD06 did (Fig. 3a). This result was unexpected, because the general pattern of connectivity is thought to be similar among the DD class. Nevertheless, we predict that the individual ablation of DD04, DD05, or DD06 should be sufficient to impair C. elegans locomotion, offering a second set of specific, unanticipated and falsifiable predictions, now regarding the functional differences between individual neurons within a class.
Figure 3. Novel prediction and experimental confirmation for the effect of individual DD neurons on locomotion.
(a) To explore the control role of the DD neuronal class, comprising six neurons (DD01-DD06), we show the paths through which control signals can pass from the receptor neurons to the 31 muscles. Right bottom corner (yellow highlight): In the intact adult, the 13 motor neurons that directly connect to the 15 muscles receive independent signals from PLML/R (see SI Sec. II B). Hence, according to the control principle of Fig. 2c, 13 of the 15 muscles are independently controllable. When DD04, DD05, or DD06 is ablated, the number of controllable muscles decreases to 12, suggesting that DD04, DD05, and DD06 are individually indispensable for locomotion. Left bottom corner (blue highlight): Control signals to the 16 muscles go through 27 neurons. When DD01, DD02, or DD03 is ablated, according to the principle in Fig. 2d the 26 remaining neurons are still able to independently control all 16 muscles, predicting that DD01, DD02 and DD03 are individually inessential for locomotion. (b,c) Experimental validation. Individual ablation of DD04 or DD05, but not DD02 or DD03, affected the worm posture as indicated by statistically different Eigen Projection 4 features. DD02 (n=52) and DD05 (n=48) ablations were tested in the same experiment together with mock-ablated controls (n=58). DD03 (n=21) and DD04 (n=18) ablations were tested together in a separate experiment with new mock-ablated controls (n=23). Error bars indicate mean ± standard deviation. Statistical test: multiple t-tests, significance level = 0.05, n.s. = not significant.
To test the validity of our two sets of predictions, we performed laser ablation of individual neurons9 and analysed the spontaneous locomotor behaviour of freely-moving worms on food (see https://figshare.com/s/72716a92be1ab0f1e1d4 for complete data19). We used an automated tracking system20 to compare the locomotion pattern of PDB- and DDs-ablated animals with mock-ablated worms, focusing on four fundamental components of worm body morphology known as eigenworms, which provide a low-dimensional but relatively complete description of C. elegans body postures21. Under our recording conditions, the first eigenprojection represents a large body bend, the second and third represent components of the sinusoidal traveling wave that drives crawling movement, and the fourth represents small movements at the head and tail22.
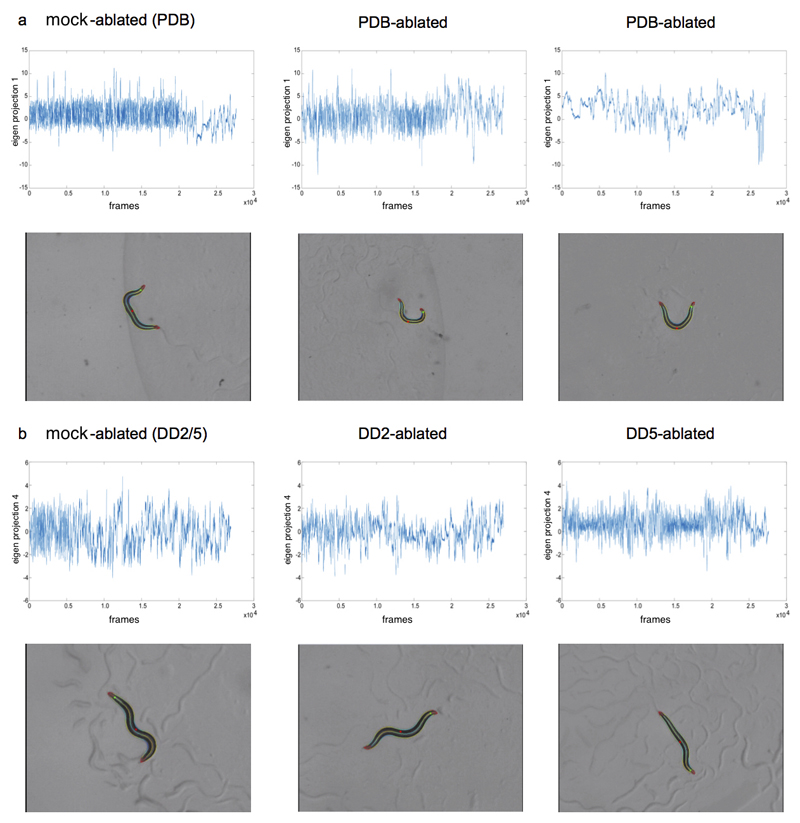
We first tested the effect of ablating the PDB neuron on locomotion. We observed that PDB-ablated animals showed significant and reproducible abnormalities in parameters related to the first eigenprojection (EP1; Fig. 2f; SI Table II; ED Fig. 6a) compared to mock-ablated animals of the same genotype. Specifically, ablated animals showed a higher incidence of highly negative EP1 values, which correlate with deep bends on the dorsal side of the body. Since large bends, or omega turns, are strongly biased to the ventral side in normal worms23,24, this suggested a loss of ventral bias in PDB-ablated animals. Indeed, we observed that PDB-ablated animals showed a significantly lower frequency of ventral omega turns (63.8% vs 81.9% for control; n>125, p<.0005 by two-tailed z-test; see SI Table III) compared to mock-ablated animals. These results are consistent with our prediction that PDB is essential for the control of the body neuromusculature.
We next tested the effects of ablating individual DD neurons on locomotor control. As predicted, ablations of DD02 showed no significant abnormalities in locomotion compared to mock ablated animals. In contrast, we found that DD05-ablated worms showed significantly lower absolute values for the fourth eigenworm (EP4) during forward movement (Figs. 3b-c; SI Table I; ED Fig. 6b), correlating with a reduction in tail movement during forward locomotion. A similar effect on EP4 parameters was observed for DD04- but not DD03-ablated worms, consistent with DD04 and DD05 specifically affecting control of posterior body muscles. Taken together the results of the PDB and DD ablations support our starting hypothesis that control principles can accurately identify individual neurons with key roles in the coordination of locomotion.
Motor neurons, which directly connect to muscle cells, play a unique role in transmitting motor commands to muscles. Our previous analysis focused on muscle control, allowing the motor neurons to be in arbitrary dynamical states, some of which may not be biologically realistic. We therefore refined our analysis to identify neurons required to preserve the controllability of motor neurons. This control analysis predicts that AVB, AVD, and PVC are also crucial for locomotion (see SI Sec. II B); the ablation of these neurons has been shown previously to profoundly disrupt forward movement7,8,10 or the response to gentle touch7 (Table 1). Thus, using motorneurons as targets for controllability led to a more complete set of predictions for the analysis of locomotor control.
The accuracy of the C. elegans connectome data is affected by a number of factors including human errors during mapping and synapse identification and the small number of animals reconstructed (only two), prompting us to explore the robustness of our predictions. ED Figure 7 shows the probability that a given neuron class, predicted to be essential for locomotion based on the current dataset, remains essential after randomly deleting weak links, adding links and rewiring the existing links between neurons (see SI Sec. IV A for details). We find that the predictions for PDB, DA, DB, DD, VA, VB, VD, and AS are robust, remaining significant as we progressively alter as many as 100 links between neurons. The least robust prediction is for AVA, whose probability of being involved in control decreases with link addition/rewiring.
In summary, our ability to predict the importance of individual neurons in C. elegans locomotion shows that control principles offer a novel way to unveil how the connectome structure affects its function (see Fig. 1b ED Figs. 8-10). In doing so, we provide the first experimental evidence for the relevance of control principles to the properties of real-world complex systems.
Our results raise several open questions and opportunities for future work. For example, the control principles of two distinct behaviours described by the same sets of input and output nodes cannot be distinguished based on the connectome alone. However, if accurate link weights or activity patterns can be experimentally determined, the control framework can predict control energy and control time25,26 and ultimately tease apart involvement of network components when the input and output nodes are indistinguishable. It is also theoretically possible to adapt our tools to temporally varying sensory inputs and behavioural responses invoking a framework to control temporal networks27–29. Finally, since meaningful predictions can be made despite some degree of uncertainty or incompleteness on the underlying connectome, we expect that the control framework introduced here is applicable to other neural wiring diagrams. Consequently, advances in mapping the Drosophila brain and other larger connectomes will yield unprecedented opportunities for deepening our understanding of both control principles and the mechanisms driving the function and activity of nervous systems.
Extended Data
Extended Data Figure 1.
C. elegans connectome. The filled nodes are the previously-known neurons involved in the worm's response to gentle touch.
Extended Data Figure 2.
Illustration of structural controllability, the construction of the linking graph, and the derivation of the controllability criterion. (a,b) The blue nodes receive external signals and the pink nodes are those we aim to control. Thus, S = 1 and M = 2 for both networks. (c) The construction of the linking graph for the network in (a). (d) The calculation of the linking size can be mapped into a multi-source-multi-sink max-flow problem, with the constraint that the capacity of each node and each edge is one. The red edges show the two disjoint paths that achieve the maximum flow. (e,f) Schematic picture for the derivation of the lower bound z*.
Extended Data Figure 3.
Control theoretic mechanisms of the loss of muscular control induced by the ablation of the AVA (a) or AS (b) neuronal class in C. elegans.
Extended Data Figure 4.
Control theoretic mechanisms of the loss of muscular control induced by the ablation of the DA (a) or DB (b) neuronal class in C. elegans.
Extended Data Figure 5.
Control theoretic mechanisms of the loss of muscular control induced by the ablation of the VA (a), VB (b), or VD (c) neuronal class in C. elegans.
Extended Data Figure 6.
Illustrative examples of the behavioural phenotypes observed for PDB- and DD-ablated animals. Time series plots of sample videos, and still images from these videos, illustrating the locomotion abnormalities resulting from ablation. The green dot indicates the animal’s head, and the red dot in the mid-body indicates the ventral side. (a) For PDB-ablated animals compared to mock-ablated controls, we observed differences in Eigen Projection 1, which describes the large wavelength body bends that occur during turning. The lower negative values observed in PDB-ablations indicate a loss of the ventral bias to these turns. Still images show PDB-ablated animals making a large dorsal turn, whereas turns in control animals are usually ventral. The videos used here (from L to R) are ‘mockPDB_onfood_L_2016_11_03__14_16_37___7___1’, ‘ablPDB_onfood_L_2016_11_03__14_40_04___4__2', and ‘ablPDB_onfood_L_2016_11_04__14_28_26___5___1'. (b) DD5-ablated animals showed lower values for Eigen Projection 4, which captures the small wavelength oscillations in the head and tail. The lower values indicate a reduction in amplitude of tail oscillations compared with controls, i.e. a characteristic stiff tail appearance. The videos shown here (from L to R) are ‘mockDD_onfood_L_2016_10_29__13_13_35 ___7___6’, ‘DD2_onfood_R_2016_10_30__12_13_57___7___4’, and ‘DD5_onfood_ L_2016_10_29__13_13_25___5___6’.
Extended Data Figure 7.
Predictive robustness against random deletions, additions, and rewiring of links. The vertical axis represents the probability that each of the predicted neuron classes remains significant in the controllability of muscles (a,b,c) or motor neurons (d,e) after the network is altered. The horizontal axis denotes the number of deleted weak links, added, or rewired links between neurons in C. elegans connectome. Each probability is calculated from 200 independent runs.
Extended Data Figure 8.
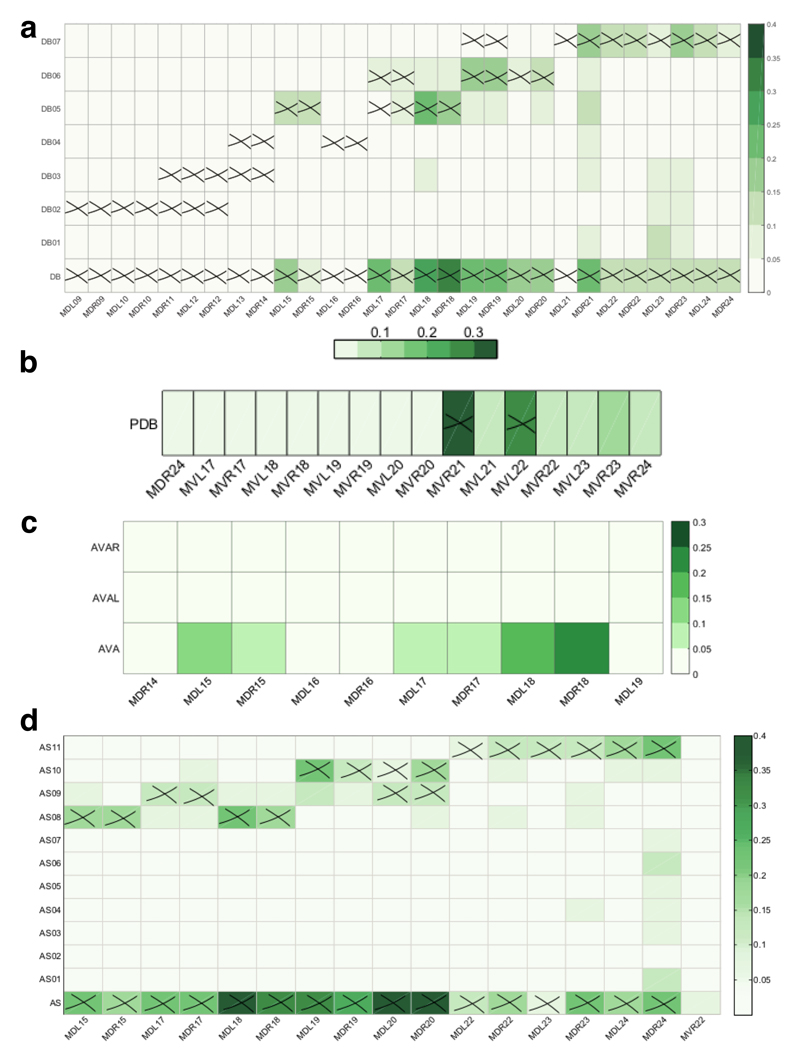
The role of individual neurons within the DB (a), PDB (b), AVA (c) and AS (d) neuronal classes in the loss of muscular controllability in C. elegans. The shade of green represents the probability with which control is lost over each muscle following the ablation of individual neurons. Each cross indicates a direct connection between a neuron and a muscle cell. Note that there are other muscles directly connected to the neurons but not shown here, because of zero probability for reduced control over these muscles following ablation of these neuronal classes.
Extended Data Figure 9.
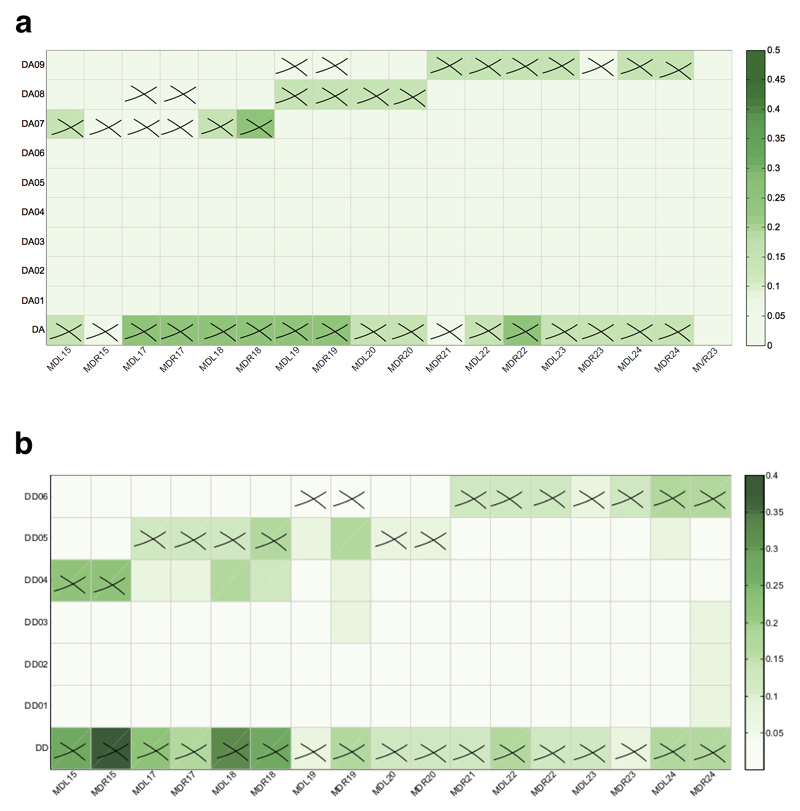
The role of individual neurons within the DA (a) and DD (b) neuronal classes in the loss of muscular controllability in C. elegans. The shade of green represents the probability with which the control is lost over each muscle induced by the ablation of individual neurons. Each cross indicates a direct connection between a neuron and a muscle cell. Note that there are other muscles directly connected to the neurons but not shown here, because of zero probability for reduced control over these muscles following ablation of these neuronal classes.
Extended Data Figure 10.
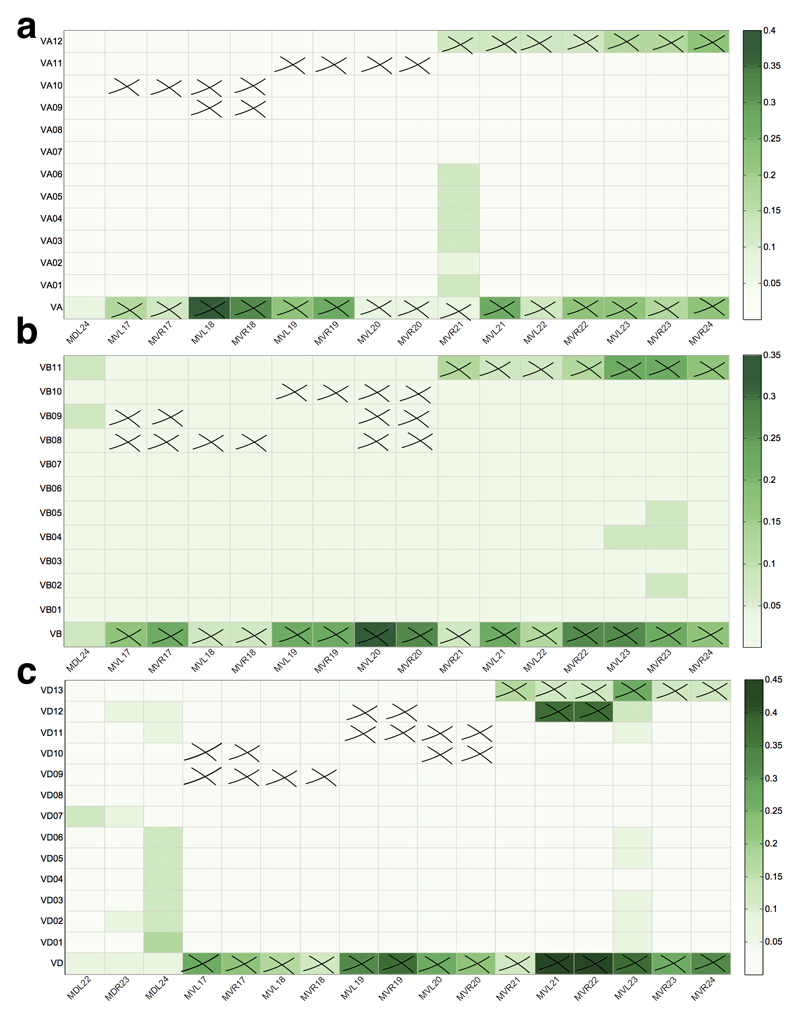
The role of individual neurons within the VA (a), VB (b) and VD (c) neuronal classes in the loss of muscular controllability in C. elegans. The shade of green represents the probability with which the control is lost over each muscle induced by the ablation of individual neurons. Each cross indicates a direct connection between a neuron and a muscle cell. Note that there are other muscles directly connected to the neurons but not shown here, because of zero probability for reduced control over these muscles following ablation of these neuronal classes.
Supplementary Material
Acknowledgements
We thank M. Angulo, J. Gao, Y.-Y. Liu, J.-J. Slotine, K. Albrecht, S. P. Cornelius and A. Li for valuable discussions and L. Grundy, A. Brown and E. Yemini for help with analysis of tracking data. We are grateful to V. Butler and the Caenorhabditis Genetics Center, which is funded by NIH Office of Research Infrastructure Programs (P40 OD010440), for C. elegans strains. This work is supported by the John Templeton Foundation: Mathematical and Physical Sciences grant number PFI-777; European Commission grant number 641191 (CIMPLEX); MRC grant number MC-A023-5PB91; Wellcome Trust grant number WT103784MA. P.E.V. is supported by the Medical Research Council grant number MR/K020706/1. Y.L.C. is supported by an EMBO Long Term Fellowship.
Footnotes
Code availability statement The code written for and used in this study is available from the corresponding author upon reasonable request.
Data availability statement The experimental data generated and analysed during this study can be found at https://figshare.com/s/72716a92be1ab0f1e1d4, Ref 19.
Author Contributions A.-L.B., G.Y. and P.E.V. conceived the project, G.Y. did the control analysis, P.E.V. and E.K.T. analysed the results, Y.L.C. and D.S.W. performed the new experiments, W.R.S. and A.-L.B. discussed the results. A.-L.B., E.K.T., W.R.S., P.E.V. and G.Y. wrote the manuscript, Y.L.C. and D.S.W. edited the manuscript.
Competing Interests The authors declare no competing financial interests.
References
- 1.Caldarelli G. Scale-Free Networks: Complex Webs in Nature and Technology. Oxford Univ. Press; New York: 2007. [Google Scholar]
- 2.Cohen R, Havlin S. Complex Networks: Structure, Robustness and Function. Cambridge Univ. Press; New York: 2010. [Google Scholar]
- 3.Liu Y-Y, Barabási A-L. Control principles of complex networks. Rev Mod Phys. 2016;88:035006. [Google Scholar]
- 4.White JG, Southgate E, Thomson JN, Brenner S. The structure of the nervous system of the nematode Caenorhabditis elegans: the mind of a worm. Phil Trans R Soc Lond. 1986;314:1–340. doi: 10.1098/rstb.1986.0056. [DOI] [PubMed] [Google Scholar]
- 5.Chen BLJ. Neuronal network of C. elegans: from anatomy to behavior. Cold Spring Harbor Laboratory; 2007. Doctoral dissertation. [Google Scholar]
- 6.Varshney LR, et al. Structural properties of the Caenorhabditis elegans neuronal network. PLoS Comput Biol. 2011;7:e1001066. doi: 10.1371/journal.pcbi.1001066. [DOI] [PMC free article] [PubMed] [Google Scholar]
- 7.Chalfie M, et al. The neural circuit for touch sensitivity in Caenorhabditis elegans. J Neurosci. 1985;5:956–964. doi: 10.1523/JNEUROSCI.05-04-00956.1985. [DOI] [PMC free article] [PubMed] [Google Scholar]
- 8.Zhen M, Samuel AD. C. elegans locomotion: small circuits, complex functions. Curr Opin Neurobiol. 2015;33:117–126. doi: 10.1016/j.conb.2015.03.009. [DOI] [PubMed] [Google Scholar]
- 9.Bargmann CI, Avery L. Laser killing of cells in Caenorhabditis elegans. Method Cell Biol. 1995;48:225–250. doi: 10.1016/s0091-679x(08)61390-4. [DOI] [PMC free article] [PubMed] [Google Scholar]
- 10.Wicks SR, Rankin CH. Integration of mechanosensory stimuli in Caenorhabditis elegans. J Neurosci. 1995;15:2434–2444. doi: 10.1523/JNEUROSCI.15-03-02434.1995. [DOI] [PMC free article] [PubMed] [Google Scholar]
- 11.Tsalik EL, Hobert OH. Functional mapping of neurons that control locomotory behavior in Caenorhabditis elegans. Jm Neurobiol. 2003;56:178–197. doi: 10.1002/neu.10245. [DOI] [PubMed] [Google Scholar]
- 12.Wakabayashi T, Kitagawa I, Shingai R. Neurons regulating the duration of forward locomotion in Caenorhabditis elegans. Neurosci Res. 2004;50:103–111. doi: 10.1016/j.neures.2004.06.005. [DOI] [PubMed] [Google Scholar]
- 13.Haspel G, O’Donovan MJ, Hart AC. Motoneurons dedicated to either forward or backward locomotion in the nematode Caenorhabditis elegans. J Neurosci. 2010;30:11151–11156. doi: 10.1523/JNEUROSCI.2244-10.2010. [DOI] [PMC free article] [PubMed] [Google Scholar]
- 14.Gao J, Liu Y-Y, D’Souza RM, Barabási A-L. Target control of complex networks. Nature Commun. 2014;5:5415. doi: 10.1038/ncomms6415. [DOI] [PMC free article] [PubMed] [Google Scholar]
- 15.Coron J-M. Control and Nonlinearity. American Mathematical Society; Rhode Island: 2009. [Google Scholar]
- 16.Whalen AJ, Brennan SN, Sauer TD, Schiff SJ. Observability and controllability of nonlinear networks: The role of symmetry. Phys Rev X. 2015;5:011005. doi: 10.1103/PhysRevX.5.011005. [DOI] [PMC free article] [PubMed] [Google Scholar]
- 17.Muldoon SF, et al. Stimulation-based control of dynamic brain networks. PLoS Comput Biol. 2016;12:e1005076. doi: 10.1371/journal.pcbi.1005076. [DOI] [PMC free article] [PubMed] [Google Scholar]
- 18.Kalman RE. Mathematical description of linear dynamical systems. J Soc Indus Appl Math Ser A. 1963;1:152–192. [Google Scholar]
- 19. https://figshare.com/s/72716a92be1ab0f1e1d4 [replace with data paper reference]
- 20.Yemini E, Jucikas T, Grundy LJ, Brown AE, Schafer WR. A database of Caenorhabditis elegans behavioral phenotypes. Nature Methods. 2013;10:877–879. doi: 10.1038/nmeth.2560. [DOI] [PMC free article] [PubMed] [Google Scholar]
- 21.Stephens GJ, Johnson-Kerner B, Bialek W, Ryu WS. Dimensionality and dynamics in the behavior of C elegans. PLoS Comput Biol. 2008;4:e1000028. doi: 10.1371/journal.pcbi.1000028. [DOI] [PMC free article] [PubMed] [Google Scholar]
- 22.Brown AE, Yemini EI, Grundy LJ, Jucikas T, Schafer WR. A dictionary of behavioral motifs reveals clusters of genes affecting Caenorhabditis elegans locomotion. Proc Natl Acad Sci USA. 2013;110:791–796. doi: 10.1073/pnas.1211447110. [DOI] [PMC free article] [PubMed] [Google Scholar]
- 23.Gray JM, Hill JJ, Bargmann CI. A circuit for navigation in Caenorhabditis elegans. Proc Natl Acad Sci USA. 2005;102:3184–3191. doi: 10.1073/pnas.0409009101. [DOI] [PMC free article] [PubMed] [Google Scholar]
- 24.Huang KM, Cosman P, Schafer WR. Machine vision based detection of omega bends and reversals in C. elegans. J Neurosci Methods. 2006;58(2):323–36. doi: 10.1016/j.jneumeth.2006.06.007. [DOI] [PubMed] [Google Scholar]
- 25.Yan G, et al. Spectrum of controlling and observing complex networks. Nature Phys. 2015;11:779–786. [Google Scholar]
- 26.Gu S, et al. Controllability of structural brain networks. Nature Commun. 2015;6:8414. doi: 10.1038/ncomms9414. [DOI] [PMC free article] [PubMed] [Google Scholar]
- 27.Pósfai M, Hövel P. Structural controllability of temporal networks. New J Phys. 2014;16 123055. [Google Scholar]
- 28.Pan Y, Li X. Structural controllability and controlling centrality of temporal networks. PLoS One. 2014;9:e94998. doi: 10.1371/journal.pone.0094998. [DOI] [PMC free article] [PubMed] [Google Scholar]
- 29.Li A, Cornelius SP, Liu YY, Wang L, Barabási AL. The fundamental advantages of temporal networks. Reprint arXiv. 2016:1607.06168. doi: 10.1126/science.aai7488. [DOI] [PubMed] [Google Scholar]
- 30.Driscoll M, Kaplan J. In: C. elegans II: Monograph 33 Ch. 23. Cold Spring Harbor monograph series. Riddle DL, et al., editors. Cold Spring Harbor Laboratory; Plainview, New York: 1997. [Google Scholar]
Associated Data
This section collects any data citations, data availability statements, or supplementary materials included in this article.


