

Abstract
Objective
To examine trajectories of functional recovery following rehabilitation for Traumatic Brain Injury (TBI).
Design
Prospective study.
Setting
Inpatient rehabilitation hospitals in the Uniform Data System for Medical Rehabilitation (UDSMR).
Participants
A subset of Individuals receiving inpatient rehabilitation services for TBI in 2002–2010 who also had post-discharge measurement of functional independence (N=16,583).
Interventions
Inpatient rehabilitation.
Main Outcomes Measures
Admission, discharge, and follow-up data were obtained from the UDSMR. We used latent class mixture models to examine recovery trajectories for both cognitive and motor functioning, as measured by the Functional Independence Measure (FIM) instrument.
Results
Latent class models identified three different trajectories (low, medium, high) for both cognitive and motor FIM scales. Factors associated with membership in the low cognition trajectory group included younger age, male, racial/ethnic minority, Medicare or Medicaid (vs. commercial or other insurance), comorbid conditions, and greater duration from injury date to rehabilitation admission date. Factors associated with membership in the low motor trajectory group included older age, racial/ethnic minority, Medicare or Medicaid coverage, comorbid conditions, open head injury, and greater duration to admission.
Conclusion
Standard approaches to assessing recovery patterns following TBI obscure differences between subgroups with trajectories that differ from the overall mean. Select demographic and clinical characteristics can help classify patients with TBI into distinct functional recovery trajectories, which can enhance both patient-centered care and quality improvement efforts.
Keywords: inpatient rehabilitation, recovery trajectory, functional independence
INTRODUCTION
Traumatic brain injury (TBI) is an important health issue in the United States. An estimated 1.7 million TBIs occur in the United States every year resulting in 1.4 million ER visits, 275,000 hospitalizations and 52,000 deaths.1 TBI-related hospitalizations demonstrate a tri-modal distribution by age; rates are substantially higher in children aged 0 to 4 years, older adolescents aged 15 to 19 years and adults 65 years and older.1, 2 The leading cause of TBI in children and adults is unintentional falls.1, 2 The Centers for Disease Control and Prevention reported in 2006 that falls cause approximately half (50.2%) of the TBIs among children aged 0 to 14 years, compared with 60.7% among adults aged 65 years and older.2,1, 2
Recovery following TBI is variable. Individuals with similar trauma may not experience similar functional gains over time.3, 4 While inpatient rehabilitation following TBI results in improvements in functional independence,5 survivors are often left with lasting deficits in cognitive, emotional and physical functioning;6, 7 moderate to severe disability is common.8 Factors associated with differences in functional recovery include age, race/ethnicity and variations in the intensity of post-acute care. In children with mild TBI, recovery prospects are favorable9; however, children with more severe injury are at risk of long term deficits in executive function and neurobehavioral and cognitive impairment.10, 11 Older adults with TBI typically have longer lengths of stay, show less improvement in function,12, 13 and are less likely to be discharged to community settings.14–16 Racial and ethnic differences in outcomes following TBI17, 18 may be due to differences in the intensity and/ or type of post-acute care received18–20. Provider quality may also influence long term recovery21.
Latent class mixture models are commonly used to assess developmental trajectories in psychology and behavioral sciences. This technique is designed to identify unique trajectories within a study population without a priori assumptions regarding group membership.22, 23 These subgroups are unobserved in traditional, group-mean based models. In this study we examined functional recovery following inpatient rehabilitation in a national TBI sample using both traditional linear mixed models and latent class trajectories. We hypothesized that functional recovery following TBI would be non-linear and that heterogeneous subpopulations could be identified. Discriminating TBI subpopulations may help target contextualized treatments to maximize individual functional recovery.
DATA AND METHODS
Data Source
The Uniform Data System for Medical Rehabilitation (UDSMR) is the largest non-governmental database for medical rehabilitation outcomes in the US. Approximately 70% of inpatient rehabilitation facilities (freestanding inpatient rehabilitation hospitals or acute hospital-based rehabilitation units) in the US use UDSMR services. About 25–43% of UDSMR subscriber facilities collect follow-up information from patients as part of their quality assurance or improvement programs. Among facilities with TBI patients, 18 to 26% provided follow-up data. Follow-up information is collected three to six months post-discharge using phone interviews of the patients or care givers by professional staff trained in administering the Functional Independence Measure (FIM). The mean follow-up time was 103 days (SD = 23). The reliability and stability of functional assessment by telephone interview has been established24. We included only individuals with defined open or closed traumatic brain injury and not cases of multiple injuries. We also excluded 4 cases where sex could not be determined. Detailed information on the follow-up data collected by UDSMR (2002 – 2010) is available in a report by Graham and colleagues25.
Dependent Variable
Functional status was measured by the FIM instrument, an 18 item composite measure covering 6 areas of functional independence: communication, cognition, self-care, sphincter control, transfer and locomotion. Each item is rated on a 7 point scale (1: complete dependence to 7: complete independence). The FIM instrument has been shown to be valid and reliable.26,27 We examined Cognitive FIM (5 items, range 5–35) and Motor FIM (13 items, range13–91) subscales. FIM ratings were assessed at three time points: admission to inpatient rehabilitation, discharge, and at follow-up. Patients were then assigned to trajectory groups based on their FIM ratings at each time measurement (described below).
Covariates
Demographic characteristics included gender, race/ethnicity (white, black, Hispanic, other), marital status (married/not married), and payer (Medicare/Medicaid, Commercial, Other). Age was included as a categorical variable (<45, 45–64, 65–74, 75+); discrete age was not available across all calendar years. Comorbidities were assessed using the CMS comorbidity tier classification.27 This system groups comorbidities based on their anticipated impact on service utilization during the inpatient rehabilitation stay,12 resulting in ranked, cost-based tiers: tier 1 (high), tier 2 (medium), tier 3 (low), and tier 0 (no comorbidity). In 2012, there were 8 comorbid conditions in tier 1, 11 in tier 2, and 924 in tier 3.28 Injury type was included as open vs. closed head injury. Duration from onset to rehabilitation admission was measured in days from the date of injury to the date of admission to inpatient rehabilitation. We also included a variable for the 10 Centers for Medicare and Medicaid Services regions to account for regional variation in outcomes. CMS regions are designated as : Boston (Connecticut, Maine, Massachusetts, New Hampshire, Rhode Island, Vermont), New York (New Jersey, New York, Puerto Rico, Virgin Islands), Philadelphia (Delaware, District of Columbia, Maryland, Pennsylvania, Virginia, West Virginia), Atlanta (Alabama, Florida, Georgia, Kentucky, Mississippi, North Carolina, South Carolina, Tennessee), Chicago (Illinois, Indiana, Michigan, Minnesota, Ohio, Wisconsin), Dallas (Arkansas, Louisiana, New Mexico, Oklahoma, Texas), Kansas City (Iowa, Kansas, Missouri, Nebraska), Denver (Colorado, Montana, North Dakota, South Dakota, Utah, Wyoming), San Francisco (Arizona, California, Hawaii, Nevada, Pacific Territories), Seattle (Alaska, Idaho, Oregon, Washington). Follow-up varied by region and ranged from an average of 6% of TBI cases in the Boston region to 23% of cases in the Seattle region.
Descriptive statistics and modeling
Sample characteristics were compiled and compared between included and excluded patients (ANOVA and Chi squares). Distinct trajectories of functional status were developed using latent class mixture models.29, 30 Each trajectory is modeled with its own functional form (e.g., linear, quadratic) and direction simultaneously. The models were created using the user-written Stata procedure, “traj”30. Because the FIM rating is bounded by an upper and lower limit, FIM ratings were modeled as censored normal distributions using a tobit regression. Separate trajectories were developed for cognitive and motor functioning.
Model selection was determined by comparing Bayesian information criterion (BIC) between models. A 2× change in BIC approximates the log of the Bayes factor31 and allows for comparisons of both the number of trajectories and functional forms of each trajectory. We compared models with one to six trajectories and tested the significance of the trajectory functional forms. Model adequacy was further assessed by examining posterior probabilities of group membership with 70% being acceptable. This approach identified three quadratic trajectories for both cognitive and motor FIM. All analyses were performed using Stata13 mp software (StataCorp. 2013. College Station, TX).
RESULTS
The 2002–2010 UDSMR data included 199,928 TBI patients; only those with follow-up information were included in the analyses (n=16,583). Table 1 describes the characteristics of the final sample as well as those excluded. Compared to those excluded from the study, patients in the final sample were more likely to be younger than 45 years, married, and white; have Medicaid, commercial, or other insurance; live in western regions of the United States (Chicago, Kansas City, Denver, San Francisco, and Seattle); and have a tier 2 comorbidity and higher functional status at both admission and discharge. Conversely, the included group was less likely to be older than 74 years, female, black, and Hispanic; have Medicare insurance; live in eastern regions of the United States (Boston, New York, Philadelphia, Atlanta, and Dallas); have a tier 1 comorbidity and closed head injury; and they also experienced shorter lengths of stay on average. There was no significant difference between groups in duration from injury to rehabilitation admission.
Table 1.
Characteristics of Traumatic Brain Injury patients discharged alive from inpatient rehabilitation by study inclusion status, UDSMR 2002–2010, % or mean (SD)
| Excluded | Included | ||
|---|---|---|---|
| n | 107,130 | 16,583 | |
| Age Group: | |||
| <45 | 30.96 | 34.94 | * |
| 45–64 | 21.44 | 21.32 | |
| 65–74 | 13.83 | 14.04 | |
| 75+ | 33.76 | 29.70 | * |
| Married | 40.38 | 43.99 | * |
| Female | 36.69 | 34.58 | * |
| Race/Ethnicity: | |||
| White | 78.09 | 80.8 | * |
| Black | 8.43 | 6.72 | * |
| Hispanic | 7.95 | 6.85 | * |
| Other | 5.92 | 5.93 | |
| Payer: | |||
| Medicare | 47.46 | 43.19 | * |
| Medicaid | 9.30 | 9.98 | * |
| Commercial/BCBS | 19.56 | 22.06 | * |
| Other Payer | 23.68 | 24.77 | * |
| CMS Region: | |||
| Boston | 4.76 | 2.15 | * |
| New York | 9.69 | 4.59 | * |
| Philadelphia | 14.53 | 12.61 | * |
| Atlanta | 17.96 | 14.83 | * |
| Chicago | 13.20 | 22.95 | * |
| Dallas | 13.36 | 5.12 | * |
| Kansas City | 6.40 | 7.94 | * |
| Denver | 5.46 | 8.95 | * |
| San Francisco | 11.47 | 14.78 | * |
| Seattle | 3.16 | 6.10 | * |
| CMS Comorbidities: | |||
| Tier 0 | 58.11 | 57.92 | |
| Tier 1 | 8.13 | 7.66 | * |
| Tier 2 | 16.85 | 18.11 | * |
| Tier 3 | 16.91 | 16.31 | |
| TBI - Closed | 95.11 | 94.63 | * |
| FIM Rating – Total | |||
| Admission | 54.78 (21.73) | 58.52 (21.33) | * |
| Discharge | 84.83 (24.81) | 90.00 (20.91) | * |
| Follow-up | 111.63 (18.75) | ||
| FIM Rating – Cognitive | |||
| Admission | 17.20 (8.06) | 17.99 (7.92) | * |
| Discharge | 23.03 (7.48) | 24.06 (6.73) | * |
| Follow-up | 31.14 (5.19) | ||
| FIM Rating – Motor | |||
| Admission | 35.41 (15.22) | 38.17 (15.03) | * |
| Discharge | 57.65 (18.10) | 61.50 (15.33) | * |
| Follow-up | 80.48 (15.28) | ||
| Onset | 18.45 (28.38) | 18.51 (27.43) | |
| LOS | 17.19 (15.15) | 16.30 (12.44) | * |
| Follow-up (days) | 1119.60 (26.31) |
denotes statistical differences using critical values adjusted for multiple comparisons within families of outcomes (demographics: p < 0.004; region: p < 0.005; and condition: p < 0.003).
Figure 1 plots the grand mean (double line) as well as the unique trajectory groups for cognitive (upper panel) and motor (lower panel) FIM ratings. In all cases FIM ratings increased over time. Three unique trajectory groups were identified for both cognitive and motor FIM. The low group had the lowest admission FIM ratings with relatively little improvement over time. The moderate group had admission FIM ratings just below the population mean, but the values were equitable by follow-up. The high group had the highest FIM rating at all three assessment periods. Posterior probabilities of group membership were generally high ranging from 88–91% for cognitive to 84–93% for motor FIM.
Figure 1.
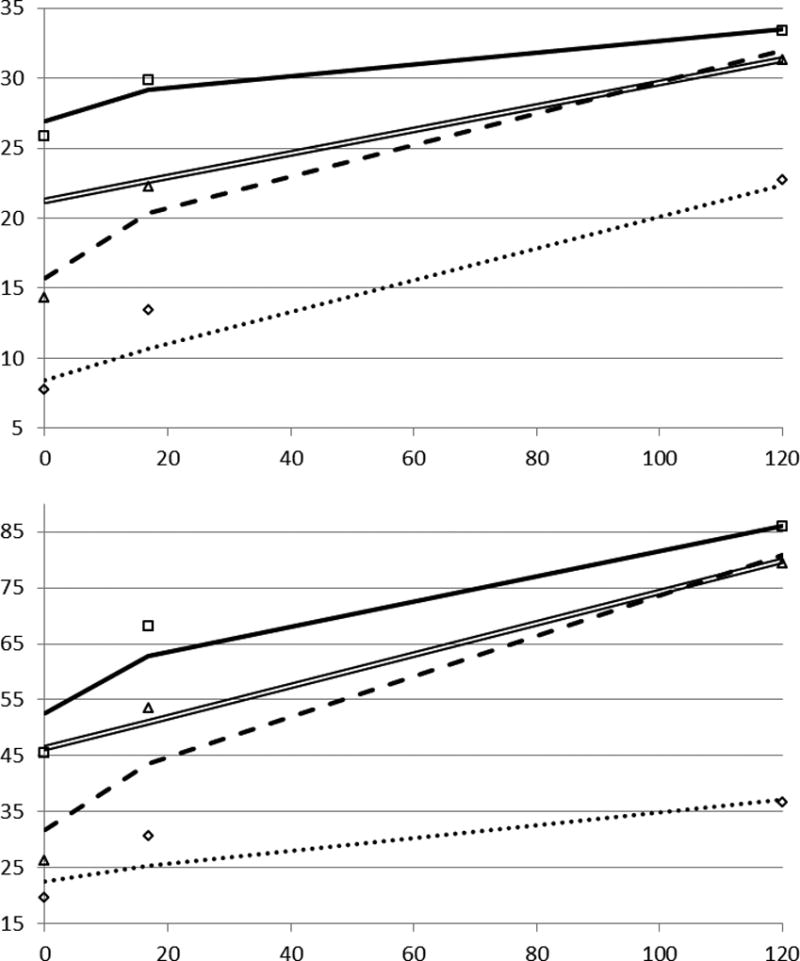
Plots of cognitive FIM rating (top panel) and motor FIM rating (bottom panel) predicted from linear models (double line) and predicted and observed (icons) values for three trajectory groups: low FIM rating (dotted line), moderate FIM rating (dashed line), and high FIM rating (solid line).
Table 2 summarizes trajectory group characteristics for cognitive and motor FIM and provides comparisons of frequencies (chi square) and means (ANOVA) across groups. While there were significant differences across all three trajectory groups, we highlight the differences between the high and low trajectory groups below. When comparing the low and high cognitive FIM trajectory groups, patients in the low group were more likely to be younger than 45 years, black, Hispanic, and other race/ethnicity; have Medicaid and other payers; live in Atlanta and San Francisco; have a tier 1 and tier 2 comorbidity; and experience much longer durations from injury to rehabilitation admission and longer lengths of stay in rehabilitation. In turn, the high cognitive trajectory group was more likely to be 65 years or older, female, married, and white; have Medicare coverage; live in New York, Philadelphia, Kansas City, and Seattle; have no tier comorbidity and tier 3 comorbidity; and exhibit higher functional status at all three observations
Table 2.
Characteristics (% or mean (SD)) of trajectory groups for cognitive and motor FIM ratings for patients with TBI.
| Cognitive FIM | Motor FIM | |||||||||||
|---|---|---|---|---|---|---|---|---|---|---|---|---|
| Low | Moderate | High | Low | Moderate | High | |||||||
| n | 1733 | 7690 | 7160 | 1298 | 5847 | 9438 | ||||||
| Age Group: | ||||||||||||
| <45 | 43.16 | 41.25 | b | 26.15 | c | 28.22 | 31.28 | b | 38.11 | c | ||
| 45–64 | 21.81 | 22.39 | b | 20.06 | 15.81 | 18.74 | b | 23.68 | c | |||
| 65–74 | 12.23 | 12.57 | b | 16.06 | c | 15.27 | 14.96 | b | 13.31 | |||
| 75+ | 22.79 | 23.78 | b | 37.74 | c | 40.71 | a | 35.01 | b | 24.91 | c | |
| Female | 29.83 | 28.83 | b | 41.91 | c | 36.62 | 35.86 | b | 33.51 | |||
| Married | 41.03 | 42.60 | b | 46.23 | c | 45.03 | 46.01 | b | 42.62 | |||
| Race/Ethnicity: | ||||||||||||
| White | 74.78 | a | 78.43 | b | 84.83 | c | 75.33 | a | 79.48 | b | 82.39 | c |
| Black | 8.14 | 7.78 | b | 5.25 | c | 6.86 | 7.73 | b | 6.08 | |||
| Hispanic | 9.35 | a | 7.52 | b | 5.54 | c | 9.71 | 7.63 | b | 5.99 | c | |
| Other Eth | 7.96 | 6.62 | b | 4.66 | c | 8.56 | a | 5.46 | 5.84 | c | ||
| Payer: | ||||||||||||
| Medicare | 34.22 | 36.24 | b | 52.85 | c | 54.97 | a | 48.67 | b | 38.19 | c | |
| Medicaid | 16.21 | a | 12.03 | b | 6.27 | c | 13.49 | a | 10.81 | b | 8.98 | c |
| Commercial | 22.22 | 23.37 | b | 20.61 | 15.81 | 17.68 | b | 25.63 | c | |||
| Other Payer | 27.35 | 28.36 | b | 20.27 | c | 15.73 | a | 22.83 | b | 27.2 | c | |
| CMS Region: | ||||||||||||
| Boston | 1.90 | 2.030 | 2.33 | 1.62 | 2.07 | 2.27 | ||||||
| New York | 4.50 | a | 3.16 | b | 6.13 | c | 6.17 | 4.53 | 4.40 | c | ||
| Philadelphia | 12.06 | 10.40 | b | 15.07 | c | 11.57 | 12.66 | 12.69 | ||||
| Atlanta | 17.37 | 16.27 | b | 12.68 | c | 19.35 | 18.98 | b | 11.64 | c | ||
| Chicago | 24.00 | 22.33 | 23.37 | 16.81 | a | 21.33 | b | 24.8 | c | |||
| Dallas | 6.29 | a | 4.27 | b | 5.77 | 6.01 | a | 4.02 | b | 5.69 | ||
| Kansas City | 6.12 | a | 8.10 | 8.21 | c | 6.86 | 7.29 | b | 8.05 | |||
| Denver | 8.83 | 8.52 | 9.44 | 5.86 | 6.40 | b | 10.95 | c | ||||
| San Francisco | 17.08 | 18.96 | b | 9.73 | c | 21.28 | 19.24 | b | 11.12 | c | ||
| Seattle | 1.85 | a | 5.97 | b | 7.26 | c | 4.47 | 3.49 | b | 7.94 | c | |
| CMS Comorbidities: | ||||||||||||
| Tier 0 | 33.81 | a | 50.95 | b | 71.23 | c | 35.62 | a | 39.61 | b | 72.32 | c |
| Tier 1 | 20.77 | a | 9.22 | b | 2.79 | c | 15.73 | 13.31 | b | 3.04 | c | |
| Tier 2 | 32.72 | a | 24.24 | b | 8.00 | c | 32.31 | a | 28.17 | b | 9.94 | c |
| Tier 3 | 2.69 | a | 15.59 | b | 17.97 | c | 16.35 | 18.92 | b | 14.70 | ||
| Closed Injury | 92.96 | 94.27 b | 95.43 c | 93.45 | 94.6 | 94.82 | ||||||
| Onset (days) | 40.66 (51.39) a | 19.68 (25.94) b | 11.88 (14.76) c | 45.66 (62.95) a | 22.28 (27.72) b | 12.44 (12.48) c | ||||||
| LOS | 31.00 (21.87) a | 17.97 (10.66) b | 10.96 (6.07) c | 28.31 (22.50) a | 22.15 (12.72) b | 11.03 (5.78) c | ||||||
| FIM Rating: | ||||||||||||
| Admission | 30.07 (13.13) a | 50.34 (16.85) b | 74.18 (13.91) c | 33.71 (14.34) a | 42.33 (14.95) b | 71.95 (14.31) c | ||||||
| Discharge | 58.71 (23.21) a | 87.23 (17.75) b | 100.55 (13.69) c | 50.14 (19.22) a | 80.62 (16.98) b | 101.29 (11.77) c | ||||||
| Follow-up | 84.16 (29.29) a | 113.10 (15.51) b | 116.69 (11.75) c | 60.79 (21.67) a | 111.16 (12.75) b | 118.62 (8.73) c | ||||||
significant difference (adjusted for multiple comparisons) comparing low to moderate trajectory;
significant difference (adjusted for multiple comparisons) comparing moderate to high trajectory;
significant difference (adjusted for multiple comparisons) comparing low to high trajectory
Regarding significant differences between the low and high motor FIM trajectory groups, patients in the low group were more likely to be 65 years and older, Hispanic and other race/ethnicity; have Medicare and Medicaid coverage; live in New York, Atlanta and San Francisco; have a tier 1 or tier 2 comorbidity; and to experience much longer durations from injury to rehabilitation admission and longer lengths of stay in rehabilitation. In turn, the high motor trajectory group was more likely to be younger than 65 and white; have commercial and other payer; live in Chicago, Denver, and Seattle; have no tier comorbidity; and exhibit higher functional status at all three observations.
The results of multinomial logit models predicting odds of group membership are presented in Table 3. The highest functioning group is the referent in both FIM subscales. In analysis of cognitive FIM rating, increasing age was unexpectedly associated with decreasing odds of membership in both the low and moderate rating groups. The corresponding odds ratio of membership in the low group for older age (75 years +) was 0.66 (95% CI 0.53–0.83) and for the moderate group was 0.55 (95% CI 0.47–0.63). Compared to Whites, Blacks had increased odds of membership in the low FIM rating groups (OR 1.30, 95% CI 1.01–1.67) and the moderate FIM rating group (OR 1.24 95% CI 1.04–1.28). Closed injury was associated with low and moderate trajectory groups for cognitive function. Each increased day onset to rehabilitation admission was associated with increased odds of membership in the low and moderate trajectory groups.
Table 3.
Results of multinomial logit models predicting trajectory group membership for cognitive and motor FIM, UDSMR 2002–2010, OR (95% CI). High FIM rating trajectory group is referent for both FIM categories.
| Cognitive FIM | Motor FIM | |||||||
|---|---|---|---|---|---|---|---|---|
| Low | Moderate | Low | Moderate | |||||
| OR | (95% CI) | OR | (95% CI) | OR | (95% CI) | OR | (95% CI) | |
| Age Group: | ||||||||
| <45 (ref) | ||||||||
| 45–64 | 0.92 | (0.77 – 1.10) | 0.81 | (0.72 – 0.91) | 1.51 | (1.21 – 1.88) | 1.20 | (1.06 – 1.37) |
| 65–74 | 0.64 | (0.50 – 0.83) | 0.61 | (0.52 – 0.71) | 2.79 | (2.13 – 3.65) | 1.70 | (1.43 – 2.02) |
| 75 + | 0.66 | (0.53 – 0.83) | 0.55 | (0.47 – 0.63) | 5.80 | (4.53 – 7.41) | 2.80 | (2.39 – 3.28) |
| Female | 0.73 | (0.63 – 0.84) | 0.70 | (0.64 – 0.76) | 1.17 | (1.01 – 1.36) | 1.15 | (1.05 – 1.26) |
| Married | 0.96 | (0.83 – 1.10) | 1.01 | (0.92 – 1.11) | 1.03 | (0.88 – 1.19) | 1.12 | (1.02 – 1.23) |
| Race/Ethnicity: | ||||||||
| White (ref) | ||||||||
| Black | 1.30 | (1.01 – 1.67) | 1.24 | (1.04 – 1.48) | 1.19 | (0.90 – 1.57) | 1.20 | (1.00 – 1.43) |
| Hispanic | 1.03 | (0.80 – 1.34) | 0.82 | (0.68 – 0.99) | 1.36 | (1.04 – 1.78) | 0.95 | (0.79 – 1.15) |
| Other Ethnicity | 1.71 | (1.31 – 2.21) | 1.19 | (0.99 – 1.44) | 1.29 | (0.98 – 1.69) | 0.80 | (0.66 – 0.98) |
| Payer: | ||||||||
| Public Ins. (ref) | ||||||||
| Commercial Ins | 0.75 | (0.61 – 0.91) | 0.89 | (0.77 – 1.01) | 0.61 | (0.48 – 0.76) | 0.70 | (0.61 – 0.81) |
| Other payer | 0.86 | (0.71 – 1.04) | 1.03 | (0.91 – 1.18) | 0.52 | (0.42 – 0.65) | 0.78 | (0.68 – 0.89) |
| CMS Comorbidity: | ||||||||
| Tier 0 (ref) | ||||||||
| Tier 1 | 8.22 | (6.53 – 10.35) | 2.92 | (2.38 – 3.60) | 11.97 | (9.31 – 15.4) | 7.69 | (6.39 – 9.24) |
| Tier 2 | 6.21 | (5.25 – 7.34) | 3.43 | (3.02 – 3.90) | 6.07 | (5.08 – 7.25) | 4.68 | (4.15 – 5.28) |
| Tier 3 | 1.26 | (1.04 – 1.53) | 1.14 | (1.02 – 1.28) | 2.05 | (1.68 – 2.50) | 2.20 | (1.96 – 2.47) |
| Closed injury | 0.90 | (0.69 – 1.18) | 1.08 | (0.89 – 1.31) | 0.71 | (0.53 – 0.95) | 0.91 | (0.75 – 1.10) |
| Onset (days) | 1.03 | (1.03 – 1.03) | 1.02 | (1.01 – 1.02) | 1.05 | (1.04 – 1.05) | 1.03 | (1.03 – 1.04) |
| CMS Region: | ||||||||
| Boston (ref) | ||||||||
| New York | 1.05 | (0.62 – 1.79) | 0.71 | (0.50 – 0.99) | 1.62 | (0.91 – 2.88) | 1.04 | (0.73 – 1.48) |
| Philadelphia | 1.02 | (0.63 – 1.64) | 0.85 | (0.63 – 1.14) | 1.24 | (0.72 – 2.12) | 1.08 | (0.79 – 1.48) |
| Atlanta | 1.82 | (1.14 – 2.92) | 1.62 | (1.20 – 2.18) | 2.50 | (1.48 – 4.24) | 1.95 | (1.43 – 2.65) |
| Chicago | 1.65 | (1.04 – 2.62) | 1.28 | (0.96 – 1.72) | 1.03 | (0.61 – 1.74) | 1.03 | (0.76 – 1.40) |
| Dallas | 1.58 | (0.95 – 2.64) | 1.05 | (0.75 – 1.46) | 1.37 | (0.77 – 2.44) | 0.82 | (0.57 – 1.16) |
| Kansas City | 1.28 | (0.77 – 2.11) | 1.35 | (0.99 – 1.85) | 1.33 | (0.76 – 2.32) | 1.03 | (0.75 – 1.43) |
| Denver | 1.26 | (0.77 – 2.06) | 1.14 | (0.84 – 1.55) | 0.70 | (0.40 – 1.25) | 0.72 | (0.52 – 0.99) |
| San Francisco | 1.69 | (1.04 – 2.73) | 2.13 | (1.58 – 2.89) | 2.05 | (1.20 – 3.49) | 1.86 | (1.36 – 2.54) |
| Seattle | 0.30 | (0.16 – 0.56) | 0.93 | (0.67 – 1.28) | 0.48 | (0.27 – 0.88) | 0.42 | (0.30 – 0.60) |
In the analysis of motor FIM rating, odds of membership in the low rating group increased from age 45–64 (OR 1.51, 95% CI 1.21–1.88) to age 75+ (OR 5.80, 95% CI 4.53–7.41). Compared to Whites, Hispanics demonstrated increased odds of membership in the low FIM rating group (OR 1.36,95% 1.04–1.78). Closed injury was associated with reduced odds of membership in both the low and moderate FIM rating groups. The Atlanta CMS region was associated with membership in the low and moderate groups compared to the high group (OR 2.50, 95% CI 1.48–4.24 and OR 1.95, 95% CI 1.43–2.65 respectively) as was the San Francisco region (OR 2.05, 95% CI 1.20–3.49 and OR 1.86, 95% CI 1.36–2.54 respectively). Conversely, the Denver region was associated with reduced odds of membership in the moderate group compared to the high FIM rating group (OR 0.72, 95% CI 0.52–0.99) as was the Seattle CMS region (OR 0.42, 95% CI 0.30–0.60).
DISCUSSION
Inpatient rehabilitation following TBI facilitates recovery of functional independence. While overall mean improvements are observed and thus, often assumed, the heterogeneous neuropathology of individual injuries leads to substantial variation in recovery trajectories. Using data from the UDSMR for 2002–2010 we identified three different trajectories of functional recovery from admission to inpatient rehabilitation through follow-up for cognitive and motor FIM ratings.
The majority of patients with TBI achieved ratings near the upper bounds of the FIM instrument at follow-up regardless of functional status at admission. However, a group of patients with low FIM ratings at admission demonstrated relatively little improvement over time. This slowly improving trajectory was most evident in motor recovery; however, it is important to note that this low gaining group comprised only 8% of the total sample while the high gaining group comprised 56% of the sample. It is possible that our results under-represent this low FIM category as the excluded group (without follow-up) had significantly lower FIM ratings and significantly long stays in hospital prior to rehabilitation suggesting a poorer recovery prognosis.
The association of increased age with the low-gaining motor group was not surprising. Older adults possess less reserve capacity to recover from neural deficits or loss of physical strength during periods of immobilization. Moreover, older adults typically spend more time in injury-related coma and have more complications.32 Other studies have shown a similar association between age and functional recovery.15, 33, 34 Conversely, our findings indicating that older age was associated with lower odds of being in the low-gaining cognitive group was unexpected. Additional, prospective research is needed to either confirm or clarify this counter-intuitive relationship. For our study, it is plausible that individuals in the older age group with very low baseline cognitive functioning were disproportionately lost to follow-up based on higher mortality and/or institutionalization rates.
Significant geographic variation in health care spending,35 and post-acute utilization have been reported36, 37. We found an inconsistent association between geographic region and trajectory group membership across FIM categories with no clear pattern. One possible explanation for regional differences is limited availability in some regions37. We also observed geographic differences in inclusion status in our sample. Regional variation in the collection of follow-up FIM may also have led to the differences observed in our analysis. Two of the regions which had the highest rates of inclusion (Atlanta and San Francisco) were also significantly associated with odds of being in a lower FIM trajectory. Because the CMS regions are administrative divisions and not designed for balance across inpatient rehabilitation facilities, it is possible that the differences in catchment areas for the regions could contribute to variation in FIM ratings.
Our analyses indicated that Black and Hispanic patients were more likely to be in the low function trajectory compared to Whites, which is consistent with prior studies showing racial/ethnic disparities in functional outcomes post TBI.17, 38–40 The reasons for these differences are unclear. Potential explanations include disparities in access to and/or quality of care across the continuum.18, 20, 41, 42 While our study could not adjust for care received prior to inpatient rehabilitation, Blacks and Hispanics had lower total FIM ratings on admission to rehabilitation than Whites. Whether this difference was due to variation in injury severity or acute care factors is unknown. However, some studies have not found ethnic disparities in functional outcomes43–45, which warrant the need to thoroughly investigate functional outcomes using large samples with TBI.
Cross-cultural validity of the FIM is absent from the current TBI literature, which may indicate a potential cultural bias in functional assessment of ethnic minorities with TBI. Several factors may affect how the person with injury interact and engage with the healthcare professional performing the assessment, such as language barriers, acculturation, cultural beliefs and traditions, and perceptions or understanding of TBI. Also, cultural variation in how individuals perform activities of daily living and their reliance on others to perform such activities may exist. If a systematic bias in FIM ratings of non-English speaking-persons with TBI exists in assessments of their communication abilities46, it is possible that this bias is present in assessment of the other cognitive and motor items.
Organizational factors, such as therapy duration and intensity, may impact functional outcomes of persons with TBI. Some evidence suggests that Black and Hispanic patients with TBI receive shorter, less intensive therapy during inpatient rehabilitation.43 However, in our sample Black and Hispanic ethnicity were both associated with longer duration of rehabilitation (1.01 and 1.60 days, respectively). Age, severity of injury, medical complications, and medical interruptions are associated with length of stay47, 48.The observed association between minority status and reduced functional gains may be due to factors unmeasured in our data such as variation in social support and differences in the physical environment.
Delayed admission in the low gain group was more than three times that of the higher gain group. Days from onset reflects the time the patient spent in acute care achieving stability sufficient to benefit from rehabilitation. Longer delays in entering inpatient rehabilitation could imply greater severity of injury or complexity due to other factors/conditions.
The latent trajectory models offer a different perspective on functional gains over time compared to standard linear models. The plots of the grand mean from linear models and those from the trajectories highlight the limits of estimations based only on a grand mean. The low and high trajectory groups are not evident in the traditional linear models approach. Identifying factors associated with the low (at-risk) group can facilitate treatment planning and patient-centered intervention. Patients at risk for a low gaining trajectory may benefit from more intensive physical and cognitive interventions and more therapy hours. Such insight may also inform the use of combination therapies, such as pharmacological, behavioral, and cognitive rehabilitation, to improve functional outcomes.
Limitations
Several limitations in our study are important to note. First, our sample was limited to patients in the UDSMR database who also had complete follow-up FIM assessments. Our findings may not be representative of all patients with TBI. Second, we had no direct measure of injury severity such as the Glasgow Coma Scale (GCS)49, post-traumatic amnesia (PTA), or time to follow commands. While we used injury type (open vs. closed) and the CMS Tier comorbidity system as covariates, they do not distinguish inherent heterogeneity of acute TBIs. Third, our study had only one follow-up assessment, which was on average 103 days. Thus, we could not estimate changes in functional status beyond that timeframe.
Conclusion
Inpatient rehabilitation following TBI is associated with overall gains in functional recovery measured by cognitive and motor FIM ratings. However, a small subset of patients is admitted with low FIM ratings and demonstrates minimal improvement. Identifying subgroups with poor recovery trajectories provides the opportunity to develop rehabilitation strategies tailored to their unique needs. In turn, this information can better inform patient-centered care and facility-level quality improvement efforts.
Acknowledgments
This project was supported in part by grants from the National Institutes of Health (grant numbers R01 HD069443; R24 HD065702)
Abbreviations
- FIM
Functional independence Measure
- TBI
Traumatic brain Injury
- UDSMR
Uniform Data System for Medical Rehabilitation
References
- 1.Faul M, Xu L, Wald M, Coronado VG. Traumatic brain injury in the United States: emergency department visits, hospitalizations and deaths 2002–2006. Atlanta, GA: Centers for Disease Control and Prevention, National Center for Injury Prevention and Control; 2010. pp. 2–70. [Google Scholar]
- 2.Langlois JA, Rutland-Brown W, Thomas KE. Traumatic brain injury in the United States: emergency department visits, hospitalizations, and deaths. Department of Health and Human Services, Centers for Disease Control and Prevention, National Center for Injury Prevention and Control; 2006. [Google Scholar]
- 3.Dahdah MN, Barnes S, Buros A, Dubiel R, Dunklin C, Callender L, et al. Variations in Inpatient Rehabilitation Functional Outcomes Across Centers in the Traumatic Brain Injury Model Systems Study and the Influence of Demographics and Injury Severity on Patient Outcomes. Archives of Physical Medicine and Rehabilitation. 2016;97(11):1821–31. doi: 10.1016/j.apmr.2016.05.005. [DOI] [PubMed] [Google Scholar]
- 4.Hart T, Kozlowski AJ, Whyte J, Poulsen I, Kristensen K, Nordenbo A, et al. Functional Recovery After Severe Traumatic Brain Injury: An Individual Growth Curve Approach. Archives of Physical Medicine and Rehabilitation. 2014;95(11):2103–10. doi: 10.1016/j.apmr.2014.07.001. [DOI] [PubMed] [Google Scholar]
- 5.Whitlock JA, Jr, Hamilton BB. Functional outcome after rehabilitation for severe traumatic brain injury. Archives of Physical Medicine and Rehabilitation. 1995;76(12):1103–12. doi: 10.1016/s0003-9993(95)80117-0. [DOI] [PubMed] [Google Scholar]
- 6.Colantonio A, Ratcliff G, Chase S, Kelsey S, Escobar M, Vernich L. Long-term outcomes after moderate to severe traumatic brain injury. Disability & Rehabilitation. 2004;26(5):253–61. doi: 10.1080/09638280310001639722. [DOI] [PubMed] [Google Scholar]
- 7.deGuise E, leBlanc J, Feyz M, Meyer K, Duplantie J, Thomas H, et al. Long-term outcome after severe traumatic brain injury: the McGill interdisciplinary prospective study. Journal of Head Trauma Rehabilitation. 2008;23(5):294–303. doi: 10.1097/01.HTR.0000336842.53338.f4. [DOI] [PubMed] [Google Scholar]
- 8.Coronado VG, Thomas KE, Sattin RW, Johnson RL. The CDC traumatic brain injury surveillance system: characteristics of persons aged 65 years and older hospitalized with a TBI. Journal of Head Trauma Rehabilitation. 2005;20(3):215–28. doi: 10.1097/00001199-200505000-00005. [DOI] [PubMed] [Google Scholar]
- 9.Keightley ML, Côté P, Rumney P, Hung R, Carroll LJ, Cancelliere C, et al. Psychosocial Consequences of Mild Traumatic Brain Injury in Children: Results of a Systematic Review by the International Collaboration on Mild Traumatic Brain Injury Prognosis. Archives of Physical Medicine and Rehabilitation. 2014;95(3, Supplement):S192–S200. doi: 10.1016/j.apmr.2013.12.018. [DOI] [PubMed] [Google Scholar]
- 10.Catroppa C, Anderson VA, Morse SA, Haritou F, Rosenfeld JV. Outcome and Predictors of Functional Recovery 5 Years Following Pediatric Traumatic Brain Injury (TBI) Journal of Pediatric Psychology. 2008;33(7):707–18. doi: 10.1093/jpepsy/jsn006. [DOI] [PubMed] [Google Scholar]
- 11.Anderson VA, Morse SA, Catroppa C, Haritou F, Rosenfeld JV. Thirty month outcome from early childhood head injury: a prospective analysis of neurobehavioural recovery. Brain. 2004;127(12):2608–20. doi: 10.1093/brain/awh320. [DOI] [PubMed] [Google Scholar]
- 12.Cifu DX, Kreutzer JS, Marwitz JH, Rosenthal M, Englander J, High W. Functional outcomes of older adults with traumatic brain injury: A prospective, multicenter analysis. Archives of Physical Medicine and Rehabilitation. 1996;77(9):883–8. doi: 10.1016/s0003-9993(96)90274-9. [DOI] [PubMed] [Google Scholar]
- 13.Katz DI, Alexander MP. Traumatic brain injury: Predicting course of recovery and outcome for patients admitted to rehabilitation. Archives of Neurology. 1994;51(7):661–70. doi: 10.1001/archneur.1994.00540190041013. [DOI] [PubMed] [Google Scholar]
- 14.Susman M, DiRusso SM, Sullivan T, Risucci D, Nealon P, Cuff S, et al. Traumatic brain injury in the elderly: increased mortality and worse functional outcome at discharge despite lower injury severity. Journal of Trauma-Injury Infection & Critical Care. 2002;53(2):219–23. doi: 10.1097/00005373-200208000-00004. discussion 23-4. [DOI] [PubMed] [Google Scholar]
- 15.Hukkelhoven CWPM, Steyerberg EW, Rampen AJJ, Farace E, Habbema JDF, Marshall LF, et al. Patient age and outcome following severe traumatic brain injury: an analysis of 5600 patients. Journal of Neurosurgery. 2003;99(4):666–73. doi: 10.3171/jns.2003.99.4.0666. [DOI] [PubMed] [Google Scholar]
- 16.Graham JE, Fisher SR, Bergés I-M, Kuo Y-F, Ostir GV. Walking speed threshold for classifying walking independence in hospitalized older adults. Physical therapy. 2010;90(11):1591–7. doi: 10.2522/ptj.20100018. [DOI] [PMC free article] [PubMed] [Google Scholar]
- 17.Staudenmayer KL, Diaz-Arrastia R, de Oliveira A, Gentilello LM, Shafi S. Ethnic disparities in long-term functional outcomes after traumatic brain injury. Journal of Trauma and Acute Care Surgery. 2007;63(6):1364–9. doi: 10.1097/TA.0b013e31815b897b. [DOI] [PubMed] [Google Scholar]
- 18.Shafi S, de la Plata CM, Diaz-Arrastia R, Bransky A, Frankel H, Elliott AC, et al. Ethnic disparities exist in trauma care. Journal of Trauma-Injury, Infection, and Critical Care. 2007;63(5):1138–42. doi: 10.1097/TA.0b013e3181568cd4. [DOI] [PubMed] [Google Scholar]
- 19.Meagher AD, Beadles CA, Doorey J, Charles AG. Racial and ethnic disparities in discharge to rehabilitation following traumatic brain injury. Journal of Neurosurgery. 2015;122(3):595–601. doi: 10.3171/2014.10.JNS14187. [DOI] [PubMed] [Google Scholar]
- 20.Bowman SM, Martin DP, Sharar SR, Zimmerman FJ. Racial disparities in outcomes of persons with moderate to severe traumatic brain injury. Medical Care. 2007;45(7):686–90. doi: 10.1097/MLR.0b013e31803dcdf3. [DOI] [PubMed] [Google Scholar]
- 21.Seel RT, Barrett RS, Beaulieu CL, Ryser DK, Hammond FM, Cullen N, et al. Institutional Variation in Traumatic Brain Injury Acute Rehabilitation Practice. Archives of Physical Medicine and Rehabilitation. 2015;96(8, Supplement):S197–S208. doi: 10.1016/j.apmr.2015.02.034. [DOI] [PubMed] [Google Scholar]
- 22.Muthén B, Shedden K. Finite Mixture Modeling with Mixture Outcomes Using the EM Algorithm. Biometrics. 1999;55(2):463–9. doi: 10.1111/j.0006-341x.1999.00463.x. [DOI] [PubMed] [Google Scholar]
- 23.Nagin DS. Analyzing developmental trajectories: a semiparametric, group-based approach. Psychological methods. 1999;4(2):139. doi: 10.1037/1082-989x.6.1.18. [DOI] [PubMed] [Google Scholar]
- 24.Smith PM, Illig SB, Fiedler RC, Hamilton BB, Ottenbacher KJ. Intermodal agreement of follow-up telephone functional assessment using the Functional Independence Measure in patients with stroke. Arch Phys Med Rehabil. 1996;77(5):431–5. doi: 10.1016/s0003-9993(96)90029-5. Epub 1996/05/01. [DOI] [PubMed] [Google Scholar]
- 25.Graham JE, Granger CV, Karmarkar AM, Deutsch A, Niewczyk P, DiVita MA, et al. The Uniform Data System for Medical Rehabilitation: report of follow-up information on patients discharged from inpatient rehabilitation programs in 2002–2010. American journal of physical medicine & rehabilitation/Association of Academic Physiatrists. 2014;93(3):231–44. doi: 10.1097/PHM.0b013e3182a92c58. [DOI] [PMC free article] [PubMed] [Google Scholar]
- 26.Corrigan JD, Smith-Knapp K, Granger CV. Validity of the functional independence measure for persons with traumatic brain injury. Archives of Physical Medicine and Rehabilitation. 1997;78(8):828–34. doi: 10.1016/s0003-9993(97)90195-7. [DOI] [PubMed] [Google Scholar]
- 27.Ottenbacher KJ, Hsu Y, Granger CV, Fiedler RC. The reliability of the functional independence measure: A quantitative review. Archives of Physical Medicine and Rehabilitation. 1996;77(12):1226–32. doi: 10.1016/s0003-9993(96)90184-7. [DOI] [PubMed] [Google Scholar]
- 28.Services CfMM. Appendix C - List of Comorbidities. [cited 2015 January 7];2010 Available from: http://www.cms.gov/Medicare/Medicare-Fee-for-Service-Payment/InpatientRehabFacPPS/Data-Files.html.
- 29.Jones BL, Nagin DS, Roeder K. A SAS procedure based on mixture models for estimating developmental trajectories. Sociological Methods & Research. 2001;29(3):374–93. [Google Scholar]
- 30.Jones B, Nagin D. A Stata plugin for estimating group-based trajectory models. 2012 Retrieved. [Google Scholar]
- 31.Wasserman L. Bayesian model selection and model averaging. Journal of mathematical psychology. 2000;44(1):92–107. doi: 10.1006/jmps.1999.1278. [DOI] [PubMed] [Google Scholar]
- 32.Rothweiler B, Temkin NR, Dikmen SS. Aging effect on psychosocial outcome in traumatic brain injury. Archives of Physical Medicine and Rehabilitation. 1998;79(8):881–7. doi: 10.1016/s0003-9993(98)90082-x. [DOI] [PubMed] [Google Scholar]
- 33.Mushkudiani NA, Engel DC, Steyerberg EW, Butcher I, Lu J, Marmarou A, et al. Prognostic value of demographic characteristics in traumatic brain injury: results from the IMPACT study. Journal of Neurotrauma. 2007;24(2):259–69. doi: 10.1089/neu.2006.0028. [DOI] [PubMed] [Google Scholar]
- 34.Cuthbert JP, Harrison-Felix C, Corrigan JD, Kreider S, Bell JM, Coronado VG, et al. Epidemiology of adults receiving acute inpatient rehabilitation for a primary diagnosis of traumatic brain injury in the United States. The Journal of Head Trauma Rehabilitation. 2015;30(2):122–35. doi: 10.1097/HTR.0000000000000012. [DOI] [PubMed] [Google Scholar]
- 35.Newhouse JP, Garber AM. Geographic variation in health care spending in the United States: insights from an Institute of Medicine report. JAMA. 2013;310(12):1227–8. doi: 10.1001/jama.2013.278139. [DOI] [PubMed] [Google Scholar]
- 36.Freburger JK, Holmes GM, Ku L-JE, Cutchin MP, Heatwole-Shank K, Edwards LJ. Disparities in Postacute Rehabilitation Care for Stroke: An Analysis of the State Inpatient Databases. Archives of Physical Medicine and Rehabilitation. 2011;92(8):1220–9. doi: 10.1016/j.apmr.2011.03.019. [DOI] [PMC free article] [PubMed] [Google Scholar]
- 37.Buntin MB, Garten AD, Paddock S, Saliba D, Totten M, Escarce JJ. How Much Is Postacute Care Use Affected by Its Availability? Health Services Research. 2005;40(2):413–34. doi: 10.1111/j.1475-6773.2005.00365.x. [DOI] [PMC free article] [PubMed] [Google Scholar]
- 38.Arango-Lasprilla JC, Rosenthal M, Deluca J, Komaroff E, Sherer M, Cifu D, et al. Traumatic brain injury and functional outcomes: Does minority status matter? Brain Injury. 2007;21(7):701–8. doi: 10.1080/02699050701481597. [DOI] [PubMed] [Google Scholar]
- 39.Struchen MA, Pappadis MR, Mazzei DK, Clark AN, Davis LC, Sander AM. Perceptions of communication abilities for persons with traumatic brain injury: Validity of the La Trobe Communication Questionnaire. Brain Injury. 2008;22(12):940–51. doi: 10.1080/02699050802425410. [DOI] [PubMed] [Google Scholar]
- 40.Hart T, O'Neil-Pirozzi TM, Williams KD, Rapport LJ, Hammond F, Kreutzer J. Racial differences in caregiving patterns, caregiver emotional function, and sources of emotional support following traumatic brain injury. The Journal of Head Trauma Rehabilitation. 2007;22(2):122–31. doi: 10.1097/01.HTR.0000265100.37059.44. [DOI] [PubMed] [Google Scholar]
- 41.Selassie AW, Pickelsimer EE, Frazier L, Jr, Ferguson PL. The effect of insurance status, race, and gender on ED disposition of persons with traumatic brain injury. The American journal of emergency medicine. 2004;22(6):465–73. doi: 10.1016/j.ajem.2004.07.024. [DOI] [PubMed] [Google Scholar]
- 42.Chang P-FJ, Ostir GV, Kuo Y-F, Granger CV, Ottenbacher KJ. Ethnic differences in discharge destination among older patients with traumatic brain injury. Archives of Physical Medicine and Rehabilitation. 2008;89(2):231–6. doi: 10.1016/j.apmr.2007.08.143. [DOI] [PMC free article] [PubMed] [Google Scholar]
- 43.Burnett DM, Kolakowsky-Hayner SA, Slater D, Stringer A, Bushnik T, Zafonte R, et al. Ethnographic analysis of traumatic brain injury patients in the national Model Systems database. Archives of Physical Medicine and Rehabilitation. 2003;84(2):263–7. doi: 10.1053/apmr.2003.50091. [DOI] [PubMed] [Google Scholar]
- 44.Rosenthal M, Dljkers M, Harrison-Felix C, Nabors N, Witol AD, Young ME, et al. Impact of Minority Status on Functional Outcome and Community Integration Following Traumatic Brain Injury. The Journal of Head Trauma Rehabilitation. 1996;11(5):40–57. [Google Scholar]
- 45.Jorge RE, Robinson RG, Starkstein SE, Arndt SV. Influence of major depression on 1-year outcome in patients with traumatic brain injury. Journal of Neurosurgery. 1994;81(5):726–33. doi: 10.3171/jns.1994.81.5.0726. [DOI] [PubMed] [Google Scholar]
- 46.Lequerica A, Krch D, Lengenfelder J, Chiaravalloti N, Arango-Lasprilla JC, Hammond FM, et al. Comparison of FIM™ communication ratings for English versus non-English speakers in the traumatic brain injury model systems (TBIMS) national database. Brain Injury. 2015;29(12):1445–51. doi: 10.3109/02699052.2015.1075144. [DOI] [PubMed] [Google Scholar]
- 47.Heinemann AW, Linacre JM, Wright BD, Hamilton BB, Granger C. Measurement characteristics of the Functional Independence Measure. Topics in Stroke Rehabilitation. 1994 doi: 10.1080/10749357.1994.11754030. [DOI] [PubMed] [Google Scholar]
- 48.Sirois M-J, Lavoie A, Dionne CE. Impact of transfer delays to rehabilitation in patients with severe trauma. Archives of Physical Medicine and Rehabilitation. 2004;85(2):184–91. doi: 10.1016/j.apmr.2003.06.009. [DOI] [PubMed] [Google Scholar]
- 49.Teasdale G, Jennett B. Assessment of coma and impaired consciousness: a practical scale. The Lancet. 1974;304(7872):81–4. doi: 10.1016/s0140-6736(74)91639-0. [DOI] [PubMed] [Google Scholar]