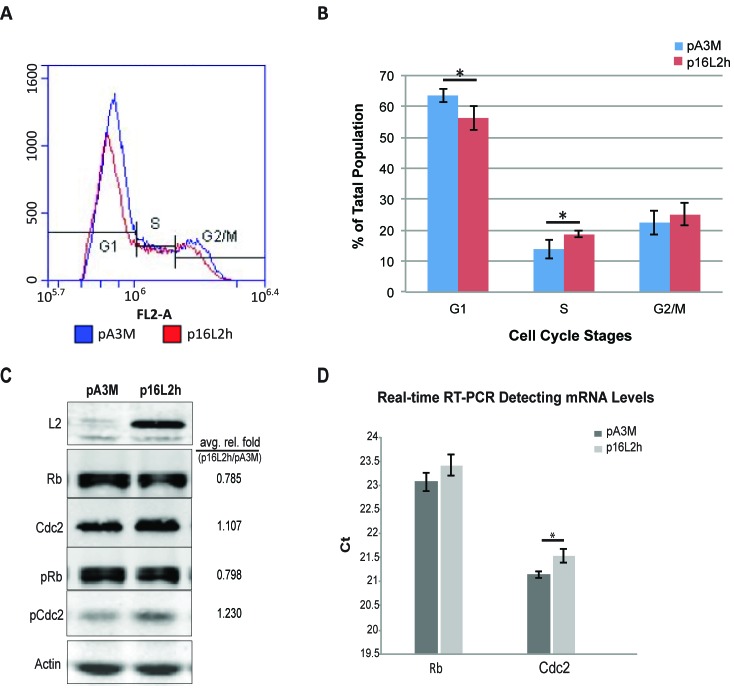
Figure 1. HPV16 L2 expression drives HaCaTs to S phase and affects Rb and Cdc2 expression and phosphorylation.
Cells were transfected with 500ng p16L2h or empty vector pA3M. 18h after transfection, cells were collected and stained with Propidium Iodide (PI). DNA contents were measured with Accuri® C6 flow cytometer. A. Representative results of DNA content detection after empty vector pA3M or p16L2h plasmid transfection. B. Average percentage of the cell population in each cell cycle phase. Data are represented as mean±STD from four independent experiments. Significances of difference were analyzed with student’s t-test. *: G1: p = 0.0189; S: p = 0.0268. C. Representative Western Blotting of 500ng plasmid transfection. Average relative fold numbers shown above. Experiments were repeated three times. pRb and pCdc2 indicate phosphorylated Rb and Cdc2, respectively. Protein levels were first normalized to internal control Actin and then calculated as the fold number of pA3M transfected ones. D. Two-step real-time RT-PCR of Rb and Cdc2 mRNA levels. Depicted are Ct (Cycle number of threshold) values. Results were compared to the empty vector pA3M transfected group. Data are represented as mean±STD from three independent experiments. Black bars: pA3M transfected cells; gray bars: p16L2h transfected cells. *: p = 0.012; student’s t-test.

