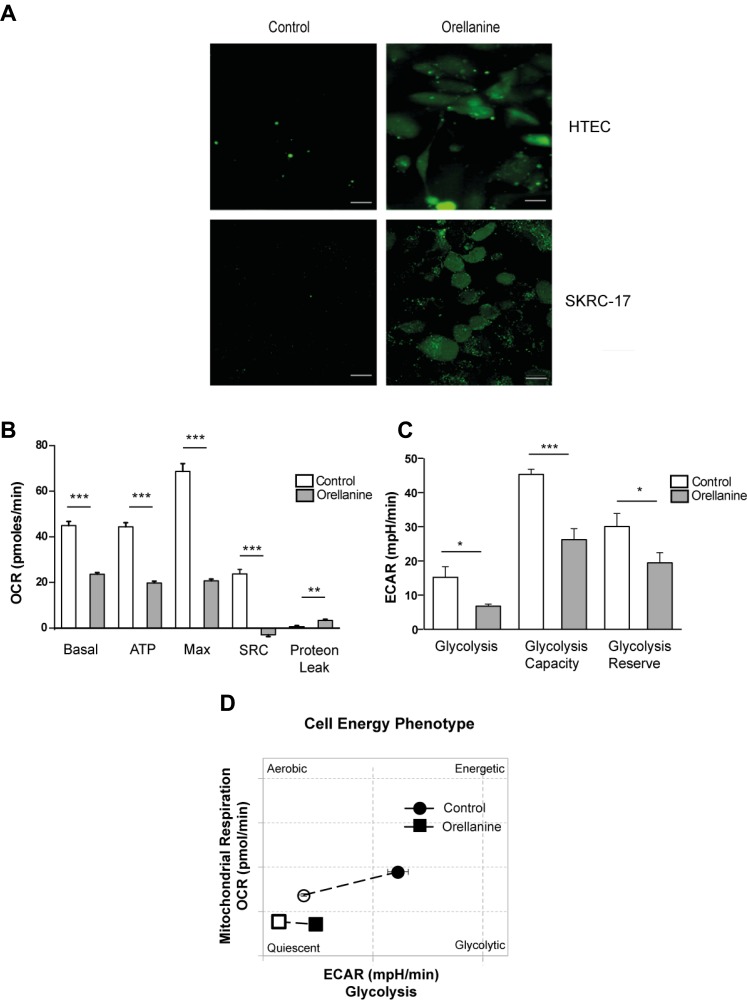
Figure 2. Orellanine induces oxidative stress and down-regulates cell metabolism.
(A) Oxidative stress in HTEC and SKRC-17 cells after 24 hours of vehicle or orellanine treatment, using carboxy-H2DCFDA for detection of ROS; scale bar 20 µm. Seahorse experiment showing: (B) Diagram of Basal Oxygen consumption rate (OCR) (basal), ATP production (ATP), maximum OCR (Max), spare respiratory capacity (SRC) and proton leak calculated from the OCR curve. (C) Glycolysis, glycolysis capacity and glycolysis reserve calculated from the Extracellular acidification rate (ECAR) curve. (D) Diagram showing the cell energy phenotype shift during mitochondrial stress conditions.

