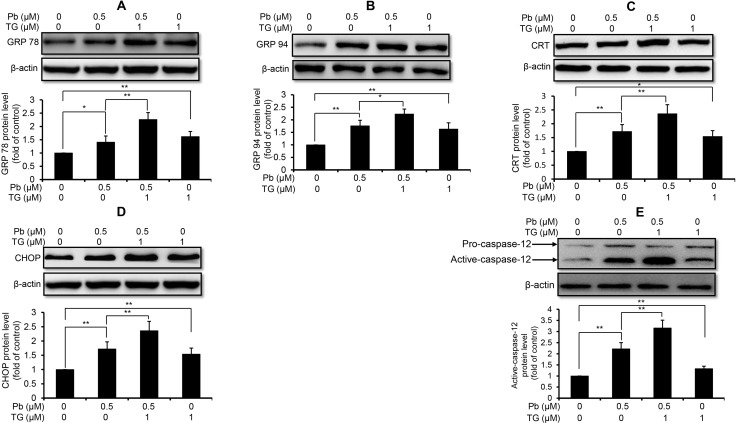
Figure 4. TG aggravated Pb-elevated protein levels of ER stress markers in rPT cells.
Cells were co-incubated with 1 µM TG and/or 0.5 µM Pb for 12 h to detect the protein levels of GRP78 (A), GRP94 (B), CRT (C), CHOP (D) and caspase-12 (E). Upper panel representative western blot image; lower panel quantitative analysis (mean ± SEM, n = 4). *P < 0.05, **P < 0.01.

