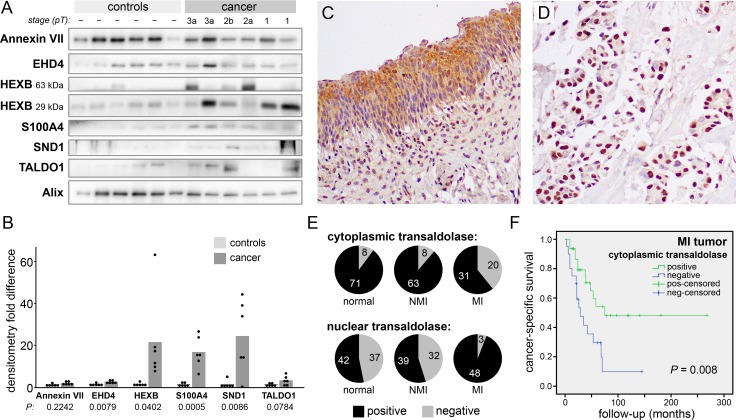
Figure 3. Transaldolase in clinical samples.
(A) Western blot analysis of urinary EVs collected from six healthy volunteers and six bladder cancer patients (stage pT1-pT3). HEXB bands are predicted at two distinct protein sizes. EV marker Alix was used as a loading control. (B) Densitometry measurements of the results in (A) normalized by the Alix signal. Bars represent the mean normalized values. HEXB is presented as the sum of the two observed bands. (C and D) Immunohistochemical staining of transaldolase in a bladder TMA (200X) showing a strong cytoplasmic signal in normal urothelium (C) and a strong nuclear signal, with no cytoplasmic staining, in an MIBC sample (D). (E) Pie graphs showing the number of samples scored positive or negative for transaldolase in cytoplasm (top) and nuclei (bottom). (F) Kaplan-Meier curves showing cancer-specific survival in patients with MIBC scoring positive or negative for cytoplasmic transaldolase.

