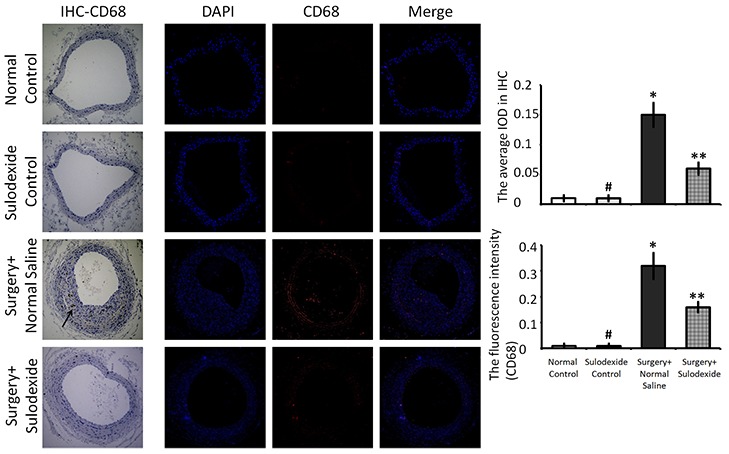
Figure 6. Sulodexide decreases CD68-positive inflammatory cell infiltration into blood vessels.

Representative IHC and IF (100 × magnification) staining for CD68. In the IHC images, the black arrow shows the infiltration of CD68-positive inflammatory cells into the blood vessel. In the IF images, the red fluorescence shows the infiltration of CD68-positive inflammatory cells into the blood vessel. The right-hand graphs show quantification of IHC and IF images. #P>0.05 sulodexide control versus normal control, *P<0.05 surgery+normal saline versus normal control, **P<0.05 surgery+sulodexide versus surgery+ normal saline.
