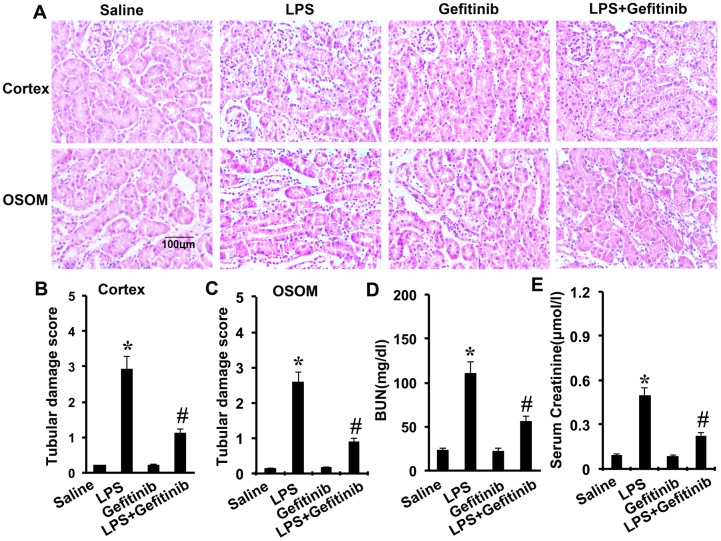
Figure 5. Effect of gefitinib on LPS-induced renal tissue damage, BUN, and serum creatinine in mice.
Male C57 mice were injected with 10 mg/kg LPS with or without 100 mg/kg gefitinib. As a control, the mice were injected with saline. Kidney tissues and blood samples were collected at 24 h after treatment. (A) Kidney sections were stained with hematoxylin and eosin to assess tubular damage. Tubular damage scores of kidney cortex (B), tubular damage scores of OSOM (C), BUN (D), and serum creatinine (E). Data are shown as mean ± S.E.M. (n=10). Data are presented as mean ± SEM; * P<0.05 versus saline group; #P<0.05 versus LPS group. Data are represe ntative of at least four separate experiments. Original magnification, x200 in A.

