

Abstract
In vivo dosimetry is important during radiotherapy to ensure the accuracy of the dose delivered to the treatment volume. A dosimeter should be characterized based on its application before it is used for in vivo dosimetry. In this study, we characterize a new MOSFET‐based detector, the MOSkin detector, on surface for in vivo skin dosimetry. The advantages of the MOSkin detector are its water equivalent depth of measurement of 0.07 mm, small physical size with submicron dosimetric volume, and the ability to provide real‐time readout. A MOSkin detector was calibrated and the reproducibility, linearity, and response over a large dose range to different threshold voltages were determined. Surface dose on solid water phantom was measured using MOSkin detector and compared with Markus ionization chamber and GAFCHROMIC EBT2 film measurements. Dependence in the response of the MOSkin detector on the surface of solid water phantom was also tested for different (i) source to surface distances (SSDs); (ii) field sizes; (iii) surface dose; (iv) radiation incident angles; and (v) wedges. The MOSkin detector showed excellent reproducibility and linearity for dose range of 50 cGy to 300 cGy. The MOSkin detector showed reliable response to different SSDs, field sizes, surface, radiation incident angles, and wedges. The MOSkin detector is suitable for in vivo skin dosimetry.
PACS number: 87.55.Qr
Keywords: MOSFET, in vivo dosimetry, surface dose, skin dose, characterization, quality assurance (QA)
I. INTRODUCTION
Quality assurance (QA) in radiotherapy is very important in order to ensure the correct functioning of all components in radiotherapy, from treatment planning to the delivery of the treatment. (1) Nowadays, advanced radiotherapy techniques, such as intensity‐modulated radiotherapy (IMRT), require patient‐specific QA to be performed to ensure the accuracy of radiation delivery during radiotherapy. However, these QA and verification procedures may not be sufficient to ensure the accuracy of the entire radiotherapy treatment.
A number of incidents have been reported recently. 2 , 3 , 4 Human errors and systematic errors contributed to these incidents. Therefore, towards that end, in vivo dosimetry can detect major errors during the delivery of radiotherapy. It also can access clinical relevant differences between planned and delivered dose, record the dose received by the patient, and fulfill legal requirements. (1)
In radiotherapy, in vivo dosimetry means the measurement of the radiation dose received by a patient during treatment. (1) Ideally, a dosimeter should be positioned at the point of interest inside a patient's body. However, in many cases it is not possible to place a dosimeter inside a real patient's body. Hence, the placement of a dosimeter on the surface of the patient's body becomes an alternative.
An ideal in vivo dosimeter should possess the following characteristics: (i) tissue equivalent; (ii) small in physical size and has small sensitive volume; (iii) features (e.g., temperature, energy) which are consistent and characterizable; (iv) does not perturb the radiation field; (v) nonhazardous to humans; and (vi) able to provide real‐time dosimetric information. Thermoluminescence dosimeter (TLD) 5 , 6 , 7 is small in size, but requires a long series of pre‐ and postirradiation process. Radiochromic film 8 , 9 , 10 has excellent dosimetric spatial resolution, is able to provide two‐dimensional (2D) dosimetric information (11) and is easy to use, but it is not done in real‐time and may be affected by improper handling and scanner performance. Semiconductor detectors such as diode 12 , 13 and metal oxide semiconductor field effect transistor (MOSFET) 14 , 15 , 16 , 17 , 18 , 19 are able to achieve excellent spatial resolution with their small sensitive volumes. However, the energy, angle, temperature, and dose‐rate dependence of semiconductor detectors require rigorous characterization.
The dose deposited on a phantom or patient surface mainly comes from primary photon beam, backscattered radiation from the phantom, as well as radiation contamination from the accelerator. Radiation contamination arises from: (i) treatment head materials and (ii) treatment setup parameters such as source‐to‐surface distance (SSD), field size, and beam modifier to the surface dose. (20) These contaminations will affect the dose in the buildup region. Therefore, it is essential to determine and know the effect of these treatment parameters.
Different terminologies, such as surface dose, skin dose, and entrance dose, have been used to describe the dose measured on the surface of a phantom or a human. The definitions for these terminologies differ according to the point of measurement on the patient or phantom. Surface dose is defined as the dose on the surface of the phantom or human, which is the interface between the air and the surface. Skin dose is defined as the dose at the depth of 0.07 mm. (21) Entrance dose is defined as the dose given by the entrance beam at the depth of maximum dose. (22)
Characterization of a dosimeter is normally performed at a condition where charged particle equilibrium (CPE) condition exists. 12 , 13 , 19 However, for in vivo skin dosimetry, the dosimeter should be characterized on the surface instead of the depth of maximum dose. This is because the dosimetric condition of skin surface and buildup region is different from the dosimetric condition at the depth of maximum dose. At the interface of two media (air and human tissue), CPE does not exist and there is a steep dose gradient in the buildup region. Therefore, characterization of a dosimeter on surface is needed prior to using it for in vivo skin dosimetry.
A MOSFET‐based dosimeter, the MOSkin detector was designed and prototyped by the Center for Medical Radiation Physics (CMRP) in the University of Wollongong (UoW). The advantages of the MOSkin detector, such as being small in size with submicron dosimetric volume which provides excellent dosimetry spatial resolution, as well as the ability to provide real‐time reading and instant readout, make it suitable for in vivo skin dosimetry measurement. The MOSkin detector has been characterized and been used for dose measurement in megavoltage radiotherapy and brachytherapy. 23 , 24 , 25 , 26 , 27 , 28 , 29 , 30
In this paper, a full characterization of the MOSkin detector on the surface of a phantom simulating the actual condition for in vivo skin dosimetry (where non‐CPE condition exist) was performed and reported. These include: (i) detector calibration, linearity, reproducibility; (ii) source to surface distance dependence; (iii) field size dependence; (iv) surface dose measurement; (v) angular dependence; and (vi) wedge response. Comparison and verifications were made with previous works with some extension, while benchmarking against different dosimeters that are available commercially and used extensively in radiotherapy centers.
II. MATERIALS AND METHODS
A. The MOSkin detector
The MOSkin system is shown in Fig. 1. The MOSkin detector is composed of hermetically sealed MOSFET dye with submicron thickness of the sensitive volume into Kapton pigtail strip with thickness of 0.55 mm using “drop‐in” packaging technology(31) (Fig. 1(a)). The thin reproducible polyamide film acts as an electrical connection and buildup for MOSkin, and gives a water‐equivalent depth (WED) of approximately 0.07 mm in tissue, making it a suitable dosimeter for skin dose measurement.(24) According to the International Commission on Radiological Protection (ICRP) publication,(21) the most radiosensitive layer of epidermis is located at tissue depth of approximately 0.07 mm. A detailed description of the MOSkin dosimetry system can be found in Kwan et al.(24) and Qi et al.(26) The readout process of MOSkin detector requires measurement of the voltage across the gate of the MOSkin detector under condition of the constant source‐drain current that is called the threshold voltage, . The increases with accumulated radiation dose. The readout current corresponds to the thermostable point of the MOSFET to avoid errors associated with thermal instability of the . The sensitivity of the MOSkin detector is defined as the shift of the with the absorption of 1 cGy of radiation dose (Eq. (1)). In this work, the MOSkin measurements were benchmarked against Markus ionization chamber (Markus type 23343 parallel plate ionization chamber; PTW, Freiburg, Germany) and/or GAFCHROMIC EBT2 film (International Specialty Products, Wayne, NJ). All measurements were carried out three times and the mean of the readings were reported unless stated otherwise.
| (1) |
where is the change of the threshold voltage in unit Volt (V).
Figure 1.

MOSkin system, MOSkin detector (top right), and the schematic diagram of MOSkin detector in (a) face‐up and (b) face‐down orientation.
B. GAFCHROMIC EBT2 film preparation
GAFCHROMIC EBT2 films were cut into sizes of . They were scanned using a flatbed scanner (Epson 10000XL scanner; Epson America, Inc. Long Beach, CA) 24 hours after irradiation to allow for postirradiation color changes. (32) The films were scanned in a reflection mode, at a resolution of 96 dots per inch (dpi), 48‐bits RGB format, and analyzed using ImageJ 1.46r software (National Institute of Health, Bethesda, MD). Care was taken to scan the films at the center of the scanner to avoid scanner‐induced nonuniformity. The films were also scanned in the same orientation to avoid film‐induced changes in pixel values.(33) Only the red channel was used for analysis. A region of interest (ROI) was selected at the center of the film. A set of standard films was irradiated to establish the calibration curve.
C. Detector characterization
C.1 Calibration, linearity, and reproducibility
The MOSkin detectors were calibrated under a Varian Clinac accelerator (Varian Medical System, Palo Alto, CA) using 6 MV photon beam under standard conditions (1.5 cm depth in solid water phantom, 100 cm source‐surface distance (SSD), and field size). Sensitivities of the MOSkin detector have been determined. Linearity measurement of the MOSkin detector was determined for a dose range of 50 cGy to 300 cGy, with an increment of 50 cGy, and the reproducibility was assessed.
In this work, the buildup cap for the Markus ionization chamber was removed in order to position the chamber's effective measurement closer to the surface. Temperature and pressure correction factor, polarity effect correction factor, and ionization recombination correction factor were taken into account for Markus ionization chamber measurements. Parallel plate ionization chambers (Markus ionization chamber) are known to overrespond due to side scatter from the chamber's wall. 34 , 35 , 36 In this work, Gerbi and Khan's correction(36) ((2), (3)) was only applied in the surface dose measurement (Material & Methods section C.4).
| (2) |
| (3) |
where, is the corrected PDD, is the measured PDD, E is the energy, l is the plate separation (2 mm for Markus PTW 23343), α is constant (5.5), C is the sidewall collector distance (0.35 mm for Markus PTW 23343), IR is the ionization ratio, and d is the depth of the chamber front window below the surface of phantom surface. The calculated are 10.14 and 6.89 for 6 MV and 10 MV photon beams, respectively.
Except for calibration and dose linearity measurement, all measurements were carried out on the surface of a solid water phantom. Characterization was carried out using a solid water phantom with a 6 MV photon beam, 100 cm SSD, and field size (Fig. 2), unless stated otherwise. This setup is henceforth called the “standard surface setup”.
Figure 2.

Schematic diagram of the standard setup of characterization of MOSkin detector on the surface of a solid water phantom.
Cheung et al. (37) has studied the temperature dependence of this MOSFET‐based detector. They reported that this detector shows a variation of 50 mV over the temperature range from 20°‐40°C. This variation is corresponding to about 10 cGy in dose. However, in order to get an accurate reading, the detector should be placed on phantom or patient approximately 60 s before measurement, to allow thermal equilibrium, and the reading are taken whilst the detector remains on the phantom or patient. The same precaution was also taken throughout this work to reduce the effect of temperature dependence of the detector.
C.2 Source‐to‐surface distance dependence
The MOSkin detector was positioned as per the “standard surface setup”. The response of the MOSkin detector for different distances from the source was measured with SSD, varying from 80 cm to 110 cm with 5 cm increments. One hundred MUs were delivered for each and repeated twice for all measured SSDs. Dose‐rate dependence of the MOSkin detector was also evaluated in this section. The dose rate at was calculated.
C.3 Field size dependence
The MOSkin detector was set up per “standard surface setup” and irradiated with different field sizes from to using 6 MV photon beam.
C.4 Surface dose measurement
The surface dose measured by MOSkin detector for 6 MV and 10 MV photon beams was evaluated. The measured dose by Markus ionization chamber was corrected, based on Gerbi and Khan's formulae. (36)
C.5 Angular dependence
Conventionally, angular dependence of the MOSFET was carried out at a depth where the CPE condition exists. Kwan et al. (24) and Qi et al. (29) have measured angular dependence of for MOSkin detector in a cylindrical phantom, where the CPE exists, and Qi et al. (26) have measured angular dependence of 3.1% on the surface of a solid water phantom. As reported in Scalchi et al., (17) full buildup setup where CPE exists gives better results than a surface setup.
Here we study the angular response of MOSkin detector placed on the surface of a phantom as the detector will be used for in vivo skin dose measurement where CPE does not exist. It is important to note that surface dose increases with beam incidence angle and correct measurements of the surface dose or skin dose for different angles of beam incidence are valuable for treatment planning system (TPS) verification. In particular, for the case of tangential beams, the angular response of the MOSkin detector will consist of the increased surface dose due to the beam incident angle and the intrinsic angular response of the MOSkin. The angular response of the MOSkin detector was assessed in face‐up and face‐down orientation, as shown in Figs. 1(a) and (b), by positioning the MOSkin detector per “standard surface setup”. One hundred MUs of 6 MV photon were delivered with the accelerator gantry rotated to the angles of 0° to 75°, with 15° increments.
C.6 Wedge response
In some clinical applications, such as conventional breast radiotherapy, beam modifier devices like physical wedge (PW) or dynamic wedge (DW) 38 , 39 may be required to tilt the dose profile, resulting in an angled isodose curve. (38) Beam quality and dose rate of the incident photons may change due to the presence of the beam modifier device. (40) For wedge response measurement, the MOSkin detector was irradiated using “standard surface setup”. One hundred MUs were delivered on the detector in an open field and subsequently with the application of PW and DW of 15°, 30°, 45°, and 60°.
III. RESULTS & DISCUSSION
A. Calibration, linearity and reproducibility
The MOSkin detector showed excellent reproducibility with deviation of less than 1% and excellent linearity for the dose range of 0 cGy to 300 cGy, as shown in Fig. 3. The reproducibility of the MOSkin detector was determined based on the average standard deviation (1 SD) of three repeated measurements of each dose level in linearity test. The dose linearity verification was carried out at this range because it was deemed to be within the range of a normal fractionated dose in radiotherapy. The average sensitivity of the MOSkin detectors in this study was for 6 MV photon beam. The sensitivity of the MOSkin detector as a function of cumulative dose was found to decrease by for every 10 Gy of delivered dose (Fig. 4). The sensitivity of the MOSkin detectors is expected to decrease as the cumulative dose increases. (41) Therefore, it is recommended that periodic recalibration be carried out throughout the detector's useful lifetime based on the accuracy needed. The readers are referred to Qi et al. (23) for details of the MOSkin detector's lifetime.
Figure 3.
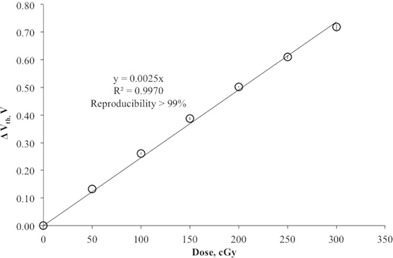
Linearity of MOSkin detector for the dose range of 0 cGy to 300 cGy.
Figure 4.

Change in sensitivity of MOSkin detector as a function of cumulative dose.
B. Source‐to‐surface distance dependence
Results of SSD dependence and dose rate dependence measurements for Markus ionization chamber, GAFCHROMIC EBT2 film, and the MOSkin detector are presented in Fig. 5. All measured doses were corrected with inverse square correction factor (ISCF) and normalized to the corrected dose at SSD 100 cm. An ideal SSD independent and dose rate independent dosimeter will have an “Inverse Square Corrected Relative Dose” equal to one.
Figure 5.

SSD and dose rate response of Markus ionization chamber, GAFCHROMIC EBT2 film and MOSkin detector corrected with ISCF and normalized to the response at 100 cm SSD. The error bar represents 1 SD of three sets of measurements.
From Fig. 5, the MOSkin detector, GAFCHROMIC EBT2 film, and Markus ionization chamber showed steady response over 80 cm to 110 cm SSD. The average variation of all SSDs for the MOSkin detector, GAFCHROMIC EBT2 film, and Markus ionization chamber was 0.1%, 1.0%, and 0.5%, respectively.
On the surface of the phantom, the dose deposited is not only due to the primary beam directed from the treatment head, but also from the contaminant electrons which are generated outside of the patient in the air and collimator. This may contribute to the SSD dependence of a skin dosimeter. This contamination is not sufficient to contribute to SSD dependence for large SSD as the electrons produced in the accelerator were of relatively high energy. (20) Measurements at shorter SSD exposed the dosimeter to large amounts of low‐energy photons scattered by the components in the accelerator and would induce a slight over‐response of a dosimeter.
C. Field size dependence
Qi et al. (26) have also studied the field size dependence of the MOSkin detector on phantom surface for the field size of to . In this study, the field sizes investigated were extended to include small field sizes of as small as and larger field size of . The field size dependence of surface dose measured by MOSkin detector, as well as EBT2 film and Markus ionization chamber, is shown in Fig. 6. All readings were normalized to field size. The three detectors showed an upward trend as field size increases. This is expected and is due to the increase in the backscattered radiation from the phantom and radiation contamination. The radiation contamination was mainly due to the scattered radiation from the flattening filter, with a small portion of scattered radiation as a function of field size. (42) The result of MOSkin detector and Attix ionization chamber from Qi et al. (26) are also presented in Fig. 6 for comparison. Surface dose increases measured with the MOSkin detectors rose from 0.36 to 2.32 times of the surface dose measurement at for the field sizes from to .
Figure 6.

Field size response of the surface dose measured by MOSkin detector, GAFCHROMIC EBT2 film, and Markus ionization chamber normalized to response at radiation field size. The average standard deviation of three sets of measurements for MOSkin detector, GAFCHROMIC EBT2 film, and Markus ionization chamber is 0.034, 0.052, and 0.001, respectively.
The dose deposited on the surface of the phantom is expected to be only 10%–20% of the maximum dose (). (38) As field size increases, the surface dose increases and, hence, there is a corresponding reduction in the surface dose gradient. (17)
All detectors measured increasing surface dose with increasing field size. For field size , the MOSkin measurements are in good agreement with EBT2 film. MOSkin detector is advantageous for small field surface dosimetry compared to Markus ionization chamber due to the small sensitive volume of the detector. For field size , MOSkin detector and Markus ionization chamber measurements showed an enhanced response, compared to the GAFCHROMIC EBT2 film. This may be due to the side scattering effect of Markus ionization chamber and energy dependence of the semiconductor (MOSkin) detector.
Good agreement between the MOSkin detector's response and Attix ionization chamber (29) (average difference of 2%) has been observed due to close WED of the detectors used. Earlier reported results of field dependence measured with MOSkin detectors are in agreement (average difference of 3%) with presented results, confirming good reproducibility of WED of the MOSkin detectors. (26)
D. Surface dose measurement
The average sensitivity of the MOSkin detectors was found to be and for 6 MV and 10 MV photon beams, respectively. The MOSkin detectors were 1.01% more sensitive in 6 MV photon beam compared to 10 MV photon beam.
Table 1 shows the measured surface dose of the MOSkin detector, GAFCHROMIC EBT2 film, and the Markus ionization chamber measurement for 6 MV and 10 MV photon beams. The surface doses for 6 MV photon measured by these detectors are higher than 10 MV photon due to the skin sparing effect of 10 MV photon.
Table 1.
Comparison of the surface dose (normalized to 100% the dose at ) with Markus ionization chamber, GAFCHROMIC EBT2 film, and MOSkin detector for 6 MV and 10 MV photons
| Energy (MV) | Markus (%) | EBT2 (%) | MOSkin (%) | |||
|---|---|---|---|---|---|---|
| 6 |
|
|
|
|||
| 10 |
|
|
|
Markus ionization chamber measured lowest surface doses for 6 MV and 10 MV photons, followed by the MOSkin detector and GAFCHROMIC EBT2 film. This can be explained by the WED of these detectors. Markus ionization chamber was assumed to have WED of 0 mm after the application of Gerbi and Khan's correction. (36) MO Skin detector has a WED of 0.070 mm (24) and GAFCHROMIC EBT2 film has a WED of 0.122 mm. The WED of GAFCHROMIC EBT2 film was determined based on the physical depth and density 43 , 44 from the surface to the center of the active layer.
In measuring the surface dose at the depth of 0 cm, the dose difference (%) between the MOSkin detector and Markus ionization chamber was found to be 4.44% and 1.74% for 6 MV and 10 MV photon beams, respectively (Table 1). It is expected because the dose gradient in build‐up region for 6 MV photon beam is steeper than that of 10 MV photon beam.
E. Angular dependence
Figure 7 shows the results of the measured doses which have been normalized to the dose at 0° beam incident angle. The result of MOSkin detector and Attix ionization chamber from Qi et al. (26) are also presented in Fig. 7 for comparison. As the beam incident angle increases, the measured surface dose increases because the region of charged particle equilibrium shifts toward the surface. This is in agreement with the results by Scalchi et al. (17) and Qi et al. (26)
Figure 7.

Relative surface dose measured with GAFCHROMIC EBT2 film and MOSkin detector as the function of beam incident angle and normalized to 1 at 0° beam incident angle with field size. The error bar represents 1 SD of three sets of measurements. The average standard deviation of three sets of measurements for MOSkin detector and GAFCHROMIC EBT2 film is 0.033 and 0.036, respectively.
GAFCHROMIC EBT2 film, with its dosimetric properties of tissue equivalence and homogeneous material, is assumed to be of angular independence. Suchowerska et al. (45) reported that GAFCHROMIC film shows intrinsic angular dependence of less than 1% when a measurement with the film surface is parallel and perpendicular to the beam direction. MOSkin detector in the face‐up orientation showed similar angular response trend to the GAFCHROMIC EBT2 film (Fig. 7). GAFCHROMIC EBT2 film measured higher dose as compared to MOSkin detector in face‐up orientation. This may be due to the difference of the WED these detectors (Results & Discussion section D).
When the MOSkin detector was used in the face‐down orientation for surface dose measurement, it showed a trend of overresponse when compared with MOSkin detector and GAFCHROMIC EBT2 film. Deviation between MOSkin detector in face‐up orientation and face‐down orientation is seen to be increasing as the beam incident angle increases. Maximum deviation of 18.5% was found at beam incident angle of 75°. The observed angular dependence between MOSkin detector in the face‐up orientation and face‐down orientation arises from the effect of the difference in the WED of the detector related to the asymmetric geometry of the detector (inherent anisotropy). For face‐down geometry, the WED is approximately 0.9 mm due to a 0.4 mm silicon substrate. Therefore, it is very important to identify the orientation of MOSkin detector when it is used for surface dose measurement. For WED 0.07 mm, MOSkin detector should be used in a face‐up mode. Present result was in good agreement with earlier reported result (26) with maximum deviation of 2.2 % at angle 30°.
F. Wedge response
The results of the wedge effect are summarized in Fig. 8. The doses were normalized to the dose measured with open field. The surface dose decreases as the wedge angle increases for both PW and DW. The average variation of MOSkin measurement with Markus ionization measurement for PW and DW was and 5.1%, respectively. MOSkin measurement is in close agreement with GAFCHROMIC EBT2 film measurement. GAFCHROMIC EBT2 film responded higher for PW (2.8%) and DW (1.7%), respectively. This is in agreement with other scenarios of surface dose measurements due to higher WED of GAFCHROMIC EBT2 film in comparison with the MOSkin detector.
Figure 8.
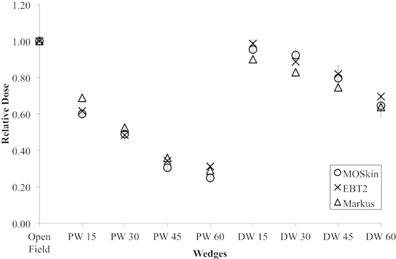
Wedges response measurement of Markus ionization chamber, GAFCHROMIC EBT2 film, and MOSkin detector and normalized to 1 at open field. The error bar represents 1 SD of three sets of measurements. The average standard deviation of three sets of measurements for MOSkin detector, GAFCHROMIC EBT2 film, and Markus ionization chamber is 0.033, 0.019, and 0.001, respectively.
The presence of any materials between the radiation source and the phantom or patient will alter the dose to the build‐up region. In this work, constant MU (100 MUs) was given. The presence of physical wedge under the photon beam will harden the photon beam by absorbing scattered radiation. (38) The presence of the wedge will also produce low energy scattered radiation. (46)
IV. CONCLUSIONS
The surface dose measured with MOSkin detector was investigated on a phantom surface for different SSD, field sizes, surface dose, oblique beams, machine dose rates, and in the presence of the wedge in comparison with EBT2 film and Markus ionization chamber.
MOSkin detector showed deviation of less than 2% over a change of 80 – 110 cm SSD. For field size dependence, they are in agreement with Attix ionization chamber. (29) Surface dose measured with the MOSkin detectors increases from 0.36 to 2.32 times of the surface dose measurement at for the field sizes from to . The dose difference between the MOSkin detector and Markus ionization chamber was 4.44% and 1.74% for 6 MV and 10 MV photon beams, respectively. This is due to the different WEDs for both detectors. The dose gradient in the buildup region of 6 MV photon beam is steeper than that of the 10 MV photon beam. When oblique beams are used, surface dose measured with the MOSkin detector increases up to 1.95 times of the normal beam incidence. For angular dependence, MOSkin detector in face‐up orientation is in agreement with Attix ionization chamber. (26)
Maximum deviation of 18.5% was found with face‐down orientation. The orientation (face‐up or face‐down) of the MOSkin detector must be taken into account when used for skin dose measurement. The MOSkin measurement is in close agreement with GAFCHROMIC EBT2 film for the measurement made under the presence of wedges.
MOSkin detector is suitable detector for in vivo skin dosimetry as compared to GAFCHROMIC EBT2 film because of its WED of 0.07 mm. However, due to the difference between the detector's WED and materials, neither can be used as true benchmarked for determining MOSkin detector accuracy as skin dosimeter. Monte Carlo calculation may provide a true benchmark tool for this comparison. However, this is not within the scope of this study.
ACKNOWLEDGMENTS
We would like to acknowledge HIR Grant UM C/625/1/HIR/MOHE/CHAN/06 (H50001‐00‐A000020‐000001) and UMRG Grant RG507‐13HTM for supporting this research. We would also like to thank all the radiographers in the Clinical Oncology Unit of the University Malaya Medical Centre for their assistances in this study.
Supporting information
Supplementary Material
Supplementary Material
References
- 1. Mijnheer B, Beddar S, Izewska J, Reft C. In vivo dosimetry in external beam radiotherapy. Med Phys. 2013;40(7):1–19. [DOI] [PubMed] [Google Scholar]
- 2. Mayles WP. The Glasgow incident — a physicist's reflections. Clin Oncol. 2007;19(1):4–7. [DOI] [PubMed] [Google Scholar]
- 3. Williams MV. Radiotherapy near misses, incidents and errors: radiotherapy incident at Glasgow. Clin Oncol. 2007;19(1):1–3. [DOI] [PubMed] [Google Scholar]
- 4. Ortiz Lopez P, Cosset JM, Dunscombe P et al. ICRP publication 112. A report of preventing accidental exposures from new external beam radiation therapy technologies. Ann ICRP. 2009;39(4):1–86. [DOI] [PubMed] [Google Scholar]
- 5. Costa AM, Barbi GL, Bertucci EC et al. In vivo dosimetry with thermoluminescent dosimeters in external photon beam radiotherapy. Appl Radiat Isot. 2010;68(4‐5):760–62. [DOI] [PubMed] [Google Scholar]
- 6. Rivera T. Thermoluminescence in medical dosimetry. Appl Radiat Isot. 2012;71(Suppl):30–34. [DOI] [PubMed] [Google Scholar]
- 7. Kron T. Applications of thermoluminescence dosimetry in medicine. Radiat Prot Dosim. 1999;85(1‐4):333–40. [Google Scholar]
- 8. Butson MJ, Yu PK, Cheung T, Metcalfe P. Radiochromic film for medical radiation dosimetry. Mater Sci Eng Reports. 2003;41(3‐5):61–120. [Google Scholar]
- 9. Devic S. Radiochromic film dosimetry: past, present, and future. Phys Med. 2011;27(3):122–34. [DOI] [PubMed] [Google Scholar]
- 10. Niroomand‐Rad A, Blackwell CR, Coursey BM et al. Radiochromic film dosimetry: recommendations of AAPM Radiation Therapy Committee Task Group 55. American Association of Physicists in Medicine. Med Phys. 1998;25(11):2093–115. [DOI] [PubMed] [Google Scholar]
- 11. Sim GS, Wong JHD, Ng KH. The use of radiochromic EBT2 film for the quality assurance and dosimetric verification of 3D conformal radiotherapy using Microtek ScanMaker 9800XL flatbed scanner. J Appl Clin Med Phys. 2013;14(4):85–95. [DOI] [PMC free article] [PubMed] [Google Scholar]
- 12. Meiler RJ, Podgorsak MB. Characterization of the response of commercial diode detectors used for in vivo dosimetry. Med Dosim. 1997;22(1):31–37. [DOI] [PubMed] [Google Scholar]
- 13. Yorke E, Alecu R, Ding L et al. Diode in vivo dosimetry for patients receiving external beam radiation therapy. Report of Task Group 62 of the Radiation Therapy Committee. Madison, WI: AAPM; 2005. [Google Scholar]
- 14. Bharanidharan G, Manigandan D, Devan K et al. Characterization of responses and comparison of calibration factor for commercial MOSFET detectors. Med Dosim. 2006;30(4):213–18. [DOI] [PubMed] [Google Scholar]
- 15. Gopiraj A, Billimagga RS, Ramasubramanian V. Performance characteristics and commissioning of MOSFET as an in‐vivo dosimeter for high energy photon external beam radiation therapy. Rep Pract Oncol Radiother. 2008;13(3):114–25. [Google Scholar]
- 16. Ramani R, Russell S, O'Brien P. Clinical dosimetry using MOSFETs. Int J Radiat Oncol Biol Phys. 1997;37(4):959–64. [DOI] [PubMed] [Google Scholar]
- 17. Scalchi P, Francescon P, Rajaguru P. Characterization of a new MOSFET detector configuration for in vivo skin dosimetry. Med Phys. 2005;32(6):1571–78. [DOI] [PubMed] [Google Scholar]
- 18. Halvorsen PH. Dosimetric evaluation of a new design MOSFET in vivo dosimeter. Med Phys. 2005;32(1):110–17. [DOI] [PubMed] [Google Scholar]
- 19. Scalchi P, Francescon P. Calibration of a MOSFET detection system for 6‐MV in vivo dosimetry. Int J Radiat Oncol Biol Phys. 1998;40(4):987–93. [DOI] [PubMed] [Google Scholar]
- 20. Yadav G, Yadav RS, Kumar A. Skin dose estimation for various beam modifiers and source‐to‐surface distances for 6MV photons. J Med Phys. 2009;34(2):87–92. [DOI] [PMC free article] [PubMed] [Google Scholar]
- 21. ICRP. The biological basis for dose limitation in the skin. A report of a Task Group of Committee 1 of the International Commission on Radiological Protection. Ann ICRP. 1992;22(2). [PubMed] [Google Scholar]
- 22. VanDam J and Marinello G. Methods for in vivo dosimetry in external radiotherapy. Physics for clinical radiotherapy. ESTRO Booklet n.1. Brussels: Garant Publ.; 1994. [Google Scholar]
- 23. Qi ZY, Deng XW, Huang SM et al. Verification of the plan dosimetry for high dose rate brachytherapy using metal–oxide–semiconductor field effect transistor detectors. Med Phys. 2007;34(6):2007–13. [DOI] [PubMed] [Google Scholar]
- 24. Kwan IS, Rosenfeld AB, Qi ZY et al. Skin dosimetry with new MOSFET detectors. Radiat Meas. 2008;43(2‐6):929–32. [Google Scholar]
- 25. Hardcastle N, Soisson E, Metcalfe P, Rosenfeld AB, Tomé WA. Dosimetric verification of helical tomotherapy for total scalp irradiation. Med Phys. 2008;35(11):5061–68. [DOI] [PubMed] [Google Scholar]
- 26. Qi ZY, Deng XW, Huang SM et al. In vivo verification of superficial dose for head and neck treatments using intensity‐modulated techniques. Med Phys. 2009;36(1):59–70. [DOI] [PubMed] [Google Scholar]
- 27. Kwan IS, Wilkinson D, Cutajar D et al. The effect of rectal heterogeneity on wall dose in high dose rate brachytherapy. Med Phys. 2009;36(1):224–32. [DOI] [PubMed] [Google Scholar]
- 28. Hardcastle N, Cutajar DL, Metcalfe PE et al. In vivo real‐time rectal wall dosimetry for prostate radiotherapy. Phys Med Biol. 2010;55(13):3859–71. [DOI] [PMC free article] [PubMed] [Google Scholar]
- 29. Qi ZY, Deng XW, Huang SM et al. Real‐time in vivo dosimetry with MOSFET detectors in serial tomotherapy for head and neck cancer patients. Int J Radiat Oncol Biol Phys. 2011;80(5):1581–88. [DOI] [PubMed] [Google Scholar]
- 30. Alnawaf H, Butson M, Yu PK. Measurement and effects of MOSKIN detectors on skin dose during high energy radiotherapy treatment. Australas Phys Eng Sci Med. 2012;35(3):321–28. [DOI] [PubMed] [Google Scholar]
- 31. Wong JH, Fuduli I, Carolan M et al. Characterization of a novel two dimensional diode array the “magic plate” as a radiation detector for radiation therapy treatment. Med Phys. 2012;39(5):2544–58. [DOI] [PubMed] [Google Scholar]
- 32. Cheung T, Butson MJ, Yu PK. Post‐irradiation colouration of Gafchromic EBT radiochromic film. Phys Med Biol. 2005;50(20):N281–N285. [DOI] [PubMed] [Google Scholar]
- 33. Butson MJ, Cheung T, Yu PK. Scanning orientation effects on Gafchromic EBT film dosimetry. Australas Phys Eng Sci Med. 2006;29(3):281–84. [DOI] [PubMed] [Google Scholar]
- 34. Rawlinson JA, Arlen D, Newcombe D. Design of parallel plate ion chambers for buildup measurements in megavoltage photon beams. Med Phys. 1992;19(3):641–48. [DOI] [PubMed] [Google Scholar]
- 35. Bilge H, Cakir A, Okutan M, Acar H. Surface dose measurements with Gafchromic EBT film for 6 MV and 18 MV photon beams. Phys Med. 2009;25(2):101–04. [DOI] [PubMed] [Google Scholar]
- 36. Gerbi BJ and Khan FM. Measurement of dose in the buildup region using fixed‐separation plane‐parallel ionization chambers. Med Phys. 1990;17(1):17–26. [DOI] [PubMed] [Google Scholar]
- 37. Cheung T, Butson MJ, Yu PK. Effects of temperature variation on MOSFET dosimetry. Phys Med Biol. 2004;49(13):N191–N196. [DOI] [PubMed] [Google Scholar]
- 38. Metcalfe PE, Kron T, Hoban P. The physics of radiotherapy x‐rays and electrons. Madison, WI: Medical Physics Publishing; 2007. [Google Scholar]
- 39. Shih R, Li XA, Chu JCH. Dynamic wedge versus physical wedge: a Monte Carlo study. Med Phys. 2001;28(4):612–19. [DOI] [PubMed] [Google Scholar]
- 40. Lopez Medina A, Teijeiro A, Garcia J et al. Characterization of electron contamination in megavoltage photon beams. Med Phys. 2005;32(5):1281–92. [DOI] [PubMed] [Google Scholar]
- 41. Zilio VO, Joneja OP, Popowski Y, Rosenfeld A, Chawla R. Absolute depth‐dose‐rate measurements for an 192Ir HDR brachytherapy source in water using MOSFET detectors. Med Phys. 2006;33(6):1532–39. [DOI] [PubMed] [Google Scholar]
- 42. Yu MK and Slooboda R. Analytical representation of head scatter factors for shaped photon beams using two‐component x‐ray source model. Med Phys. 1995;22(12):2045–55. [DOI] [PubMed] [Google Scholar]
- 43. ISP. Gafchromic EBT2 Self‐developing film for radiotherapy dosimetry. Wayne, NJ: International Specialty Products; 2009. [Google Scholar]
- 44. Aland T, Kairn T, Kenny J. Evaluation of a Gafchromic EBT2 film dosimetry system for radiotherapy quality assurance. Australas Phys Eng Sci Med. 2011;34(2):251–60. [DOI] [PubMed] [Google Scholar]
- 45. Suchowerska N, Hoban P, Butson M, Davison A, Metcalfe P. Directional dependence in film dosimetry: radiographic and radiochromic film. Phys Med Biol. 2001;46(5):1391–97. [DOI] [PubMed] [Google Scholar]
- 46. Ochran TG, Boyer AL, Nyerick CE, Otte VA. Dosimetric characteristics of wedges mounted beyond the blocking tray. Med Phys. 1992;19(1):187–94. [DOI] [PubMed] [Google Scholar]
Associated Data
This section collects any data citations, data availability statements, or supplementary materials included in this article.
Supplementary Materials
Supplementary Material
Supplementary Material