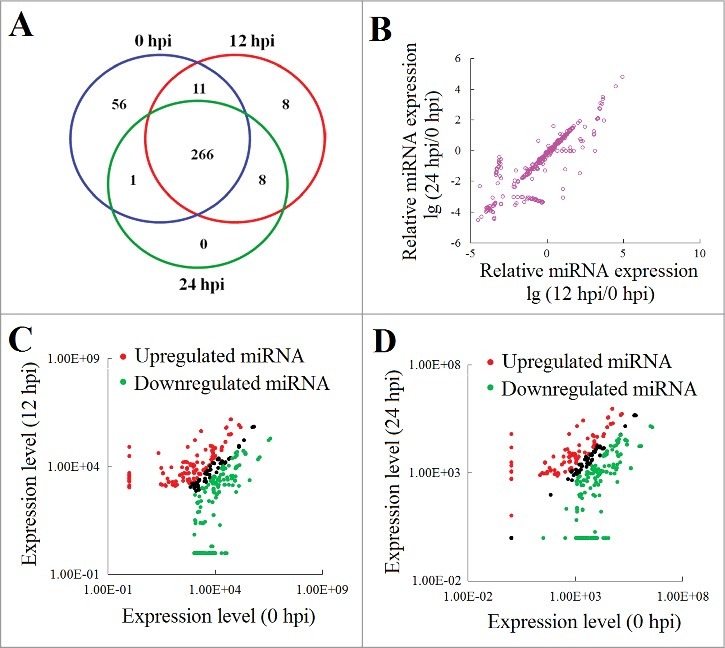
Figure 1.

miRNA expression during Edwardsiella tarda infection. (A) Venn diagram showing miRNAs expression at different hours post infection (hpi). The numbers inside the diagram stand for the numbers of miRNAs. (B) Differential expression of miRNAs after bacterial infection. (C and D) Scatter plot of the miRNA expression levels at 12 hpi (C) and 24 hpi (D) in comparison with that at 0 hpi. Red and green spots represent miRNAs significantly upregulated and downregulated, respectively.
