Abstract
Objective:
To explore whether serum neurofilament light chain protein (NfL) levels are increased in patients with MRI-confirmed recent small subcortical infarcts (RSSI) compared to healthy controls and to determine the subsequent course and determinants of NfL levels in a longitudinal manner.
Methods:
In a prospectively collected group of symptomatic patients with an RSSI (n = 79, mean age 61 ± 11 years, 67% male), we analyzed brain MRI and serum NfL using a Single Molecule Array (Simoa) assay at baseline and at 3 and 15 months after stroke. Community-dwelling healthy age- and sex-matched individuals with comparable severity of MRI white matter hyperintensities (WMH) (n = 53) served as controls.
Results:
Patients with an RSSI had higher NfL baseline levels compared to controls (73.45 vs 34.59 pg/mL, p < 0.0001), and they were increasingly higher with the time from stroke symptom onset to blood sampling (median 4 days, range 1–11 days, rs = 0.51, p < 0.0001). NfL levels remained increased at the 3-month follow-up but returned to normal at 15 months after stroke. NfL levels were associated with RSSI size and baseline WMH severity and were especially high in patients with new, clinically silent cerebral small vessel disease (CSVD)–related lesions at follow-up.
Conclusions:
Serum NfL is increased in patients with an RSSI and the occurrence of new CSVD-related MRI lesions, even when clinically silent. This suggests NfL as a blood biomarker for active CSVD.
Lacunar stroke accounts for a quarter of all ischemic strokes and is supposed to result from the occlusion of a small perforating brain artery.1 On MRI, lacunar stroke is characterized by a recent small subcortical infarct (RSSI), which is typically accompanied by other chronic morphologic features of cerebral small vessel disease (CSVD) such as lacunes, white matter hyperintensities (WMH), or microbleeds.2 These lesions are often clinically ineloquent, but their accumulation heralds important long-term sequelae such as cognitive impairment.3 At present, only MRI can serve to assess the dynamics and progression of CSVD, and thus, biomarkers for this purpose are badly needed.4
Neurofilament is an essential scaffolding protein of the neuronal cytoskeleton, which consists of 3 subunits that differ in size. On axonal damage, neurofilament is released into the extracellular space and subsequently into the CSF and blood and may thus represent an interesting marker for neuronal damage.5 Most research has focused on neurofilament light (NfL) and neurofilament heavy chains, and levels of CSF NfL were found to be more sensitive for discriminating patients with multiple sclerosis from controls than neurofilament heavy chains.6 For technical reasons, reliable assessment of NfL has so far been limited to measurements in the CSF and thus has been applicable just for investigating patients who undergo lumbar puncture. A cross-sectional study was able to show that CSF NfL levels parallel increasing WMH severity and suggested a possible role of NfL also in CSVD.7 Most recently, ultrasensitive assays with the Single Molecule Array (Simoa) method have been developed that now allow quantification of NfL in blood samples with very high sensitivity.8
To study the utility of NfL measurements in serum for CSVD, we here first concentrated on patients with an RSSI because this represents the most destructive phenotype of this disorder. We hypothesized that serum NfL levels would be increased in patients with an RSSI compared to age- and sex-matched healthy controls. We also aimed to determine factors that have an effect on NfL levels and their changes over time, including the occurrence of new lesions.
METHODS
Participants.
Starting in May 2012, we invited all consecutive patients admitted to our primary and tertiary care university hospital because of an acute stroke syndrome to participate in the prospective lacunar stroke study if they were ≤75 years of age and diffusion-weighted MRI depicted an RSSI, suggestive for the supply area of a small perforating brain artery and corresponding to the clinical findings. While 20 mm is usually considered the maximal axial diameter for RSSI, we decided to expand the upper size limit to 25 mm for this study because some RSSI show larger diameters in the very acute phase. An axial diameter >25 mm, other acute brain infarcts, preexisting disability (modified Rankin Scale score >1), and contraindications for repeated MRI were defined as exclusion criteria.
Besides a thorough cerebrovascular workup (duplex sonography of brain-supplying arteries, echocardiography, and 24-hour Holter ECG), patients underwent blood sampling and brain MRI at baseline and at 3 and 15 months after the index event.
As controls, we used a cohort of community-dwelling healthy age- and sex-matched participants from the Austrian Stroke Prevention Family Study (ASPS-Fam). In short, the ASPS-Fam is a prospective single-center, community-based study of the cerebral effects of vascular risk factors in a normal aging population of the city of Graz, Austria. It represents an extension of the ASPS, which was established in 1991.9 Between 2006 and 2013, study participants of the ASPS and their first-degree relatives were invited to enter ASPS-Fam. Inclusion criteria were no history of stroke or dementia and a normal neurologic examination.
Clinical assessment.
For all patients, medical history, NIH Stroke Scale (NIHSS) score, and vascular risk factors and diseases were assessed at baseline. At both follow-ups (3 and 15 months after the index stroke), occurrence of new symptoms, recurrent vascular events, and NIHSS and modified Rankin Scale scores were determined.
Controls also received a thorough clinical assessment that included medical history, laboratory evaluation, cognitive testing, and an extended vascular risk factor assessment.10
Brain MRI.
At baseline, all study patients underwent brain MRI at 1.5T (Siemens MAGNETOM Espree, Siemens Healthcare, Erlangen, Germany) according to a standard protocol for the workup of patients with suspected cerebrovascular events. This included an axial T2-weighted fast spin echo sequence, an axial fluid-attenuated inversion recovery sequence, a sagittal T1-weighted spin echo sequence, a gradient echo T2*-weighted sequence, an axial diffusion-weighted single-shot echo planar imaging sequence with apparent diffusion coefficient maps, and a 3D time-of-flight angiography. All axial scans had a slice thickness of 5 mm.
At both follow-ups, brain MRI was performed on a 3T TimTrio or Prisma scanner (Siemens Healthcare). The protocol included high-resolution structural 3-dimensional images by means of a T1-weighted magnetization-prepared rapid gradient echo sequence with 1-mm isotropic resolution, a fluid-attenuated inversion recovery sequence, diffusion-weighted imaging, apparent diffusion coefficient scans, and 3D time-of-flight images. Controls underwent brain MRI with the same 3T scanners as patients with the same MRI protocols.
All MRI scans were reviewed by a neuroradiologic expert (C.E.). Besides the assessment of RSSI location and size, all scans were rated for WMH severity,11 lacunes, old cortical or cerebellar infarcts, microbleeds, old parenchymal hemorrhages, vessels pathologies, or other concomitant intracranial lesions12 by the neuroradiologic expert blinded to the clinical findings. At follow-up, MRI scans were specifically searched for the occurrence of new infarcts.
Serum neurofilament assessment.
Peripheral blood (8 mL) was taken by venipuncture within 11 days after the index RSSI (median time from stroke symptom onset to blood sampling 4 days, range 1–11 days) and at 3 and 15 months after stroke. In controls, blood sampling was done in a standardized manner on the same day as MRI with a maximum time interval of 5 hours.
Serum was then immediately stored at −80°C according to international consensus guidelines.13
We measured serum NfL by a Simoa assay using the capture monoclonal antibody 47:3 and the biotinylated detector monoclonal antibody 2:1 from UmanDiagnostics (Umeå, Sweden)14 transferred onto the Simoa platform. Bovine lyophilized NfL was obtained from UmanDiagnostics. Calibrators ranged from 0 to 2,000 pg/mL. Intra-assay variability and inter-assay variability of the assay were <20%. The analytical sensitivity was 0.32 pg/mL. All samples produced signals above the analytic sensitivity of the assay. Few samples with intra-assay coefficients of variance >20% were repeat measured.
Statistical analysis.
Demographic, clinical, and morphologic scores and NfL levels were analyzed with IBM SPSS Statistics 23 (Armonk, NY). The level of significance was set at 0.05. The Kolmogorov-Smirnov test assessed normality of data distribution. Groups were compared by the χ2 test (for nominal data), Mann-Whitney U test (for nonnormally distributed variables), or unpaired t test (for normally distributed continuous variables). Correlation analysis was performed with the Spearman or Pearson correlation. Longitudinal within-group comparisons of NfL levels were done with the Friedman test. Post hoc analyses were done with the Wilcoxon test (Bonferroni-adjusted level of significance p = 0.0167).
Standard protocol approvals, registrations, and patient consents.
This prospective observational study was approved by the ethics committee of the Medical University of Graz. All participants gave written informed consent.
RESULTS
From May 2012 to August 2016, 95 consecutive patients with an RSSI agreed to participate in the prospective lacunar stroke study. Of those, blood serum to assess NfL levels was unavailable in 16 patients, leading to a final study cohort of 79 patients (mean age 61 years, 67% male). RSSI were located in the supratentorial white matter (n = 38), thalamus (n = 17), basal ganglia (n = 15), and brainstem (n = 9). Four patients had concomitant atrial fibrillation, and 1 patient had a proximal high-grade vessel stenosis, but these findings did not appear to be causally related to the RSSI.
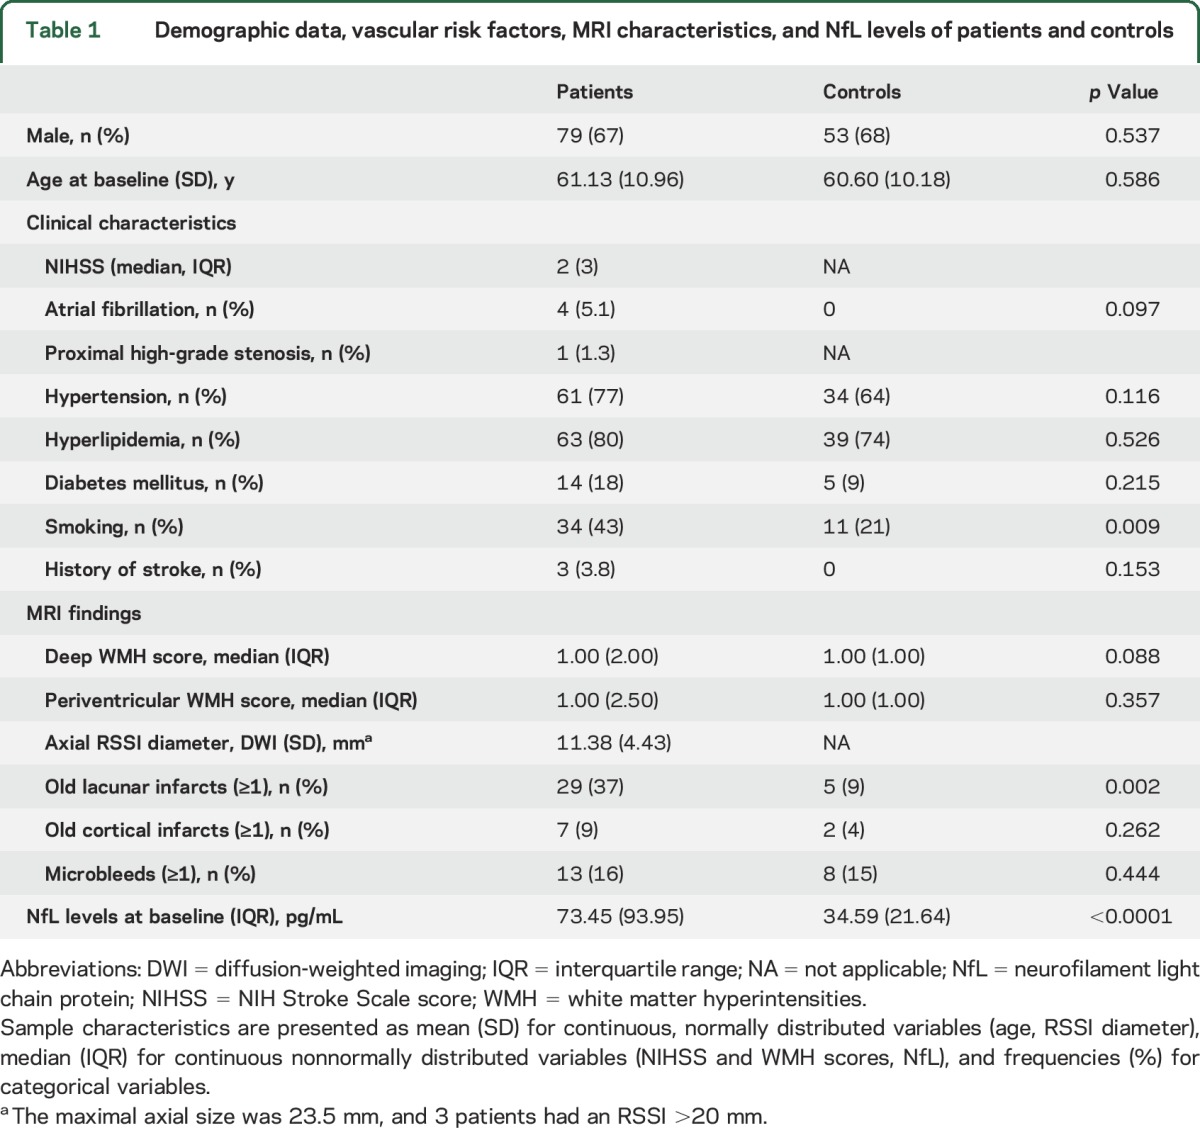
Further baseline characteristics of patients and controls are provided in table 1.
Table 1.
Demographic data, vascular risk factors, MRI characteristics, and NfL levels of patients and controls
Differences in NfL levels between patients and controls.
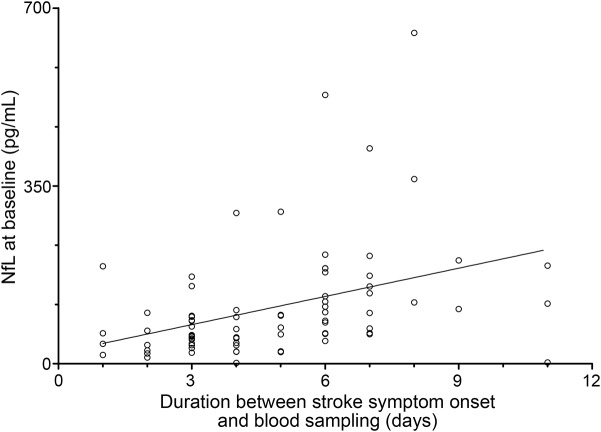
Patients with an RSSI had higher baseline NfL levels compared to controls (median 73.45 [interquartile range (IQR) 93.95] vs 34.59 [IQR 21.64] pg/mL, p < 0.0001, table 1). The individual NfL levels were increasingly higher with the time from stroke symptom onset to baseline blood sampling within 11 days (median 4 days, range 1–11 days, rs = 0.51, p < 0.0001, figure 1). This effect was also observed after adjustment for NIHSS score (rs = 0.39, p = 0.001) and RSSI diameter (rs = 0.39, p < 0.0001).
Figure 1. Correlation between baseline serum NfL levels and duration between stroke symptom onset and blood sampling (rs = 0.51, p < 0.0001).
NfL = neurofilament light chain protein.
Higher baseline NfL levels were also seen with a larger RSSI diameter (rs = 0.26, p = 0.019) and higher scores of deep WMH (rs = 0.35, p = 0.002) but were not associated with a higher burden of periventricular WMH (rs = 0.20, p = 0.069). Five of the 7 patients with NfL levels >200 pg/mL had a high burden of CSVD as indicated by confluent WMH and multiple old lacunes on MRI.
Longitudinal changes of NfL levels.
MRI data and serum for NfL measurements were available in 66 patients at the 3-month follow-up and in 49 patients for all 3 time points.
Follow-up 1 at 3 months.
At 3 months, NfL levels of the 66 patients with an RSSI were still increased over control levels (median 94.81 [IQR, 96.51] pg/mL, p < 0.0001) and comparable to the levels of 66 patients with RSSI at baseline (71.52 [IQR, 98.12] pg/mL, p = 0.084).
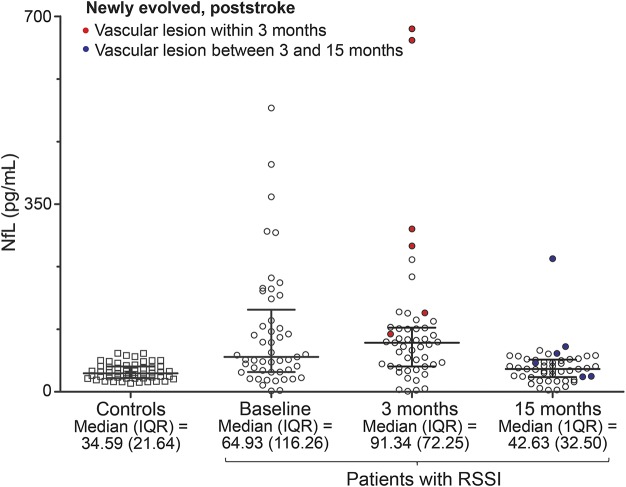
The results at 3 months were similar when considering only the 49 patients with available MRI and NfL assessments at all 3 time points (figure 2).
Figure 2. Longitudinal dynamics of serum NfL levels for 49 patients with RSSI with available data for all 3 time points.
IQR = interquartile range; NfL = neurofilament light chain protein; RSSI = recent small subcortical infarct.
At the 3-month follow-up, brain MRI showed newly evolved ischemic lesions (all of them putatively CSVD related) in 7 of the 66 patients with an RSSI, which were clinically silent in 6 of them. Four of these patients had a new lacune; 1 patient had a new hyperintense pontine lesion; and 1 patient showed a new RSSI and a lacune. One 44-year-old woman with severe diabetes mellitus had clinically evident stroke symptoms due to a recurrent RSSI 1 month after the index RSSI. At 3 months, MRI of this patient additionally showed 2 clinically silent lacunes and a very high NfL level of 942.42 pg/mL. Serum NfL levels in patients with newly evolved lesions at 3 months were increased compared to the remaining patients both at baseline (p = 0.011) and after 3 months (p < 0.0001, table 2). The increase of NfL levels of patients with an RSSI over controls remained even after the exclusion of the 7 patients with newly evolved MRI lesions (88.05 [IQR, 73.44] vs 34.59 [IQR, 21.64] pg/mL, p < 0.0001).
Table 2.
NfL levels of patients with vs without a new MRI-visible vascular lesion at the 3- and 15-month follow-ups
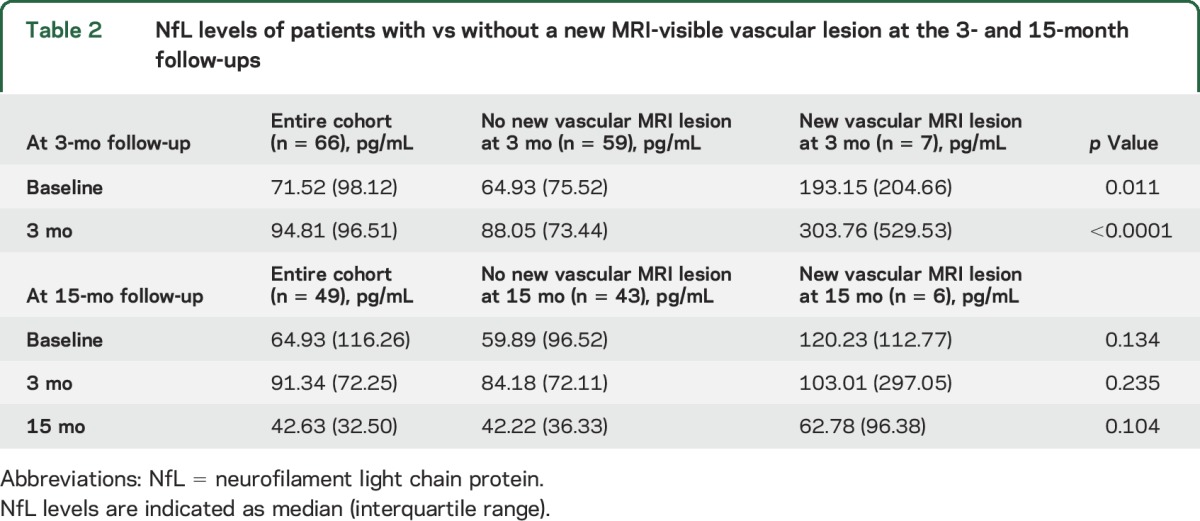
Figure 2 indicates longitudinal dynamics of NfL levels in 49 patients with available data for all 3 time points compared to controls, highlighting patients with newly evolved MRI lesions.
Follow-up 2 at 15 months.
At 15 months, NfL levels returned to normal, i.e., were comparable to the levels of controls (p = 0.116, table 2 and figure 2). New ischemic lesions on MRI occurred also between the 3- and 15-month follow-ups and were seen in 6 of 49 patients. All of these lesions were again presumably CSVD related. Two patients showed new WMH; 2 other patients had new lacunes; 1 patient developed a new lacune and WMH; and 1 patient had new unspecific postischemic focal hyperintensities in the putamen and cerebellum. All of these lesions had occurred without clinical symptoms. No differences between NfL levels of these patients and the remaining patients without a recurrent lesion during follow-ups 1 and 2 were observed (table 2). However, 3 individuals had new MRI-visible vascular lesions at both follow-up scans and showed consistently high NfL levels. Figure 3 exemplarily illustrates MRI scans of a patient who developed clinically asymptomatic CSVD-related lesions at both follow-up examinations.
Figure 3. Serial MRI scans of a patient with CSVD-related lesions at both follow-up scans.
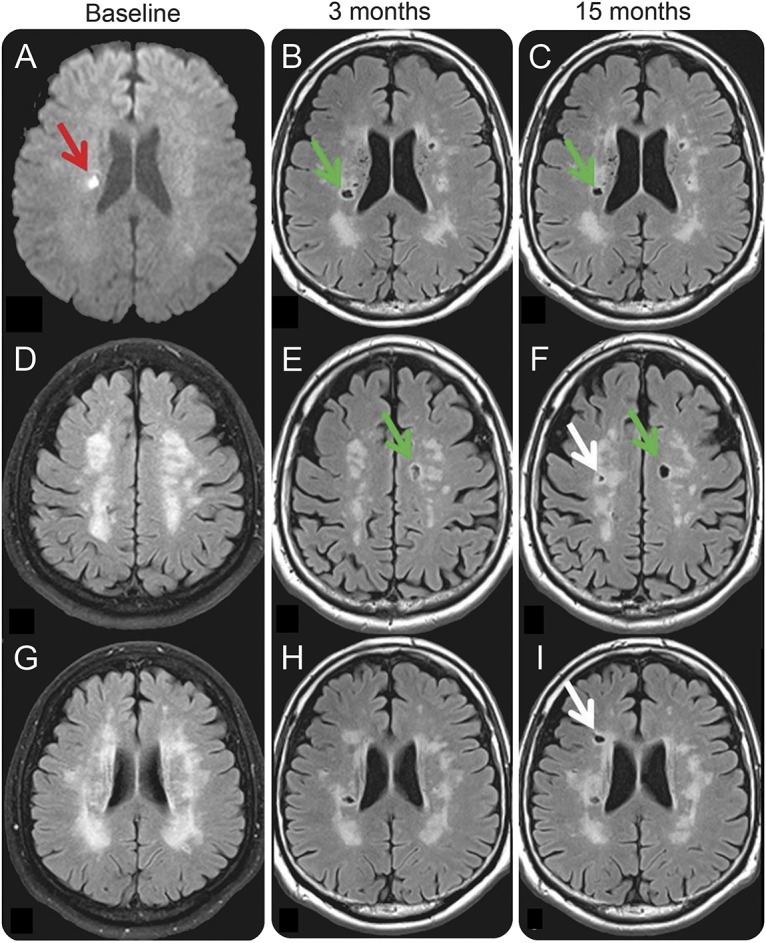
(A) Index RSSI at baseline (red arrow), which evolved into a lacune at the 3-month follow-up MRI (B, H, green arrow) and remained unchanged at 15 months (C, I, green arrow). On the 3-month follow-up MRI, the patient had a newly evolved lacunar infarct in the left centrum semiovale (green arrow, E), which was not present at baseline (D). Two more lacunar lesions in the right centrum semiovale (F, white arrow) and right periventricular region (I, white arrow) occurred between the first and second follow-ups at 15 months. Note that panel A shows a diffusion-weighted MRI sequence, while all other panels (B–I) are fluid-attenuated inversion recovery scans. Newly evolved lesions at the 3-month follow-up are indicated by green arrows. Lesions that occurred between 3 and 15 months are indicated by white arrows. NfL levels in this patient were 212.34 (baseline), 676.59 (3-month follow-up), and 84.17 (15-month follow-up) pg/mL. CSVD = cerebral small vessel disease; RSSI = recent small subcortical infarct.
DISCUSSION
Our work revealed that serum NfL was increased in patients with an RSSI compared to age- and sex-matched healthy controls with similar WMH severity on MRI. In longitudinal analysis, we were able to show that serum NfL remained increased during the 3 months after an RSSI. Higher NfL levels were associated with the occurrence of new, clinically silent, ischemic CSVD-related lesions on follow-up MRI scans at 3 months. There was a similar trend also at the 15-month follow-up, but differences were no longer statistically significant.
In a substantial number of patients, CSVD has a progressive disease course with the occurrence of new cerebrovascular lesions.9 CSVD-related radiologic markers have been shown to be more sensitive, indicating ongoing disease activity, compared to clinical deterioration, especially over shorter time periods.15 Benjamin and colleagues16 reported that all investigated CSVD MRI markers in their study (lacunes, WMH and brain volume, reduced mean diffusivity on diffusion tensor imaging) progressed over a follow-up period of 3 years. All of these changes were clinically silent, and patients remained stable in terms of cognitive function. MRI has several limitations such as high costs, restricted availability, and some burden of the investigation (e.g., for claustrophobic patients). Therefore, it cannot be routinely used in the clinical follow-up of patients with CSVD for assessing possible dynamics of their disease. Consequently, the availability of a biomarker sensitive to active CSVD would be highly desirable. Thus far, investigations into markers of endothelial dysfunction, coagulation, or inflammation have not been able to substantiate a role in indicating disease progression.4 Measuring NfL levels is a more direct approach because neurofilament is released into the extracellular space and subsequently into the CSF and blood after axonal damage. The new possibility of analyzing NfL in blood samples facilitates studying this marker also in neurologic disorders that do not usually necessitate lumbar puncture. In addition to multiple sclerosis,6 elevated NfL serum levels have already been reported in several neurodegenerative diseases17,18 and in traumatic brain injury.19 A previous study using an electrochemiluminescence-based assay reported increased serum NfL levels with higher clinical stroke severity and more morphological damage on MRI (stroke vs TIA vs local symptoms only) in younger patients with cervical artery dissection.20
Our results indicate that NfL is a sensitive marker of tissue damage even in small subcortical infarcts. The association of NfL levels with the axial RSSI diameter suggests that serum NfL levels increase with the size of infarction. Serum NfL was also related to more severe deep WMH, while no effect was found for periventricular WMH severity. This difference might be explained by the different histologic and pathophysiologic mechanisms that presumably underlie the 2 types of WMH.21
Because of the design of our study, we also had the possibility to investigate the temporal dynamics of NfL in patients with an RSSI. NfL levels increased with the time interval between symptom onset and blood sampling. A similar temporal association in the early disease phase has been reported in traumatic spinal cord injury22 and the previously mentioned study on cervical artery dissection.20 Prolonged release of NfL into the blood after neuronal injury and ongoing axonal damage due to postischemic immunologic or inflammatory processes could be causal factors for this finding.20,23 It was surprising, however, that NfL levels remained elevated over control values even 3 months after stroke. This suggests ongoing axonal damage in patients with RSSI over a prolonged period.
Because of the invasiveness of lumbar puncture, only scarce information was available on the temporal dynamics of NfL. In multiple sclerosis, it could be shown that increased CSF NfL levels were markedly reduced after induction of effective immunomodulatory therapy.24,25 The availability of robust serum assays for NfL detection now facilitates longitudinal measurements, and elevated NfL levels over time have already been reported in neurodegenerative disorders such as Huntington disease,26 primary progressive aphasia,27 and Alzheimer disease,28 but also in mild traumatic brain injury 3 months after the event.29 Serum NfL levels and their change over time correlated with the clinical course in these diseases.
At the second follow-up 15 months after the RSSI, NfL decreased toward the level of controls. Unfortunately, we cannot define from our data at which time point NfL levels peaked or started to decrease because this will necessitate blood sampling in narrower time intervals.
As expected from previous studies,16 several of our patients showed new CSVD-related ischemic lesions on MRI at both follow-up examinations, which were clinically silent in most of them. The NfL levels of these patients were increased compared with the remaining patients with an RSSI, both at baseline and at the 3-month follow-up. If confirmed in another independent cohort, these findings suggest that serum NfL might potentially serve as a biomarker to identify patients with a high probability of CSVD progression and to monitor disease activity and response to therapy (e.g., vascular risk factor control). Although the pathologic range still has to be defined, an elevation of serum NfL thus might also suggest a follow-up MRI scan in patients with an RSSI. Of note, there was no association between newly evolved vascular lesions and NfL levels at 15 months. This difference might be explained by the longer time period of 1 year between follow-ups 1 and 2; we do not know when the clinically silent lesions occurred, and tissue destruction together with NfL levels might have already stabilized.
A main limitation of this study is the fact that it was not primarily designed to study the role of NfL as a biomarker. This explains our focus on patients with an RSSI and the different sampling intervals. Otherwise, the availability of longitudinal information on NfL levels and the comprehensive and standardized MRI follow-up scans represent major strengths of our work and led to the observation of prolonged increases of NfL and especially high NfL levels in patients with ongoing CSVD activity. We cannot fully rule out the contribution of other disease processes because NfL is a nonspecific biomarker for neuroaxonal damage, and increases have been reported in patients with mild cognitive impairment and Alzheimer dementia.28 To minimize the influence of concomitant neurodegenerative brain changes, we used an upper age limit of 75 years, and our patients' mean age of 61 years argues against a frequent coexistence of neurodegenerative processes. Furthermore, such “contamination” also would not explain observed NfL dynamics with a return close to control values after 15 months. Further research is also needed to define the thresholds of CSVD accumulation necessary to be picked up by serum NfL measurements. Moreover, the number of patients with new CSVD-related lesions in our sample was relatively small. Nevertheless, the association between such lesions and elevated NfL levels in individual patients was impressive.
GLOSSARY
- ASPS-Fam
Austrian Stroke Prevention Family Study
- CSVD
cerebral small vessel disease
- IQR
interquartile range
- NfL
neurofilament light
- NIHSS
NIH Stroke Scale
- RSSI
recent small subcortical infarct
- Simoa
Single Molecule Array
- WMH
white matter hyperintensities
AUTHOR CONTRIBUTIONS
Conception and design of the study: T.G., F.F., M.K. Acquisition and analysis of data: T.G., D.P., C.E., T.S.-H., M.K., S.F., A.P., C.B., S.G., M.V., L.P., E.H., S.R., R.S., J.K., M.K. Drafting a significant portion of the manuscript or figures: T.G., D.P., M.V., L.P., J.K., F.F., M.K. D.P. performed the statistical analysis.
STUDY FUNDING
Daniela Pinter receives funding from the Austrian Science Fund: T690-B23.
DISCLOSURE
The authors report no disclosures relevant to the manuscript. Go to Neurology.org for full disclosures.
REFERENCES
- 1.Kolominsky-Rabas PL, Weber M, Gefeller O, et al. Epidemiology of ischemic stroke subtypes according to TOAST criteria: incidence, recurrence, and long-term survival in ischemic stroke subtypes: a population-based study. Stroke 2001;32:2735–2740. [DOI] [PubMed] [Google Scholar]
- 2.Wardlaw JM, Smith EE, Biessels GJ, et al. Neuroimaging standards for research into small vessel disease and its contribution to ageing and neurodegeneration. Lancet Neurol 2013;12:822–838. [DOI] [PMC free article] [PubMed] [Google Scholar]
- 3.Debette S, Markus HS. The clinical importance of white matter hyperintensities on brain magnetic resonance imaging: systematic review and meta-analysis. BMJ 2010;341:c3666. [DOI] [PMC free article] [PubMed] [Google Scholar]
- 4.Vilar-Bergua A, Riba-Llena I, Nafría C, et al. Blood and CSF biomarkers in brain subcortical ischemic vascular disease: involved pathways and clinical applicability. J Cereb Blood Flow Metab 2016;36:55–71. [DOI] [PMC free article] [PubMed] [Google Scholar]
- 5.Teunissen CE, Khalil M. Neurofilaments as biomarkers in multiple sclerosis. Mult Scler 2012;18:552–556. [DOI] [PubMed] [Google Scholar]
- 6.Kuhle J, Plattner K, Bestwick JP, et al. A comparative study of CSF neurofilament light and heavy chain protein in MS. Mult Scler 2013;19:1597–1603. [DOI] [PubMed] [Google Scholar]
- 7.Jonsson M, Zetterberg H, Van Straaten E, et al. Cerebrospinal fluid biomarkers of white matter lesions: cross-sectional results from the LADIS study. Eur J Neurol 2010;17:377–382. [DOI] [PubMed] [Google Scholar]
- 8.Kuhle J, Barro C, Andreasson U, et al. Comparison of three analytical platforms for quantification of the neurofilament light chain in blood samples: ELISA, electrochemiluminescence immunoassay and Simoa. Clin Chem Lab Med 2016;54:1655–1661. [DOI] [PubMed] [Google Scholar]
- 9.Schmidt R, Ropele S, Enzinger C, et al. White matter lesion progression, brain atrophy, and cognitive decline: the Austrian Stroke Prevention Study. Ann Neurol 2005;58:610–616. [DOI] [PubMed] [Google Scholar]
- 10.Pirpamer L, Hofer E, Gesierich B, et al. Determinants of iron accumulation in the normal aging brain. Neurobiol Aging 2016;43:149–155. [DOI] [PubMed] [Google Scholar]
- 11.Fazekas F, Chawluk JB, Alavi A. MR signal abnormalities at 1.5 T in Alzheimer's dementia and normal aging. AJR Am J Roentgenol 1987;149:351–356. [DOI] [PubMed] [Google Scholar]
- 12.Fazekas F, Enzinger C, Schmidt R, et al. MRI in acute cerebral ischemia of the young: the Stroke in Young Fabry Patients (sifap1). Study Neurol 2013;81:1914–1921. [DOI] [PubMed] [Google Scholar]
- 13.Teunissen CE, Petzold A, Bennett JL, et al. A consensus protocol for the standardization of cerebrospinal fluid collection and biobanking. Neurology 2009;73:1914–1922. [DOI] [PMC free article] [PubMed] [Google Scholar]
- 14.Norgren N, Karlsson JE, Rosengren L, Stigbrand T. Monoclonal antibodies selective for low molecular weight neurofilaments. Hybrid Hybridomics 2002;21:53–59. [DOI] [PubMed] [Google Scholar]
- 15.Conklin J, Silver FL, Mikulis DJ, Mandell DM. Are acute infarcts the cause of leukoaraiosis? Brain mapping for 16 consecutive weeks. Ann Neurol 2014;76:899–904. [DOI] [PubMed] [Google Scholar]
- 16.Benjamin P, Zeestraten EA, Lambert C, et al. Progression of MRI markers in cerebral small vessel disease: sample size considerations for clinical trials. J Cereb Blood Flow Metab 2016;36:228–240. [DOI] [PMC free article] [PubMed] [Google Scholar]
- 17.Weydt P, Oeckl P, Huss A, et al. Neurofilament levels as biomarkers in asymptomatic and symptomatic familial amyotrophic lateral sclerosis. Ann Neurol 2016;79:152–158. [DOI] [PubMed] [Google Scholar]
- 18.Gaiottino J, Norgren N, Dobson R, et al. Increased neurofilament light chain blood levels in neurodegenerative neurological diseases. PLoS One 2013;8:e75091. [DOI] [PMC free article] [PubMed] [Google Scholar]
- 19.Shahim P, Gren M, Liman V, et al. Serum neurofilament light protein predicts clinical outcome in traumatic brain injury. Sci Rep 2016;6:36791. [DOI] [PMC free article] [PubMed] [Google Scholar]
- 20.Traenka C, Disanto G, Seiffge DJ, et al. Serum neurofilament light chain levels are associated with clinical characteristics and outcome in patients with cervical artery dissection. Cerebrovasc Dis 2015;40:222–227. [DOI] [PubMed] [Google Scholar]
- 21.Kim KW, MacFall JR, Payne ME. Classification of white matter lesions on magnetic resonance imaging in elderly persons. Biol Psychiatry 2008;64:273–280. [DOI] [PMC free article] [PubMed] [Google Scholar]
- 22.Kuhle J, Gaiottino J, Leppert D, et al. Serum neurofilament light chain is a biomarker of human spinal cord injury severity and outcome. J Neurol Neurosurg Psychiatry 2015;86:273–279. [DOI] [PubMed] [Google Scholar]
- 23.Yan J, Greer JM, Etherington K, et al. Immune activation in the peripheral blood of patients with acute ischemic stroke. J Neuroimmunol 2009;206:112–117. [DOI] [PubMed] [Google Scholar]
- 24.Gunnarsson M, Malmeström C, Axelsson M, et al. Axonal damage in relapsing multiple sclerosis is markedly reduced by natalizumab. Ann Neurol 2011;69:83–89. [DOI] [PubMed] [Google Scholar]
- 25.Kuhle J, Disanto G, Lorscheider J, et al. Fingolimod and CSF neurofilament light chain levels in relapsing-remitting multiple sclerosis. Neurology 2015;84:1639–1643. [DOI] [PMC free article] [PubMed] [Google Scholar]
- 26.Byrne LM, Rodrigues FB, Blennow K, et al. Neurofilament light protein in blood as a potential biomarker of neurodegeneration in Huntington's disease: a retrospective cohort analysis. Lancet Neurol 2017;16:601–609. [DOI] [PMC free article] [PubMed] [Google Scholar]
- 27.Steinacker P, Semler E, Anderl-Straub S, et al. Neurofilament as a blood marker for diagnosis and monitoring of primary progressive aphasias. Neurology 2017;88:961–969. [DOI] [PubMed] [Google Scholar]
- 28.Mattsson N, Andreasson U, Zetterberg H, Blennow K. Association of plasma neurofilament light with neurodegeneration in patients with Alzheimer disease. JAMA Neurol 2017;74:557–566. [DOI] [PMC free article] [PubMed] [Google Scholar]
- 29.Shahim P, Zetterberg H, Tegner Y, Blennow K. Serum neurofilament light as a biomarker for mild traumatic brain injury in contact sports. Neurology 2017;88:1788–1794. [DOI] [PMC free article] [PubMed] [Google Scholar]


