

Abstract
Metabolic pathways mediate lineage specification within the immune system through the regulation of glucose utilization, a process that generates energy in the form of ATP and synthesis of amino acids, nucleotides, and lipids to enable cell growth, proliferation, and survival. CD4+ T cells, a proinflammatory cell subset, preferentially produce ATP through glycolysis, whereas cells with an antiinflammatory lineage, such as memory and regulatory T cells, favor mitochondrial ATP generation. In conditions of metabolic stress or a shortage of nutrients, cells rely on autophagy to secure amino acids and other substrates, while survival depends on the sparing of mitochondria and maintenance of a reducing environment. The pentose phosphate pathway acts as a key gatekeeper of inflammation by supplying ribose‐5‐phosphate for cell proliferation and NADPH for antioxidant defenses. Increased lysosomal catabolism, accumulation of branched amino acids, glutamine, kynurenine, and histidine, and depletion of glutathione and cysteine activate the mechanistic target of rapamycin (mTOR), an arbiter of lineage development within the innate and adaptive immune systems. Mapping the impact of susceptibility genes to metabolic pathways allows for better understanding and therapeutic targeting of disease‐specific expansion of proinflammatory cells. Therapeutic approaches aimed at glutathione depletion and mTOR pathway activation appear to be safe and effective for treating lupus, while an opposing intervention may be of benefit in rheumatoid arthritis. Environmental sources of origin for metabolites within immune cells may include microbiota and plants. Thus, a better understanding of the pathways of immunometabolism could provide new insights into the pathogenesis and treatment of the rheumatic diseases.
Introduction
Metabolic pathways exert profound influence over the development of unicellular and multicellular organisms. Engagement of antigen receptors and costimulatory molecules, growth factors, hormones, cytokines, environmental factors, and other regulatory cues shape the development of the immune system by mechanisms of action that lead to reprogramming of metabolic gene expression in a cell type–specific manner. In fact, the heterogeneity of cells within both the innate and the adaptive immune systems depends on the supply of metabolites that allow for lineage‐specific differentiation. This review integrates recent discoveries in metabolomics and genetics with immunologic pathways of pathogenesis to delineate checkpoints for the diagnosis of autoimmune rheumatic diseases and elucidate additional targets for the treatment of these diseases.
Role of metabolic pathways as regulators of the immune response and inflammation
Cells face a tantalizing choice between speed and efficiency when selecting metabolic pathways to meet their needs for proliferation, differentiation, and survival. Lineage specification within the immune system depends on metabolic pathways that regulate glucose utilization for generation of energy in the form of ATP and for synthesis of amino acids, nucleotides, and lipids to enable cell growth, proliferation, and survival. While rapidly proliferating proinflammatory CD4+ T cells preferentially produce ATP through glycolysis, cells with an antiinflammatory lineage, such as memory and regulatory T cells, favor the generation of mitochondrial ATP 1. During conditions of metabolic stress and a shortage of nutrients, cells rely on autophagy of proteins and organelles to secure amino acids and other substrates, while survival of the cells depends on the sparing of mitochondria and maintenance of a reducing environment. The pentose phosphate pathway (PPP) is a key gatekeeper of inflammation, acting via the supply of ribose‐5‐phosphate (R5P) for cell proliferation and NADPH for antioxidant defenses 2.
The PPP enzyme transaldolase (TAL) exerts control over the production of NADPH, which maintains glutathione (GSH) in a reduced state in human T cells 3, 4. As originally documented, TAL regulates the elevation of mitochondrial transmembrane potential (ΔΨm), a process that has also been termed mitochondrial hyperpolarization (MHP) and identified as a checkpoint of T cell activation and apoptosis 5. Although MHP occurs transiently during T cell activation, it persists in patients with systemic lupus erythematosus (SLE), causes the depletion of GSH and ATP, and leads to a predisposition to proinflammatory cell death via necrosis 6.
During periods of metabolic stress and nutrient deprivation, increased catabolism in lysosomes, accumulation of branched amino acids, glutamine, kynurenine, and histidine, and depletion of GSH and cysteine activate the mechanistic target of rapamycin (mTOR), a kinase that has recently been recognized as an arbiter of lineage development within both the innate and the adaptive immune systems (Figure 1). Targeting the immunometabolism for therapeutic interventions requires a detailed map of the interconnected pathways supporting disease‐specific expansion of proinflammatory cells (Figure 1). Recent approaches targeting the depletion of GSH and activation of mTOR appear to be safe and effective in the treatment of lupus 7, while an opposing intervention may benefit patients with rheumatoid arthritis (RA) 8. Importantly, metabolites within immune cells ultimately derive from the environment; thus, comprehensive profiling may pinpoint microbiota and plants as sources of origin. Therefore, cultivating a better understanding of the pathways of immunometabolism could provide new insights into the pathogenesis and treatment of autoimmune rheumatic diseases.
Figure 1.
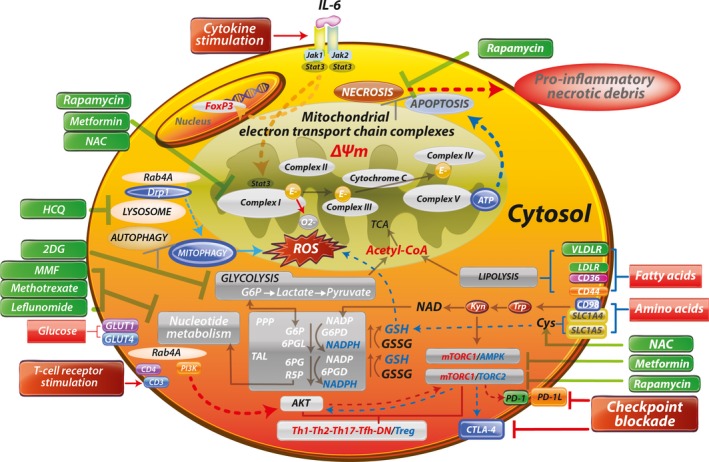
Schematic diagram of metabolic pathways controlling activation and lineage specification in the immune system. Depicted surface receptors and intracellular transducers exemplify those that operate in T cells, regulate or are regulated by metabolic pathways, and exhibit genetic linkage with systemic lupus erythematosus (SLE) and other autoimmune diseases. Characteristics of mitochondrial dysfunction include blocked electron transport chain (ETC) activity, elevated mitochondrial transmembrane potential (ΔΨm) or mitochondrial hyperpolarization, and diminished mitophagy, which contribute to accumulation of oxidative stress–generating mitochondria and depletion of ATP and glutathione (GSH). Reactive oxygen species (ROS) are generated by electron (E) transfer to O2 at complex I. These metabolic changes underlie the activation of mechanistic target of rapamycin complex 1 (mTORC1), which promotes glycolysis in CD4+ T cells, further enhancing the accumulation of mitochondria in necrosis‐prone, proinflammatory double‐negative (DN) T cells and depleting Treg cells. Thus, key metabolic features of T cell dysfunction in SLE are balancing of energy production between the mitochondrial ETC and glycolysis, and securing of amino acids during starvation through autophagy of proteins and organelles while mitochondria are selectively retained. The direction of signaling is indicated by arrows (red = increase, blue = decrease). Drugs that affect metabolism are shown in green. IL‐6 = interleukin‐6; NAC = N‐acetyl‐cysteine; Drp1 = dynamin‐related protein 1; HCQ = hydroxychloroquine; TCA = tricarboxylic acid; 2DG = 2‐deoxyglucose; Acetyl‐CoA = acetyl‐coenzyme A; VLDLR = very low‐density lipoprotein receptor; MMF = mycophenolate mofetil; LDLR = low‐density lipoprotein receptor; G6P = glucose‐6‐phosphate; PPP = pentose phosphate pathway; G6PD = glucose‐6‐phosphate dehydrogenase; 6PGL = 6‐phosphogluconolactonase; GSSG = oxidized glutathione; TAL = transaldolase; 6PG = 6‐phosphogluconate; 6PGD = 6‐phosphogluconate dehydrogenase; AMPK = AMP‐dependent protein kinase; PI3K = phosphatidylinositol 3‐kinase; R5P = ribose‐5‐phosphate; PD‐1 = programmed death 1; Tfh = follicular helper T cells.
Integration of genetic and environmental factors with immunometabolic pathways in analyses of autoimmune disease pathogenesis
Both genetic and environmental factors contribute to the pathogenesis of autoimmune diseases 9. However, with the exception of complement gene deletions, most of the lupus susceptibility loci identified in genome‐wide association studies (GWAS) confer only minor changes in disease risk 10. Integrated analyses in which genetic factors are included point to the relevance of a limited number of metabolic pathways in autoimmune rheumatic diseases (Table 1; specific source citations listed in Supplementary Table 1, available on the Arthritis & Rheumatology web site at http://onlinelibrary.wiley.com/doi/10.1002/art.40223/abstract). These pathways include the following: 1) glycolysis; 2) the mitochondrial tricarboxylic acid (TCA) cycle, electron transport chain (ETC), and oxidative phosphorylation, which provide energy in the form of ATP; 3) the pentose phosphate pathway (PPP), which is an essential source of R5P for the production of nucleic acids in support of cell proliferation, and NADPH for lipid biosynthesis and maintenance of a reducing environment and protection against oxidative stress 2; 4) lipid metabolism and adipogenesis; 5) uptake and biosynthesis of amino acids; and 6) selection of cell death pathways between the physiologic process of apoptosis and pathologic process of proinflammatory cell necrosis and clearance of cell death debris (Figure 1).
Table 1.
Metabolic pathways affected by systemic lupus erythematosus susceptibility genesa
| Metabolic pathway, gene | Primary function | Metabolic pathway, gene | Primary function |
|---|---|---|---|
| Glucose metabolism | |||
| TCF7 | Transcription | ||
| TLR7 | RNA binding | Adipogenesis | |
| SOCS1 | Signal transduction | ARID5Bb | Transcription |
| IRF5b | Transcription | CXorf21 | Unknown |
| IRF7 | Transcription | STAT4b | Transcription |
| IRF8b | Transcription | IL12A | Cytokine |
| LYN | Tyrosine kinase | CD80 | Signal transduction |
| SLC15A4 | Histidine transporter | Apoptosis | |
| PRKCB | Protein kinase | TNFSF4 | Signal transduction |
| BLKb | Tyrosine kinase | ELF1 | Transcription |
| ITGAM | Cell adhesion | Autophagy/mTOR | |
| IFIH1 | RNA helicase | TNIP1c | Signal transduction |
| TYK2b | Tyrosine kinase | IRAK1b | Signal transduction |
| IL10 | Cytokine | miR146a | RNA processing |
| IKZF2 | Transcription | ATG5b | E3 ubiquitin ligase |
| PRPS2 | PRPP synthesis | UHRF1BP1 | DNA methylation |
| Lipid metabolism | WDFY4b | E3 ubiquitin ligase | |
| BANK1 | Scaffold protein | ATG16L2 | Unknown |
| AFF1 | Transcription | PLD2 | Phospholipid hydrolysis |
| RASGRP3 | GTPase signaling | PRDM1 | Transcription |
| JAZF1b | Transcription | PTPN22b | Tyrosine phosphatase |
| XKR6 | Unknown | RAD51Bb | DNA repair |
| DHCR7 | Cholesterol reductase | TET3 | DNA methylation |
| SH2B3b | Signal transduction | DRAM1 | Lysosomal function |
| Mitochondrial metabolism | TNFAIP3b, c | Ubiquitin ligase | |
| TREX1 | DNA exonuclease | PPP2CA | Protein phosphatase |
| NMNAT2 | NAD(P) biosynthesis | UBE2L3 | Ubiquitin conjugation |
| CSK | Tyrosine kinase | SLC15A4 | Histidine transport |
| PDHX | Pyruvate dehydrogenase | Clearance of cell death debris | |
| Oxidative stress | C1Q | Ig binding | |
| MSH5 | DNA repair | FCGR2Bb | Ig binding |
| IKZF1 | Transcription | FCGR2Ab | Ig binding |
| IKZF3 | Transcription | CR2 | EBV receptor |
| ETS1b | Transcription | C1R | Ig binding |
| NCF2 | NADPH oxidase | C4B | Ig binding |
| mTOR | C4A | Ig binding | |
| SLC15A4 | Histidine transport | DNASE1 | DNA degradation |
Literature references are listed in Supplementary Table 1 (available on the Arthritis & Rheumatology web site at http://onlinelibrary.wiley.com/doi/10.1002/art.40223/abstract). PRPP = phosphoribosylpyrophosphate; mTOR= mechanistic target of rapamycin; EBV = Epstein‐Barr virus.
Gene also associated with rheumatoid arthritis.
Gene also associated with psoriatic arthritis.
As shown in Figure 2A, the evidence‐based interactome of lupus susceptibility genes reveals a network of relationships that are connected through kinases and phosphatases. The serine/threonine kinase mTOR has been imputed to play a role in this network on the basis of observations of lupus development in patients harboring activating gene mutations 11. Allowing for the inclusion of 10 more interactors in this network leads to recentering of the network around the mTOR‐autophagy pathway (Figure 2B). Notably, several lupus susceptibility genes have also been associated with RA and with psoriatic arthritis (PsA) (Table 1 and Supplementary Table 1). Construction of a map of these integrated metabolic and genetic pathways, as shown in Figure 1, could provide further insights into the pathogenesis of autoimmunity. Of note, the influence of metabolic genes on rheumatic diseases is not solely exerted through the immune system. In fact, the susceptibility genes often indirectly regulate the immune system by influencing the metabolism of adipocytes 12, hepatocytes 13, or endothelial cells 14. It is intriguing to consider that individual single‐nucleotide polymorphisms that, by themselves, confer a relatively minor genetic risk can coalesce to bring about major changes in metabolite fluxes, such as shifting glucose utilization from glycolysis to the PPP, TCA cycle, or biosynthesis of amino acids or lipids (Figure 1). As noted in Table 1 (see also Supplementary Table 1), most autoimmune disease susceptibility genes transduce metabolic signals.
Figure 2.
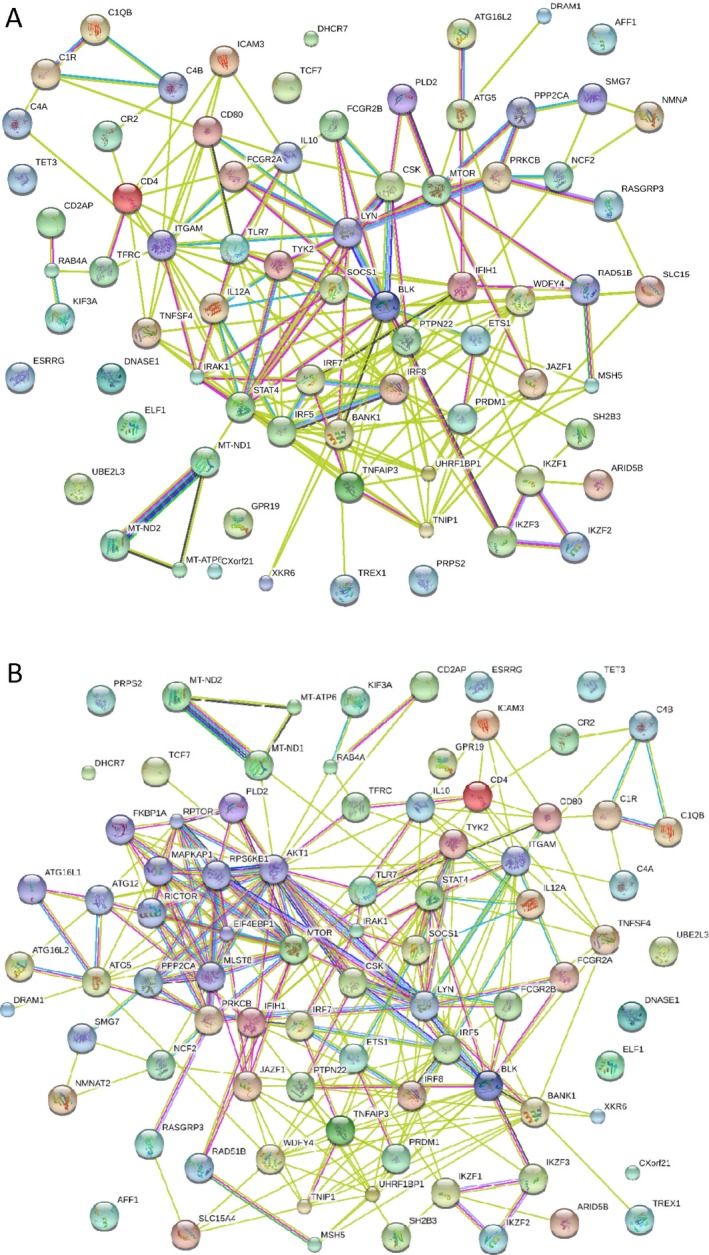
Interactome of lupus susceptibility genes, constructed using Strings software (version 9.0; http://string-db.org) via evidence‐based protein–protein interactions. A, Panel of imputed genes linked to the pathogenesis of systemic lupus erythematosus via polymorphic genetic markers or functionally relevant mutations. B, Panel of imputed genes (expanded from the panel in A) based on evidence allowing for inclusion of 10 additional interactors, appearing to center around the mechanistic target of rapamycin–autophagy pathway.
Influence of the environment on the host immunometabolome
Disease concordance rates in identical twins are only 15% for RA 15 and 25% for SLE 16, which suggests that environmental factors have an important role in the pathogenesis of these autoimmune diseases 9. These environmental factors include microbiota, such as viruses and bacteria, and also nutrients, drugs, and toxins, such as ultraviolet (UV) light, smoke, and other pollutants. Clearly, each of these ecologic factors affect the metabolism, as substrates, inducers, or suppressors of metabolic genes both inside and outside of the immune system. With respect to microbiota, both exogenous and endogenous viral RNA and DNA activate intracellular nucleic acid sensors 17. Viral RNA stimulates Toll‐like receptor 7 (TLR‐7)/TLR‐8 as well as retinoic acid gene I (RIG‐I)–like helicases. RIG‐I associates with the mitochondrial antiviral signaling (MAVS) protein, which is then activated by oxidative stress in patients with SLE 18.
In a study that performed metabolome fingerprinting of fresh stool samples, SLE patients were effectively distinguished from matched healthy subjects 19. Colonization with segmented filamentous bacteria has previously been found to enhance interleukin‐17 (IL‐17) receptor signaling 20. A survey of 16S ribosomal RNA genes showed that body mass index (BMI) has an effect on SLE at the level of the metabolite landscape, but not at the level of microbial composition. Moreover, the depletion of N‐acetyl‐muramic acid and N‐acetyl‐glucosamine, which are peptidoglycans of the bacterial cell wall, is a distinguishing feature in patients with SLE. Of note, N‐acetyl‐muramic acid is an inducer of inflammatory arthritis 21. Accumulation of plant‐derived shikimate‐3‐phosphate and its responsiveness to N‐acetyl‐cysteine (NAC) may be attributed to distortions in the activity of the PPP in SLE 22.
Disease‐specific changes to the immunometabolism
Genetic and environmental factors influence the immunometabolism in a disease‐specific manner. Differences among autoimmune syndromes are reflected by preferential involvement of cell types that mediate organ‐specific proinflammatory changes, such as fibroblasts in scleroderma skin and fibroblast‐like synoviocytes (FLS) in RA joints. Conspicuously, T cells in SLE patients and T cells in RA patients show opposite changes in redox signaling, as discussed in detail below and depicted in Figure 3.
Figure 3.
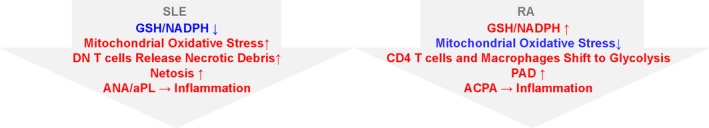
Contrasting influence of oxidative stress between systemic lupus erythematosus (SLE) and rheumatoid arthritis (RA) in terms of pentose phosphate pathway activity, depletion of glutathione (GSH) and NADPH, and generation of pathogenic antinuclear antibodies (ANAs) and antiphospholipid autoantibodies (aPL). Peptidylarginine deiminase (PAD) converts arginine to citrulline and triggers immunogenicity of self antigens and production of anti–citrullinated peptide antibodies (ACPAs) in patients with RA. DN = double‐negative.
SLE. Role of oxidative stress as a central pathway of lupus pathogenesis. Compartmentalized oxidative stress is a prominent feature of metabolic changes in SLE 23. As recently unveiled, oxidative stress underlies the interferon (IFN) signature via the stimulation of MAVS protein oligomerization in SLE 18. Mitochondrial reactive oxygen species are generated by electron transfer to molecular oxygen at complex I of the ETC (Figure 1). Oxidative stress may also be triggered by environmental factors, e.g., UV light, drugs, viruses, and bacteria. Oxidized mitochondrial DNA initiates the IFN signature via netosis 24. Paradoxically, NADPH production by the PPP is required for NADPH oxidase activity in neutrophils 25, indicating that glucose metabolism contributes to netosis. Expansion of necrosis‐prone double‐negative (DN) T cells promotes inflammation, a process that has been attributed to the release of the proinflammatory cytokines IL‐4 26 and IL‐17 27 and oxidized DNA and proteins 28. Alternatively, an inability to generate oxidative stress in phagocytic cells due to mutations of NADPH oxidase contributes to the development of discoid lupus 29. Presumably, the persistence of bacterial DNA and their CpG motifs triggers inflammation in these patients 30.
Balance of oxidative stress maintained by PPP and GSH metabolism. A key feature of oxidative stress is the depletion of GSH and cysteine, which is detectable in the lymphocytes of SLE patients 6. Comprehensive metabolome studies all point to the depletion of cysteine 22, which is a molecular target and rationale for the use of NAC for the treatment of SLE 31. Although the loss of GSH suggests that it has a causative role in oxidative stress, the underlying metabolic pathways remain incompletely characterized. GSH depletion occurs subsequent to a loss of NADPH and the accumulation of 3‐carbon to 7‐carbon sugars in SLE 22, indicating that glucose utilization in the PPP is diminished or inefficient. In CD4+ T cells, increased glycolysis may siphon glucose‐6‐phosphate (G6P) away from the PPP and limit the production of NADPH 32 (Figure 1). G6P is metabolized by G6P dehydrogenase (G6PD) to generate NADPH in the oxidative branch of the PPP. In a subsequent enzymatic reaction, 6‐phosphogluconate dehydrogenase also generates NADPH as well as R5P, an essential substrate for nucleotide biosynthesis and cell proliferation (Figure 1). Increased metabolic flux through the nonoxidative branch of the PPP is supported by enhanced expression and enzymatic activity of TAL 2, 33. The accumulation of sedoheptulose‐7‐phosphate, a unique substrate of TAL 2, 34, is also consistent with involvement of this PPP enzyme.
Kynurenine was found to be a top metabolic indicator of SLE, when assessed relative to that in matched healthy donors 22, 35. Importantly, the accumulation of kynurenine may stem from the depletion of NADPH, which is a cofactor of kynurenine hydroxylase 36. This mechanism is compatible with previous observations of the concurrent reversal of NADPH depletion and kynurenine accumulation in patients treated with NAC 22. Similar to branched amino acids (valine, leucine, and isoleucine) 37, kynurenine also stimulates mTOR complex 1 (mTORC1) 22. Thus, the NAC‐responsive accumulation of kynurenine is a biomarker of oxidative stress and a metabolic trigger of mTORC1 activation in SLE 22.
Activation of the mTOR pathway elicited by oxidative stress. Oxidative stress has been implicated in abnormal sphingolipid production, a biomarker of lupus nephritis 38. The sphingosine‐1‐phosphate (S1P) receptor (S1PR) pathway involves mTORC1, acting to promote the development of Th1 cells over Treg cells 39 (Figure 1). Accordingly, sphingosine kinase and S1PR‐mediated signaling have been targeted for the treatment of autoimmunity in patients with multiple sclerosis, those with lupus, those with RA, and those with inflammatory bowel disease (Table 2; specific source citations are listed in Supplementary Table 2, available on the Arthritis & Rheumatology web site at http://onlinelibrary.wiley.com/doi/10.1002/art.40223/abstract).
Table 2.
Pharmacologic targeting of metabolic pathways in the rheumatic diseasesa
| Drug | Mechanism of action | Molecular target | Disease |
|---|---|---|---|
| Methotrexate | Purine metabolism | DHFR | RA, PsA |
| Azathioprine | Guanine metabolism | TPMT/PRT | RA |
| Mycophenolate | Guanine synthesis | IMPDH | SLE |
| Leflunomide | Pyrimidine metabolism | DHODH | RA |
| Apremilast | PKA | PDE4 | PsA |
| Hydroxychloroquine | Autophagy | Lysosomal ATPase | RA, SLE, PsA |
| Corticosteroid | Glycolysis, autophagy | GCR | SLE, RA, PsA |
| Rapamycin | Autophagy | mTORC1 | SLE, lupus nephritis, SSc, RA/JRA, SS |
| Everolimus | Autophagy | mTORC1 | PH |
| OSI‐027 | ATP‐competitive | mTORC1/mTORC2 | SSc, RA |
| NAC | Antioxidant | GSH | SLE, RA/CIA, SS, ILD |
| Metformin | Antioxidant | ETC complex I | SLE, CIA |
| Fingolimod | Receptor modulator | S1P receptor | SLE, RA, MS, IBD |
| DHS1P | S1P antagonist | PTEN | SSc |
| PAT‐048 | Autotaxin inhibitor | LPA synthesis | SSc |
Literature references are listed in Supplementary Table 1 (available on the Arthritis & Rheumatology web site at http://onlinelibrary.wiley.com/doi/10.1002/art.40223/abstract). DHFR = dihydrofolate reductase; RA = rheumatoid arthritis; PsA = psoriatic arthritis; TPMT/PRT = thiopurine methyltransferase/phosphoribosyltransferase; IMPDH = inosine monophosphate dehydrogenase; SLE = systemic lupus erythematosus; DHODH = dihydroorotate dehydrogenase; PKA = protein kinase A; PDE4 = phosphodiesterase 4; GCR = glucocorticoid receptor; mTORC1 = mechanistic target of rapamycin complex 1; SSc = systemic sclerosis; JRA = juvenile RA; SS = Sjögren's syndrome; PH = pulmonary hypertension; GSH = glutathione; ILD = interstitial lung disease; ETC = electron transport chain; CIA = type II collagen–induced arthritis; S1P = sphingosine‐1‐phosphate; MS = multiple sclerosis; IBD = inflammatory bowel disease; LPA = lysophosphatidic acid.
Contribution of oxidative stress to the immunogenicity of autoantigens. Oxidative stress triggers the immunogenicity of phospholipid antigens 40. As a model of oxidative stress–induced production of antiphospholipid antibodies (aPL), mice deficient in the PPP enzyme TAL display oxidative stress in the liver, which is attributed to mTORC1‐dependent expression of NADH:ubiquinone oxidoreductase core subunit S3 (NDUFS3), a pro‐oxidant subunit of ETC complex I. Notably, rapamycin selectively blocks NDUFS3 expression and aPL production in both TAL‐deficient and lupus‐prone mice. The PON1 gene is secreted by the liver into the bloodstream, where it degrades oxidized phospholipids. PON1 is depleted in the serum of TAL‐deficient mice, as well as in the serum of patients with the antiphospholipid syndrome (APS) 41 and patients with SLE 42. Therefore, PON1 may be a transmitter of metabolic liver disease that instigates APS 43.
Dysregulated autophagy underlying oxidative stress. During increased demand for or short supply of nutrients, cells turn to alternative resources, such as degradation of dispensable organelles via autophagy. Given that enhanced autophagy involves an increase in endosome traffic and elevated expression of Rab4A, the resulting depletion of dynamin‐related protein 1 facilitates cell survival by retention of oxidative stress–generating mitochondria 44, 45. In addition to oxidative stress, cell traffic to the lysosomal membrane and sensing of amino acid sufficiency account for the activation of mTORC1 7. Whereas mTORC1 is activated 31, 33, mTORC2 is reduced in patients with SLE 46 (Figure 1).
The involvement of mTOR in lupus pathogenesis is further supported by the therapeutic blockade of T cell hyperactivity and nephritis by rapamycin both in mice and in patients with lupus (Table 2 and Supplementary Table 2). The contraction of proinflammatory, necrosis‐prone DN T cells and expansion of Treg cells have each been proposed as mechanisms of action for rapamycin 26. Oxidative stress apparently lies upstream of mTORC1 activation in T cells, since NAC has similar immunologic effects 31. Activation of AMP‐dependent protein kinase (AMPK), which inhibits mTORC1, has been shown to have clinical benefit in mouse models of lupus 32. Moreover, mTORC1 is activated in B cells 47 and promotes plasma cell development in lupus‐prone mice 48. Thus, similar to that observed in T cells 33, 44, mTORC1 activity and autophagy are also enhanced in lupus B cells 48, 49.
RA. Unlike in SLE 32, CD4+ T cells in RA exhibit diminished glycolytic activity 50, thus rendering them more inclined to utilize the PPP for production of NADPH 8. CD4+ T cells in patients with RA also show diminished autophagy without changes in mTOR activity 50. In contrast to the above‐mentioned elevations in NADPH levels, GSH is diminished in the peripheral blood 51 as well as synovial T cells 52 of patients with RA. Whereas cysteine production is reduced, cystine and homocysteine levels are elevated in the sera of RA patients 53, reflective of the effects of oxidative stress in RA. These findings suggest that oxidative stress is compartmentalized and there is a discordance between the NADPH and GSH pools in RA T cells (Figure 3). In contrast to the findings in SLE, peripheral blood RA T cells do not exhibit MHP 6 and do not have increased mitochondrial ETC activity 54.
The concept of increased glycolysis occurring in RA is supported by observations of the accumulation of lactate in RA joints 55. Combined studies of metabolic flux and genetic factors in RA FLS unveiled evidence of synovial hypoxia with mitochondrial dysfunction and a switch to glycolysis. These findings apparently support the typical RA characteristics of abnormal angiogenesis, cellular invasion, and pannus formation. Importantly, such metabolic changes were found to be correlated with the extent of inflammation, as detected by hybrid positron emission tomography/magnetic resonance imaging 56. Although T cells do not show mTOR activation, monocytes and FLS do, and therefore these cells have served as targets for therapeutic intervention with rapamycin in animal models and in patients with RA and those with juvenile RA (Table 2 and Supplementary Table 2). In particular, rapamycin blocks the invasiveness of FLS in RA patients 57. Deficiency of indoleamine 2,3‐dioxygenase, which catabolizes tryptophan into kynurenine, has been implicated in the pathogenesis of RA and its animal model, type II collagen–induced arthritis (CIA) (Table 3; specific source citations are listed in Supplementary Table 3, available on the Arthritis & Rheumatology web site at http://onlinelibrary.wiley.com/doi/10.1002/art.40223/abstract). Changes in the levels of tryptophan and kynurenine have also been shown in the sera and synovial fluid of patients with RA and patients with ankylosing spondylitis (AS) (Table 3 and Supplementary Table 3).
Table 3.
Nutraceutical targeting of metabolic pathways in the rheumatic diseasesa
| Nutrient | Mechanism of action | Disease or model | Outcome |
|---|---|---|---|
| Extra‐virgin olive oil | Antioxidant | Pristane nephritis | Protection |
| Acidic drinking water | Microbiome shift | SNF1 lupus | Protection |
| Polyunsaturated fatty acid | CD4+ T cells | (NZB × NZW)F1 lupus | Protection |
| Fish oil | IL‐1, IL‐6, TNF | (NZB × NZW)F1 lupus | Protection |
| Apo A‐I mimetic L‐4F | aPL | ApoE–/CD95– lupus | Protection |
| Taurine | Antioxidant | (NZB × NZW)F1 hepatitis | Protection |
| Indole‐3‐carbinol | Antioxidant | (NZB × NZW)F1 lupus | Protection |
| Triterpenoid | Antioxidant/mTOR | MRL/lpr nephritis | Protection |
| Omega‐3 fatty acid | TNF blockade | CIA | Protection |
| Curcumin | BAFF | CIA | Protection |
| Fructo‐oligosaccharides | Microbiota | Colitis/HLA–B27 | Protection |
| Weight gain | Oxidative stress | MRL/lpr nephritis | Exacerbation |
| High‐fat diet | Apo E | Lupus‐like nephritis | Exacerbation |
| High‐fat diet | LDL receptor | Lupus‐like nephritis | Exacerbation |
| High‐fat diet | TLR‐4 | CIA | Exacerbation |
Literature references are listed in Supplementary Table 2 (available on the Arthritis & Rheumatology web site at http://onlinelibrary.wiley.com/doi/10.1002/art.40223/abstract). IL‐1 = interleukin‐1; TNF = tumor necrosis factor; Apo A‐I = apolipoprotein A‐I; aPL = antiphospholipid antibodies; mTOR = mechanistic target of rapamycin; CIA = type II collagen–induced arthritis; LDL = low‐density lipoprotein; TLR‐4 = Toll‐like receptor 4.
Other rheumatic diseases. In patients with AS, in addition to the role of HLA–B27, GWAS studies have implicated endoplasmic reticulum aminopeptidases (ERAPs) in disease pathogenesis. ERAPs process peptides for presentation by major histocompatibility complex class I 58. Protective variants confer reduced enzymatic activity. Interactions between ERAP‐1 and HLA–B27 affect peptide handling during antigen presentation 59. Activation of the insulin‐like growth factor 1 receptor in T cells from patients with AS has been shown to stimulate the phosphatidylinositol 3‐kinase (PI3K)–Akt–mTOR axis 60. Thus, mTOR activation and enhanced autophagy may interact to shape the development of proinflammatory T cells in patients with AS (Figure 1).
Activation of mTORC1 drives the expansion of Th17 cells, which orchestrates the emergence of inflammation in the skin and joints of patients with PsA 61. GWAS studies have linked Raptor, a component of mTORC1, to psoriasis 62. Moreover, the activation of mTORC1 is supported by evidence of increased phosphorylation of mTOR and S6 kinase in psoriatic skin lesions 63. The activation of mTORC1 may result from increased expression of programmed death 1 (PD‐1) in T cells of patients with PsA 64. Up to 40% of PD‐1 antibody–treated patients with cancer developed a skin disease resembling psoriasis 65. Such an impact of PD‐1 blockade involves mitochondrial oxidative stress–dependent mTORC1 activation 66, indicating that the outcome of PD‐1 signaling in terms of its effects on the mTOR pathway may be specific to cell type. Therefore, a combination treatment regimen involving anti–PD‐1 in conjunction with NAC or rapamycin may offer clinical benefit.
Genetic factors and metabolic pathways that regulate oxidative stress have been linked to scleroderma and progressive systemic sclerosis 67, 68. Oxidative stress is a trigger of transforming growth factor β (TGFβ) 69, which plays a central role in the activation and production of collagen by fibroblasts in the skin and parenchymal organs 70. In response to TGFβ, mTORC1 activity appears essential to sustain the proliferation of fibroblasts 71. Expectedly, rapamycin blocks the TGFβ‐induced proliferation of fibroblasts 72 and production of type I collagen 73. In accordance with the concept of a pathogenic role of oxidative stress, intravenous NAC may have clinical efficacy in scleroderma patients with Raynaud's phenomenon 74 and those with interstitial lung disease 75.
Metabolic targets of treatment in rheumatic diseases
Glucocorticoids have revolutionized the treatment of patients with arthritis and other inflammatory diseases since the mid‐20th century 76. They bind to the glucocorticoid receptor and regulate transcription of genes involved in metabolism 77. The efficacy of glucocorticoids has been linked to inhibition of glycolysis 78, while the stimulation of autophagy 79 and mTOR activity 80 are mechanisms that have been identified as underlying the resistance to glucocorticoids.
Most conventional disease‐modifying antirheumatic drugs (DMARDs), including methotrexate, mycophenolate mofetil, and leflunomide, target purine or pyrimidine nucleotide metabolism (Table 2 and Supplementary Table 2). The newly introduced DMARD apremilast also targets purine metabolism, since it increases cAMP levels and cAMP‐dependent protein kinase A activity (Table 2 and Supplementary Table 2). Although hydroxychloroquine has long been used as a DMARD, its mechanism of action is newly attributed to blockade of autophagy through the inhibition of lysosomal acidification 81 (Figure 1). Surprisingly, the autophagy inducer rapamycin and other rapalogs are also beneficial in autoimmune diseases 7. Inhibitors of PI3K or AKT and activators of AMPK, which act upstream of mTORC1, are also being tested for efficacy in autoimmunity (Table 2 and Supplementary Table 2). However, unlike rapamycin, the AMPK activator metformin has not reduced the severity of nephritis in lupus‐prone mice, except when this treatment was combined with 2‐deoxyglucose (2DG), which blocks glycolysis 32.
The therapeutic use of NAC in SLE has been supported by its effects on oxidative stress and the depletion of GSH in T cells 6 as well as by the depletion of cysteine in both the lymphocytes and plasma of patients with SLE 22, 35. DHS1P and fingolimod block S1P signaling and the downstream activation of mTORC1 (Table 2 and Supplementary Table 2). Based on their synergistic mechanism of action, rapamycin, NAC, fingolimod, and metformin may be combined for the blockade of mTORC1 activity at multiple levels (Figure 1). Future clinical trials should be directed at rigorously testing such combination treatments in order to maximize the therapeutic benefit, rather than relying on the clinical efficacy of single medications that target distinct metabolic pathways either sensed or impacted by mTOR.
Effect of nutrients on autoimmune rheumatic diseases
In addition to conventional drugs, diet and nutraceuticals may influence autoimmunity. Studies both in humans and in animals have shown that a high‐calorie and high‐fat diet predispose individuals to the development of RA and lupus and its serious comorbidities, glomerulonephritis and atherosclerosis (Table 3 and Supplementary Table 3). However, subsets of lipids, e.g., fish oil, extra‐virgin olive oil, and terpenoids, have antioxidant properties and reduce the severity of nephritis in patients with SLE (Table 3 and Supplementary Table 3). Along these lines, calorie intake and the composition of dietary lipids can affect the levels of adipokines, oxidative stress, and disease activity in patients with RA (Table 3 and Supplementary Table 3). A predisposition to multiple autoimmune diseases in patients with celiac disease, which is characterized by sensitivity to the wheat protein gluten, is attributed to multiple genetic factors, although secondary deficiency of nutrients may also be a contributing factor 82. The lysosomal receptor SLC15A4, which transports histidine, has been genetically linked to lupus via the mTOR pathway–mediated activation of B cells and dendritic cells (Table 1 and Supplementary Table 1). Among the amino acids, kynurenine is a natural ligand of the aryl hydrocarbon receptor (AhR) 83. Activation of mTORC1 by kynurenine 22 is consistent with the concept of a regulatory cross‐talk occurring between the AhR and mTOR pathways 84. Whereas the levels of kynurenine and its precursor, tryptophan, are increased, the levels of cysteine, histidine, glutamine, and glutamate are depleted in patients with SLE 22, 35. Thus, designer diets with a predetermined composition and concentration of amino acids may represent a new avenue in patients with SLE and other rheumatic diseases.
Unmet needs and future directions
For the future, the large number of unidentified metabolites and mapping of their origin from nutrients, host cell metabolism, or microbiota represent significant instrumental, data‐handling, and theoretical challenges. While rheumatic disease susceptibility genes regulate metabolic pathways in a cell type–specific manner (Table 1 and Supplementary Table 1), metabolites themselves also exert control over gene expression through epigenetic mechanisms 85. Moreover, commonly used and clinically effective DMARDs, such as methotrexate, and medications that target metabolic diseases, such as metformin (Table 2 and Supplementary Table 2), affect the immune system in intricate ways, dictated by various genetic, nutrient, and environmental factors (Figure 1). Taking into account such levels of complexity represents a significant unmet need of clinical trial design, since the chosen end points should inform about efficacy and predict responders and nonresponders. Focused efforts should further delineate the metabolites that control the skewing toward a proinflammatory lineage, as these metabolites represent biomarkers of pathogenesis and targets for treatment. Given that checkpoint blockade with anti–PD‐1 involves mitochondrial oxidative stress–dependent mTORC1 activation 66, a combination treatment regimen with NAC or rapamycin may offer clinical benefit by averting iatrogenic autoimmunity in patients with cancer. Importantly, the use of nutraceuticals in combination with biologic agents that target pathways of pathogenesis could also eliminate or reduce the unwanted side effects of traditional immunosuppressants.
Conclusions
Metabolic pathways regulate the development of the immune system, including lineage specification and cell proliferation and survival, which occurs in a cell type–specific manner in response to cues from growth factors, hormones, cytokines, deprivation or overload of nutrients, and microbiota. This review has mechanistically connected the specific metabolites and their receptors that have been genetically linked to disease susceptibility with nutrient‐dependent immune system activation. The metabolites identified include those that regulate lineage specification within the adaptive and innate immune systems during the pathogenesis of common and potentially fatal autoimmune rheumatic diseases.
Rapidly proliferating proinflammatory T cells and B cells and macrophages generally favor glycolysis over fatty acid oxidation for ATP generation. Mitochondrial ATP production is reduced in patients with SLE 6, a process that has been attributed to blocked ETC activity, GSH depletion, and oxidative stress 54. There is a clear contrast in glucose utilization and redox signaling in T cells between patients with SLE and patients with RA. Whereas patients with SLE exhibit increased metabolism of glucose through glycolysis and the PPP, glucose is preferentially metabolized by the PPP in RA T cells, which exhibit greater NADPH production due to the activation of G6PD 7. Based on the efficacy of blockade of glycolysis by 2DG in mice 1 and the enhancement of NADPH by NAC 8, an approach that has shown remarkable clinical efficacy in patients with SLE 9, 10, an increased flux of glucose through the PPP appears to be a desirable outcome in lupus (Figures 1 and 3). Thus, SLE patients 9 and mice with lupus benefit from treatment with antioxidants 1, whereas RA patients and mice with CIA apparently do not experience such a clinical benefit 7. Unlike in RA 11, oxidative stress–induced mTOR activation contributes to autoimmunity in lupus, psoriasis, PsA, AS, and rheumatic diseases in cancer patients treated with checkpoint inhibitors 12. Importantly, mTOR activation also underlies glucocorticoid resistance 6. Therefore, these considerations warrant an integrated genetics‐ and metabolome‐based systems biology approach toward understanding the pathogenesis and development of personalized treatments in the autoimmune rheumatic diseases.
AUTHOR CONTRIBUTIONS
Dr. Perl drafted the article, revised it critically for important intellectual content, and approved the final version to be published.
ROLE OF THE STUDY SPONSOR
Pfizer provided financial support for Dr. Perl's Investigator‐Initiated Research Grant. Pfizer had no role in the design or writing of this review or the decision to submit the review for publication. Publication of this article was not contingent upon approval by Pfizer.
Supporting information
Supplementary Table 1
Supplementary Table 2
Supplementary Table 3
Supported in part by the NIH and the Central New York Community Foundation (grants AI‐048079, AI‐072648, AI‐122176, and AR‐068052) and Pfizer (Investigator‐Initiated Research Grant P0468X1‐4470/WS1234172).
REFERENCES
- 1. Olenchock BA, Rathmell JC, Vander Heiden MG. Biochemical underpinnings of immune cell metabolic phenotypes. Immunity 2017;46:703–13. [DOI] [PMC free article] [PubMed] [Google Scholar]
- 2. Perl A, Hanczko R, Telarico T, Oaks Z, Landas S. Oxidative stress, inflammation and carcinogenesis are controlled through the pentose phosphate pathway by transaldolase. Trends Mol Med 2011;7:395–403. [DOI] [PMC free article] [PubMed] [Google Scholar]
- 3. Banki K, Hutter E, Colombo E, Gonchoroff NJ, Perl A. Glutathione levels and sensitivity to apoptosis are regulated by changes in transaldolase expression. J Biol Chem 1996;271:32994–3001. [DOI] [PubMed] [Google Scholar]
- 4. Banki K, Hutter E, Gonchoroff NJ, Perl A. Molecular ordering in HIV‐induced apoptosis: oxidative stress, activation of caspases, and cell survival are regulated by transaldolase. J Biol Chem 1998;273:11944–53. [DOI] [PubMed] [Google Scholar]
- 5. Banki K, Hutter E, Gonchoroff N, Perl A. Elevation of mitochondrial transmembrane potential and reactive oxygen intermediate levels are early events and occur independently from activation of caspases in Fas signaling. J Immunol 1999;162:1466–79. [PMC free article] [PubMed] [Google Scholar]
- 6. Gergely P Jr, Grossman C, Niland B, Puskas F, Neupane H, Allam F, et al. Mitochondrial hyperpolarization and ATP depletion in patients with systemic lupus erythematosus. Arthritis Rheum 2002;46:175–90. [DOI] [PMC free article] [PubMed] [Google Scholar]
- 7. Perl A. Mechanistic target of rapamycin pathway activation in rheumatic diseases. Nat Rev Rheumatol 2016;12:169–82. [DOI] [PMC free article] [PubMed] [Google Scholar]
- 8. Yang Z, Shen Y, Oishi H, Matteson EL, Tian L, Goronzy J Jr, et al. Restoring oxidant signaling suppresses pro‐arthritogenic T‐cell effector functions in rheumatoid arthritis. Sci Transl Med 2016;8:331ra38. [DOI] [PMC free article] [PubMed] [Google Scholar]
- 9. Perl A. Systems biology of lupus: mapping the impact of genomic and environmental factors on gene expression signatures, cellular signaling, metabolic pathways, hormonal and cytokine imbalance, and selecting targets for treatment. Autoimmunity 2010;43:32–47. [DOI] [PMC free article] [PubMed] [Google Scholar]
- 10. Harley JB, Alarcon‐Riquelme ME, Criswell LA, Jacob CO, Kimberly RP, Moser KL, et al. Genome‐wide association scan in women with systemic lupus erythematosus identifies susceptibility variants in ITGAM, PXK, KIAA1542 and other loci. Nat Genet 2008;40:204–10. [DOI] [PMC free article] [PubMed] [Google Scholar]
- 11. Oaks Z, Winans T, Huang N, Banki K, Perl A. Activation of the mechanistic target of rapamycin in SLE: explosion of evidence in the last five years. Curr Rheum Rep 2016;18:73. [DOI] [PMC free article] [PubMed] [Google Scholar]
- 12. Ming GF, Xiao D, Gong WJ, Liu HX, Liu J, Zhou HH, et al. JAZF1 can regulate the expression of lipid metabolic genes and inhibit lipid accumulation in adipocytes. Biochem Biophys Res Commun 2014;445:673–80. [DOI] [PubMed] [Google Scholar]
- 13. Kang HS, Liao G, DeGraff LM, Gerrish K, Bortner CD, Garantziotis S, et al. CD44 plays a critical role in regulating diet‐induced adipose inflammation, hepatic steatosis, and insulin resistance. PLoS One 2013;8:e58417. [DOI] [PMC free article] [PubMed] [Google Scholar]
- 14. Randhawa PK, Rylova S, Heinz JY, Kiser S, Fried JH, Dunworth WP, et al. The Ras activator RasGRP3 mediates diabetes‐induced embryonic defects and affects endothelial cell migration. Circulation Res 2011;108:1199–208. [DOI] [PMC free article] [PubMed] [Google Scholar]
- 15. Terao C, Raychaudhuri S, Gregersen PK. Recent advances in defining the genetic basis of rheumatoid arthritis. Ann Rev Genom Hum Genet 2016;17:273–301. [DOI] [PMC free article] [PubMed] [Google Scholar]
- 16. Deafen D, Escalante A, Weinrib L, Horwitz D, Bachman B, Roy‐Burman P, et al. A revised estimate of twin concordance in systemic lupus erythematosus. Arthritis Rheum 1992;35:311–8. [DOI] [PubMed] [Google Scholar]
- 17. Mavragani CP, Sagalovskiy I, Guo Q, Nezos A, Kapsogeorgou EK, Lu P, et al. Expression of long interspersed nuclear element 1 retroelements and induction of type I interferon in patients with systemic autoimmune disease. Arthritis Rheumatol 2016;68:2686–96. [DOI] [PMC free article] [PubMed] [Google Scholar]
- 18. Buskiewicz I, Montgomery T, Yasewicz EC, Huber SA, Murphy MP, Hartley RC, et al. Reactive oxygen species induce virus‐independent MAVS‐oligomerization in systemic lupus erythematosus. Sci Signal 2016;29:ra115. [DOI] [PMC free article] [PubMed] [Google Scholar]
- 19. Rojo D, Hevia A, Bargiela R, Lopez P, Cuervo A, Gonzalez S, et al. Ranking the impact of human health disorders on gut metabolism: systemic lupus erythematosus and obesity as study cases. Sci Rep 2015;5:8310. [DOI] [PMC free article] [PubMed] [Google Scholar]
- 20. Van Praet JT, Donovan E, Vanassche I, Drennan MB, Windels F, Dendooven A, et al. Commensal microbiota influence systemic autoimmune responses. EMBO J 2015;34:466–74. [DOI] [PMC free article] [PubMed] [Google Scholar]
- 21. Kohashi O, Pearson CM, Watanabe Y, Kotani S, Koga T. Structural requirements for arthritogenicity of peptidoglycans from staphylococcus aureus and lactobacillus plantarum and analogous synthetic compounds. J Immunol 1976;116:1635–9. [PubMed] [Google Scholar]
- 22. Perl A, Hanczko R, Lai ZW, Oaks Z, Kelly R, Borsuk R, et al. Comprehensive metabolome analyses reveal N‐acetylcysteine‐responsive accumulation of kynurenine in systemic lupus erythematosus: implications for activation of the mechanistic target of rapamycin. Metabolomics 2015;11:1157–74. [DOI] [PMC free article] [PubMed] [Google Scholar]
- 23. Perl A. Oxidative stress in the pathology and treatment of systemic lupus erythematosus. Nat Rev Rheumatol 2013;9:674–86. [DOI] [PMC free article] [PubMed] [Google Scholar]
- 24. Lood C, Blanco LP, Purmalek MM, Carmona‐Rivera C, de Ravin SS, Smith CK, et al. Neutrophil extracellular traps enriched in oxidized mitochondrial DNA are interferogenic and contribute to lupus‐like disease. Nat Med 2016;22:146–53. [DOI] [PMC free article] [PubMed] [Google Scholar]
- 25. Azevedo EP, Rochael NC, Guimarães‐Costa AB, de Souza‐Vieira TS, Ganilho J, Saraiva EM, et al. A metabolic shift toward pentose phosphate pathway is necessary for amyloid fibril‐ and phorbol 12‐myristate 13‐acetate‐induced neutrophil extracellular trap (NET) formation. J Biol Chem 2015;290:22174–83. [DOI] [PMC free article] [PubMed] [Google Scholar]
- 26. Lai ZW, Borsuk R, Shadakshari A, Yu J, Dawood M, Garcia R, et al. mTOR activation triggers IL‐4 production and necrotic death of double‐negative T cells in patients with systemic lupus eryhthematosus. J Immunol 2013;191:2236–46. [DOI] [PMC free article] [PubMed] [Google Scholar]
- 27. Crispin JC, Oukka M, Bayliss G, Cohen RA, van Beek CA, Stillman IE, et al. Expanded double negative T cells in patients with systemic lupus erythematosus produce IL‐17 and infiltrate the kidneys. J Immunol 2008;181:8761–6. [DOI] [PMC free article] [PubMed] [Google Scholar]
- 28. Sauter B, Albert ML, Francisco L, Larsson M, Somersan S, Bhardwaj N. Consequences of cell death: exposure to necrotic tumor cells, but not primary tissue cells or apoptotic cells, induces the maturation of immunostimulatory dendritic cells. J Exp Med 2000;191:423–34. [DOI] [PMC free article] [PubMed] [Google Scholar]
- 29. Winkelstein JA, Marino MC, Johnston RB, Boyle J, Curnutte J, Gallin JI, et al. Chronic granulomatous disease: report on a national registry of 368 patients. Medicine (Baltimore) 2000;79:155–69. [DOI] [PubMed] [Google Scholar]
- 30. Pisetsky DS. The origin and properties of extracellular DNA: from PAMP to DAMP. Clin Immunol 2012;144:32–40. [DOI] [PMC free article] [PubMed] [Google Scholar]
- 31. Lai ZW, Hanczko R, Bonilla E, Caza TN, Clair B, Bartos A, et al. N‐acetylcysteine reduces disease activity by blocking mammalian target of rapamycin in T cells from systemic lupus erythematosus patients: a randomized, double‐blind, placebo‐controlled trial. Arthritis Rheum 2012;64:2937–46. [DOI] [PMC free article] [PubMed] [Google Scholar]
- 32. Yin Y, Choi SC, Xu Z, Perry DJ, Seay H, Croker BP, et al. Normalization of CD4+ T cell metabolism reverses lupus. Sci Transl Med 2015;7:274ra18. [DOI] [PMC free article] [PubMed] [Google Scholar]
- 33. Fernandez DR, Telarico T, Bonilla E, Li Q, Banerjee S, Middleton FA, et al. Activation of mTOR controls the loss of TCR in lupus T cells through HRES‐1/Rab4‐regulated lysosomal degradation. J Immunol 2009;182:2063–73. [DOI] [PMC free article] [PubMed] [Google Scholar]
- 34. Vas Gy, Conkrite K, Amidon W, Qian Y, Banki K, Perl A. Study of transaldolase deficiency in urine samples by capillary LC‐MS/MS. J Mass Spec 2005;41:463–9. [DOI] [PMC free article] [PubMed] [Google Scholar]
- 35. Bengtsson AA, Trygg J, Wuttge DM, Sturfelt G, Theander E, Donten M, et al. Metabolic profiling of systemic lupus erythematosus and comparison with primary Sjögren's syndrome and systemic sclerosis. PLoS One 2016;11:e0159384. [DOI] [PMC free article] [PubMed] [Google Scholar]
- 36. Breton J, Avanzi N, Magagnin S, Covini N, Magistrelli G, Cozzi L, et al. Functional characterization and mechanism of action of recombinant human kynurenine 3‐hydroxylase. Eur J Biochem 2000;267:1092–9. [DOI] [PubMed] [Google Scholar]
- 37. Proud CG. Regulation of mammalian translation factors by nutrients. Eur J Biochem 2002;269:5338–49. [DOI] [PubMed] [Google Scholar]
- 38. Nowling TK, Mather AR, Thiyagarajan T, Hernández‐Corbacho MJ, Powers TW, Jones EE, et al. Renal glycosphingolipid metabolism is dysfunctional in lupus nephritis. J Am Soc Nephrol 2015;26:1402–13. [DOI] [PMC free article] [PubMed] [Google Scholar]
- 39. Liu G, Yang K, Burns S, Shrestha S, Chi H. The S1P1‐mTOR axis directs the reciprocal differentiation of TH1 and Treg cells. Nat Immunol 2010;11:1047–56. [DOI] [PMC free article] [PubMed] [Google Scholar]
- 40. Ioannou Y, Zhang JY, Qi M, Gao L, Qi JC, Yu DM, et al. Novel assays of thrombogenic pathogenicity in the antiphospholipid syndrome based on the detection of molecular oxidative modification of the major autoantigen β2‐glycoprotein I. Arthritis Rheum 2011;63:2774–82. [DOI] [PMC free article] [PubMed] [Google Scholar]
- 41. Lambert M, Boullier A, Hachulla E, Fruchart JC, Teissier E, Hatron PY, et al. Paraoxonase activity is dramatically decreased in patients positive for anticardiolipin antibodies. Lupus 2000;9:299–300. [DOI] [PubMed] [Google Scholar]
- 42. Delgado Alves J, Ames PR, Donohue S, Stanyer L, Noorouz‐Zadeh J, Ravirajan C, et al. Antibodies to high‐density lipoprotein and β2‐glycoprotein I are inversely correlated with paraoxonase activity in systemic lupus erythematosus and primary antiphospholipid syndrome. Arthritis Rheum 2002;46:2686–94. [DOI] [PubMed] [Google Scholar]
- 43. Oaks Z, Winans T, Caza T, Fernandez D, Liu Y, Landas SK, et al. Mitochondrial dysfunction in the liver and antiphospholipid antibody production precede disease onset and respond to rapamycin in lupus‐prone mice. Arthritis Rheumatol 2016;68:2728–39. [DOI] [PMC free article] [PubMed] [Google Scholar]
- 44. Caza TN, Fernandez D, Talaber G, Oaks Z, Haas M, Madaio MP, et al. HRES‐1/RAB4‐mediated depletion of DRP1 impairs mitochondrial homeostasis and represents a target for treatment in SLE. Ann Rheum Dis 2014;73:1887–97. [DOI] [PMC free article] [PubMed] [Google Scholar]
- 45. Talaber G, Miklossy G, Oaks Z, Liu Y, Tooze SA, Chudakov DM, et al. HRES‐1/Rab4 promotes the formation of LC3+ autophagosomes and the accumulation of mitochondria during autophagy. PLoS One 2014;9:e84392. [DOI] [PMC free article] [PubMed] [Google Scholar]
- 46. Kato H, Perl A. MTORC1 expands Th17 and IL‐4+ DN T cells and contracts Tregs in SLE. J Immunol 2014;192:4134–44. [DOI] [PMC free article] [PubMed] [Google Scholar]
- 47. Wu T, Qin X, Kurepa Z, Kumar KR, Liu K, Kanta H, et al. Shared signaling networks active in B cells isolated from genetically distinct mouse models of lupus. J Clin Invest 2007;117:2186–96. [DOI] [PMC free article] [PubMed] [Google Scholar]
- 48. Jones DD, Gaudette BT, Wilmore JR, Chernova I, Bortnick A, Weiss BM, et al. mTOR has distinct functions in generating versus sustaining humoral immunity. J Clin Invest 2016;126:4250–61. [DOI] [PMC free article] [PubMed] [Google Scholar]
- 49. Clarke AJ, Ellinghaus U, Cortini A, Stranks A, Simon AK, Botto M, et al. Autophagy is activated in systemic lupus erythematosus and required for plasmablast development. Ann Rheum Dis 2015;74:912–20. [DOI] [PMC free article] [PubMed] [Google Scholar]
- 50. Yang Z, Fujii H, Mohan SV, Goronzy JJ, Weyand CM. Phosphofructokinase deficiency impairs ATP generation, autophagy, and redox balance in rheumatoid arthritis T cells. J Exp Med 2013;210:2119–34. [DOI] [PMC free article] [PubMed] [Google Scholar]
- 51. Rider DA, Bayley R, Clay E, Young SP. Does oxidative inactivation of CD45 phosphatase in rheumatoid arthritis underlie immune hyporesponsiveness? Antioxid Redox Signal 2013;19:2280–5. [DOI] [PMC free article] [PubMed] [Google Scholar]
- 52. Maurice MM, Nakamura H, van der Voort EA, van Vliet AI, Staal FJ, Tak PP, et al. Evidence for the role of an altered redox state in hyporesponsiveness of synovial T cells in rheumatoid arthritis. J Immunol 1997;158:1458–65. [PubMed] [Google Scholar]
- 53. Giustarini D, Lorenzini S, Rossi R, Chindamo D, di Simplicio P, Marcolongo R. Altered thiol pattern in plasma of subjects affected by rheumatoid arthritis. Clin Exp Rheumatol 2005;23:205–12. [PubMed] [Google Scholar]
- 54. Doherty E, Oaks Z, Perl A. Increased mitochondrial electron transport chain activity at complex I is regulated by N‐acetylcysteine in lymphocytes of patients with systemic lupus erythematosus. Antioxid Redox Signal 2014;21:56–65. [DOI] [PMC free article] [PubMed] [Google Scholar]
- 55. Haas R, Smith J, Rocher‐Ros V, Nadkarni S, Montero‐Melendez T, D'Acquisto F, et al. Lactate regulates metabolic and pro‐inflammatory circuits in control of T cell migration and effector functions. PLoS Biol 2015;13:e1002202. [DOI] [PMC free article] [PubMed] [Google Scholar]
- 56. Biniecka M, Canavan M, McGarry T, Gao W, McCormick J, Cregan S, et al. Dysregulated bioenergetics: a key regulator of joint inflammation. Ann Rheum Dis 2016;75:2192–200. [DOI] [PMC free article] [PubMed] [Google Scholar]
- 57. Laragione T, Gulko PS. mTOR regulates the invasive properties of synovial fibroblasts in rheumatoid arthritis. Mol Med 2010;16:352–8. [DOI] [PMC free article] [PubMed] [Google Scholar]
- 58. International Genetics of Ankylosing Spondylitis Consortium (IGAS) , Cortes A, Hadler J, Pointon JP, Robinson PC, Karaderi T, et al. Identification of multiple risk variants for ankylosing spondylitis through high‐density genotyping of immune‐related loci. Nat Genet 2013;45:730–8. [DOI] [PMC free article] [PubMed] [Google Scholar]
- 59. Evans DM, Spencer CC, Pointon JJ, Su Z, Harvey D, Kochan G, et al. Interaction between ERAP1 and HLA‐B27 in ankylosing spondylitis implicates peptide handling in the mechanism for HLA‐B27 in disease susceptibility. Nat Genet 2011;43:761–7. [DOI] [PMC free article] [PubMed] [Google Scholar]
- 60. Kooijman R, Lauf JJ, Kappers AC, Rijkers GT. Insulin‐like growth factor induces phosphorylation of immunoreactive insulin receptor substrate and its association with phosphatidylinositol‐3 kinase in human thymocytes. J Exp Med 1995;182:593–7. [DOI] [PMC free article] [PubMed] [Google Scholar]
- 61. Mease PJ. Inhibition of interleukin‐17, interleukin‐23 and the TH17 cell pathway in the treatment of psoriatic arthritis and psoriasis. Curr Opin Rheumatol 2015;27:127–33. [DOI] [PubMed] [Google Scholar]
- 62. Helms C, Cao L, Krueger JG, Wijsman EM, Chamian F, Gordon D, et al. A putative RUNX1 binding site variant between SLC9A3R1 and NAT9 is associated with susceptibility to psoriasis. Nat Genet 2003;35:349–56. [DOI] [PubMed] [Google Scholar]
- 63. Buerger C, Malisiewicz B, Eiser A, Hardt K, Boehncke WH. Mammalian target of rapamycin and its downstream signalling components are activated in psoriatic skin. Br J Dermatol 2013;169:156–9. [DOI] [PubMed] [Google Scholar]
- 64. Peled M, Strazza M, Azoulay‐Alfaguter I, Mor A. Analysis of programmed death‐1 in patients with psoriatic arthritis. Inflammation 2015;38:1573–9. [DOI] [PubMed] [Google Scholar]
- 65. Sibaud V, Meyer N, Lamant L, Vigarios E, Mazieres J, Delord JP. Dermatologic complications of anti‐PD‐1/PD‐L1 immune checkpoint antibodies. Curr Opin Oncol 2016;28:254–63. [DOI] [PubMed] [Google Scholar]
- 66. Chamoto K, Chowdhury PS, Kumar A, Sonomura K, Matsuda F, Fagarasan S, et al. Mitochondrial activation chemicals synergize with surface receptor PD‐1 blockade for T cell‐dependent antitumor activity. Proc Natl Acad Sci U S A 2017;114:E761–70. [DOI] [PMC free article] [PubMed] [Google Scholar]
- 67. Tikly M, Marshall SE, Haldar NA, Gulumian M, Wordsworth P, Welsh KI. Oxygen free radical scavenger enzyme polymorphisms in systemic sclerosis. Free Rad Biol Med 2004;36:1403–7. [DOI] [PubMed] [Google Scholar]
- 68. Orciani M, Svegliati S, Gorbi S, Spadoni T, Lazzarini R, Regoli F, et al. Alterations of ROS pathways in scleroderma begin at stem cell level. J Biol Regul Homeost Agents 2013;27:211–24. [PubMed] [Google Scholar]
- 69. Bhattacharyya S, Wei J, Varga J. Understanding fibrosis in systemic sclerosis: shifting paradigms, emerging opportunities. Nat Rev Rheumatol 2011;8:42–54. [DOI] [PMC free article] [PubMed] [Google Scholar]
- 70. Lafyatis R. Transforming growth factor β at the centre of systemic sclerosis. Nat Rev Rheumatol 2014;10:706–19. [DOI] [PubMed] [Google Scholar]
- 71. Wynn TA. Cellular and molecular mechanisms of fibrosis. J Pathol 2008;214:199–210. [DOI] [PMC free article] [PubMed] [Google Scholar]
- 72. Rahimi RA, Andrianifahanana M, Wilkes MC, Edens M, Kottom TJ, Blenis J, et al. Distinct roles for mammalian target of rapamycin complexes in the fibroblast response to transforming growth factor‐β. Cancer Res 2009;69:84–93. [DOI] [PMC free article] [PubMed] [Google Scholar]
- 73. Yoshizaki A, Yanaba K, Yoshizaki A, Iwata Y, Komura K, Ogawa F, et al. Treatment with rapamycin prevents fibrosis in tight‐skin and bleomycin‐induced mouse models of systemic sclerosis. Arthritis Rheum 2010;62:2476–87. [DOI] [PubMed] [Google Scholar]
- 74. Rosato E, Borghese F, Pisarri S, Salsano F. The treatment with N‐acetylcysteine of Raynaud's phenomenon and ischemic ulcers therapy in sclerodermic patients: a prospective observational study of 50 patients. Clin Rheum 2009;28:1379–84. [DOI] [PubMed] [Google Scholar]
- 75. Rosato E, Rossi C, Molinaro I, Giovannetti A, Pisarri S, Salsano F. Long‐term N‐acetylcysteine therapy in systemic sclerosis interstitial lung disease: a retrospective study. Int J Immunopathol Pharmacol 2011;24:727–33. [DOI] [PubMed] [Google Scholar]
- 76. Hench PS, Kendall EC, Slocumb CH, Polley HF. Adrenocortical hormone in arthritis: preliminary report. Ann Rheum Dis 1949;8:97–104. [DOI] [PMC free article] [PubMed] [Google Scholar]
- 77. Lu Y, Liu H, Bi Y, Yang H, Li Y, Wang J, et al. Glucocorticoid receptor promotes the function of myeloid‐derived suppressor cells by suppressing HIF1α‐dependent glycolysis. Cell Mol Immunol 2017. E‐pub ahead of print. [DOI] [PMC free article] [PubMed] [Google Scholar]
- 78. Moreno‐Aurioles VR, Sobrino F. Glucocorticoids inhibit fructose 2,6‐bisphosphate synthesis in rat thymocytes: opposite effect of cycloheximide. Biochim Biophys Acta 1991;1091:96–100. [DOI] [PubMed] [Google Scholar]
- 79. Swerdlow S, McColl K, Rong Y, Lam M, Gupta A, Distelhorst CW. Apoptosis inhibition by Bcl‐2 gives way to autophagy in glucocorticoid‐treated lymphocytes. Autophagy 2008;4:612–20. [DOI] [PMC free article] [PubMed] [Google Scholar]
- 80. Beesley AH, Firth MJ, Ford J, Weller RE, Freitas JR, Perera KU, et al. Glucocorticoid resistance in T‐lineage acute lymphoblastic leukaemia is associated with a proliferative metabolism. Br J Cancer 2009;100:1926–36. [DOI] [PMC free article] [PubMed] [Google Scholar]
- 81. Poole B, Ohkuma S. Effect of weak bases on the intralysosomal pH in mouse peritoneal macrophages. J Cell Biol 1981;90:665–9. [DOI] [PMC free article] [PubMed] [Google Scholar]
- 82. Emilsson L, Wijmenga C, Murray JA, Ludvigsson JF. Autoimmune disease in first‐degree relatives and spouses of individuals with celiac disease. Clin Gastroenterol Hepatol 2015;13:1271–7. [DOI] [PubMed] [Google Scholar]
- 83. Opitz CA, Litzenburger UM, Sahm F, Ott M, Tritschler I, Trump S, et al. An endogenous tumour‐promoting ligand of the human aryl hydrocarbon receptor. Nature 2011;4788:197–203. [DOI] [PubMed] [Google Scholar]
- 84. Hamidullah, Kumar R, Saini KS, Kumar A, Kumar S, Ramakrishna E, et al. Quercetin‐6‐C‐β‐d‐glucopyranoside, natural analog of quercetin exhibits anti‐prostate cancer activity by inhibiting Akt‐mTOR pathway via aryl hydrocarbon receptor. Biochimie 2015;119:68–79. [DOI] [PubMed] [Google Scholar]
- 85. Oaks Z, Perl A. Metabolic control of the epigenome in systemic lupus erythematosus. Autoimmunity 2014;47:256–64. [DOI] [PMC free article] [PubMed] [Google Scholar]
Associated Data
This section collects any data citations, data availability statements, or supplementary materials included in this article.
Supplementary Materials
Supplementary Table 1
Supplementary Table 2
Supplementary Table 3