Abstract
Background
Historically, mRNA measurements have been tested on several commercially available platforms, but none have gained broad acceptance for assessment of HER2. An mRNA measurement, as a continuous value, has the potential for use in adjudication of the equivocal category. Here we use a real-time quantitative reverse transcription polymerase chain reaction (RT-qPCR) assay in a closed, single-use cartridge, automated system.
Methods
Multiple cores (1mm in diameter) were retrospectively collected from 80 formalin-fixed paraffin-embedded (FFPE) tissue blocks with invasive breast cancer seen by Yale Pathology Labs between 1998 and 2011. Tissue cores were processed with a FFPE lysis kit to create lysates that were tested with the automated RT-qPCR assay. Results for IHC and FISH were extracted from the pathology reports and quantitative immunofluorescence (QIF) for each case was measured as previously described.
Results
Quality control testing showed that the GX platform RT-qPCR shows no case to case cross contamination on material from routine histology practices. Concordance between RT-qPCR and IHC/FISH was 91.25% (sensitivity = 0.87; specificity = 0.94; PPV = 0.89; NPV = 0.92) using a pre-defined delta Ct cut-off (dCt ≥ −1) for HER2. Concordance (OPA) between RT-qPCR and QIF was 94% (sensitivity = 0.90; specificity = 0.96; PPV = 0.93; NPV = 0.94) using dCt ≥ −1 and a previously defined cut-point for positivity by QIF.
Conclusions
The closed system RT-qPCR assay shows greater than 90% concordance with the ASCO/CAP HER2 IHC/FISH scoring. Additionally, the RT-qPCR assay is highly concordant (94%) with the continuous variable HER2 QIF assay, and may better reflect the true continuum of HER2 receptor status in invasive breast cancer. These initial results suggest that fast, closed system molecular assays may have future value for the adjudication of the ASCO/CAP HER2 equivocal category or possibly routine usage in time constrained or low resource settings.
Keywords: breast cancer, immunofluorescence, fluorescence in situ hybridization, real-time quantitative reverse transcription polymerase chain reaction, HER2, ASCO/CAP guidelines (2007)
BACKGROUND
The human epidermal growth factor receptor 2 (HER2 or ERBB2) gene is amplified and/or over-expressed in approximately 15–20% of primary breast cancers. Measurement of the expression of this biomarker, either by protein-based methods (IHC) or fluorescence in situ hybridization (FISH), has become the standard of care companion diagnostic for trastuzumab, pertuzumab, and T-DM1 [1, 2]. The guidelines of the American Society of Clinical Oncology (ASCO), and the College of American Pathologists (CAP) recommend routine testing of HER2 expression on newly diagnosed breast cancers. However, 5–10% of primary breast tumors are designated equivocal for HER2 status using the current guidelines [3]. The equivocal HER2 test result creates uncertainty with respect to disease management. Thus, a number of groups are pursuing strategies to definitively discriminate equivocal results into those that will or will not respond to therapies targeting HER2.
Here we determine the correlation between a real-time quantitative reverse transcription polymerase chain reaction (RT-qPCR) assay (Xpert® Breast Cancer STRAT4 RUO Assay, Cepheid, Sunnyvale, CA, USA) for ERBB2 (HER2) mRNA performed on the GeneXpert® (GX) platform (Cepheid), and locally-determined HER2 immunohistochemistry (IHC)/fluorescence in situ hybridization (FISH) assessments, as well as quantitative immunofluorescence (QIF) in primary breast cancers.
METHODS
HER2 Standardization Tissue Microarray (YTMA-263)
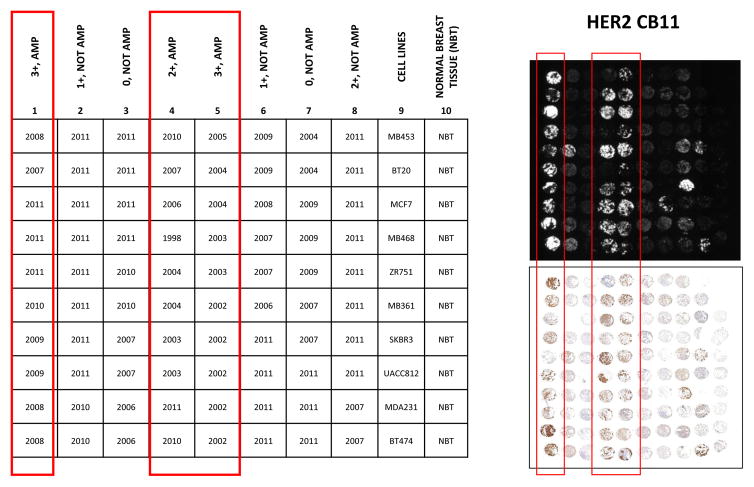
The HER2 standardization tissue microarray (TMA) (Figure 1) was built by extracting 0.6 mm cores from 80 formalin-fixed paraffin-embedded (FFPE) breast carcinomas seen by Yale Pathology between 1998 and 2011. The cases were selected by review of the H&E slide to be sure the tumor was greater than 1 cm in each dimension and then selected to represent the range of HER2 scores as shown in figure 1. TMA construction and patient characteristics have been described previously [4]. Results from CLIA-certified IHC and FISH assays consistent with the ASCO/CAP 2007 HER2 IHC/FISH scoring guidelines, were extracted from the pathology reports.
Figure 1. HER2 standardization tissue microarray (YTMA 263).
A tissue microarray was built and designed using 80 breast cancer cases with CLIA-certified immunohistochemistry (IHC) and fluorescence in situ hybridization (FISH) information, and non-tumor breast cancer tissue and breast cancer cell lines with known HER2 gene copy number. HER2 antibody assay for CB11 using QIF. AMP: amplified, NOT AMP: not amplified, AU = arbitrary units of fluorescence; QIF = quantitative immunofluorescence.
Antibodies, Quantitative Immunofluorescence and Immunohistochemistry
Fresh TMA cuts were de-paraffinized at 60°C for 20 minutes, then incubated twice in xylene for 20 minutes. Rehydration was performed using ethanol. Antigen retrieval was carried out as recommended by the manufacturers with citrate buffer pH 6.0 at 97°C for 20 minutes in a pressure-boiling container (Lab Vision, PT Module, Thermo Fisher Scientific, Waltham, MA, USA). Endogenous peroxidase activity was blocked with 2.5% hydroxyl peroxide in methanol for 30 minutes, followed by blocking with 0.3% bovine serum albumin in 0.1 mol/L of Tris-buffered saline for 30 minutes at room temperature. The commercially available primary mouse monoclonal anti-HER2 antibody (Biocare Medical, Concord, CA, USA: clone CB11) was used at previously optimized staining conditions at a concentration of 1:100. Slides were incubated overnight at 4°C with the primary antibody and with cytokeratin at 1:100 dilution (monoclonal mouse anti-human cytokeratin, clone AE1/AE3; polyclonal rabbit anti-cow cytokeratin, wide spectrum screening (Agilent Technologies, Santa Clara, California, USA)). Sections were incubated for one-hour at room temperature with Alexa 546-conjugated goat anti-rabbit secondary antibody (Thermo Fisher Scientific, Waltham, Massachusetts, USA) diluted 1:100 in mouse EnVision amplification reagent (Dako). Cyanine 5 (Cy5) directly conjugated to tyramide (Perkin-Elmer, Waltham, MA, USA) at 1:50 dilution was used for target antibody detection. ProLong mounting medium (ProLong Gold; Molecular Probes) with 4,6-diamidino-2-phenyl-indole (DAPI) was used to stain nuclei.
Fluorescence Measurement and Scoring
Quantification of the immunofluorescent staining was performed using the method of Automated Quantitative Analysis (AQUA) as previously reported [2, 5]. A series of monochromatic high-resolution images were captured using an epifluorescent microsope platform. For each TMA histospot, images were obtained for each fluorescent channel: DAPI (nuclei), Alexa 546 (cytokeratin), and Cy5 (HER2 target probe). In order to distinguish tumor from tissue stroma and other components, an epithelial tumor “mask” was created by dichotomizing the cytokeratin signal. Briefly, the QIF score of HER2 in the tumor compartment was calculated by dividing the HER2 compartment pixel intensities by the area of cytokeratin positivity resulting in a continuous score directly proportional to the concentration of the biomarker of interest. QIF scores were normalized to the exposure time and bit depth at which the images were captured, allowing scores collected at different exposure times to be comparable. All acquired histospots were visually evaluated and cases with staining artifacts or less than 2% tumor determined by cytokeratin staining were excluded from the analysis as has been done in previous studies using the AQUA method of QIF [6].
GeneXpert Instrument and Xpert Breast Cancer STRAT4 (RUO) Assay
The GX System consists of an instrument that automates the in-cartridge assay process, a barcode reader for scanning labels on GeneXpert cartridges, and a personal computer preloaded with software for running tests and viewing results. Single-use GeneXpert cartridges hold assay reagents and host the sample-preparation and PCR processes. Because the cartridges are self-contained, cross-contamination concerns are eliminated. The BC STRAT4 is designed as a multiplexed RT-qPCR assay incorporating primers and probes for the quantitative assessment of four target mRNAs – ESR1, PgR, ERBB2, and MKi67 – and one reference mRNA, CYFIP1. The reference mRNA verifies specimen adequacy and is used to normalize the mRNA expression levels of the target mRNAs. Additionally, the assay includes an internal Probe Check Control (PCC) and a Cepheid Internal Control (CIC) to guarantee proper functioning of cartridge reaction components. To run the assay, a lysate is prepared using an FFPE Lysis Kit (Cepheid). An aliquot of the lysate is added to the cartridge and the cartridge is placed into the GX instrument. Results are available approximately 75 minutes later.
Assay Procedure
In this experiment, multiple (2–4) 1.0 mm in diameter tumor cores of varying length from FFPE specimens were processed by mixing 5 μl Proteinase K with 260 μl FFPE lysis reagent (Cepheid) to de-crosslink and release nucleic acids from the tumor cells. After a 30-minute incubation at 80 C, 260 μl of 100% ethanol was added to the lysed sample, and the entire mixture was transferred to the test cartridge. The cartridge was inserted into a module of a GX Instrument where nucleic acid purification, amplification, and real-time detection was all fully automated and completely integrated by the system. All reagents required for sample preparation and RT-qPCR analysis are preloaded in the cartridge. Nucleic acids in the lysate are captured on a filter, washed, and eluted by sonication. The purified nucleic acid is mixed with dry RT-qPCR reagents, and the solution is transferred to the reaction tube for RT-qPCR and detection. The software automatically reviews the signal from both the CYFIP1 endogenous control and the HER2 transcript for acceptability, and calculates the difference in cycle threshold (Ct) between the 2 signals, yielding a delta Ct (dCt) result which is categorized as positive or negative for the target mRNA based on pre-defined dCt cutoffs. The entire test process is completed in less than 2 hours, including sample incubation with less than 10 minutes of hands-on time.
RESULTS
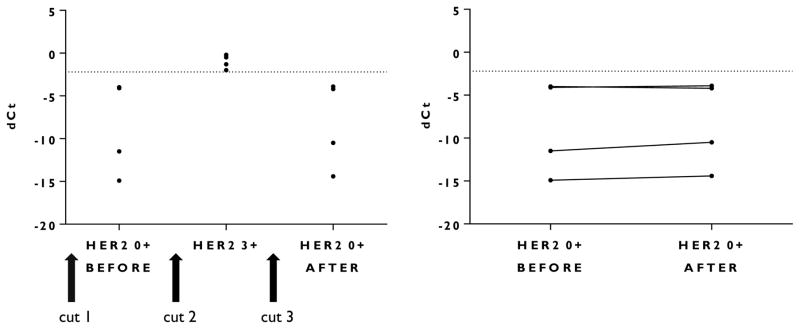
Quality control testing was done to determine whether sectioning of FFPE tissue blocks from HER2 positive cases prior to sectioning of HER2 negative cases would leave residual material on the microtome or in the water bath that could contaminate subsequent RT-qPCR assessment. To determine this, routine histotechnology techniques were compared to an RNase-free protocol for tissue section preparation. Routine techniques, in addition to not requiring any alteration to the daily histotechnology workflow used to prepare whole-tissue section glass slides from formalin-fixed paraffin embedded tissue blocks, included but were not limited to using the same microtome blade for different cases or until the blade was dull; floating the tissue ribbon on a communal tap-water bath; and placing the tissue sections on glass slides that were not RNase-free or otherwise prepared to be free of incidental nucleic acids.
The RNase-free protocol included carefully wiping the microtome blade with an alkali hydroxide solution (RNase Away) prior to sectioning the tissue block; changing the microtome blade between cases; and changing the tap-water bath between floated sections. We showed that the GX platform shows no detectable case to case cross contamination on material from routine histology practices (Figure 2).
Figure 2. Absence of contamination of subsequent whole-tissue sections during routine tissue processing when IHC/FISH negative blocks are prepared after cases positive by IHC (3+).
The same microtome blade was used to prepare each whole-tissue section.
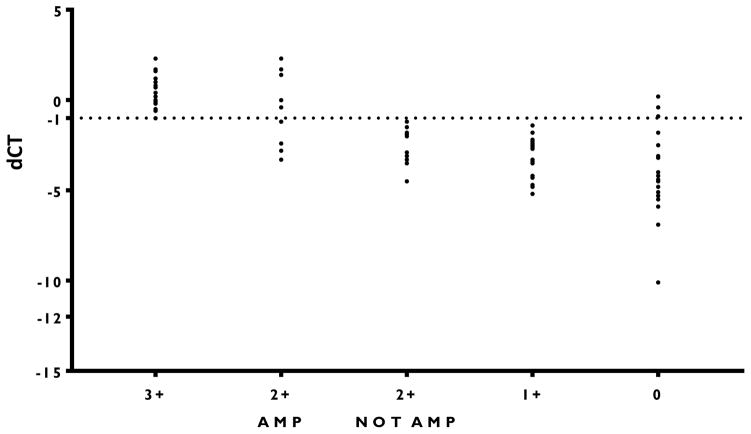
To assess concordance between the BC STRAT4 and IHC and FISH technologies we used a cohort of 80 formalin-fixed paraffin-embedded invasive breast carcinomas seen at Yale Pathology between 1998 and 2011. For each case, we measured mRNA by BC STRAT4 and compared that to clinical assessment by IHC/FISH and to QIF. The distribution of BC STRAT4 dCt scores showed good agreement with the clinical IHC/FISH results from each case (figure 3). Concordance (OPA) between BC STRAT4 and IHC/FISH was 91.25% (sensitivity = 0.87; specificity = 0.94; PPV = 0.89; NPV = 0.92) using a pre-defined delta Ct cut-off (dCt ≥ −1) for HER2-positivity based on prior concordance studies (Wu N, et al, manuscript in preparation) with HER2 (Table 1).
Figure 3. Comparison between pathologist determined IHC/FISH and mRNA quantification of HER2 (delta Ct).
The cases determined to be 3+ by IHC, and 2+ by IHC, confirmed by FISH consistently have higher delta Ct.
Table 1.
Concordance between mRNA quantification and IHC/FISH.
| IHC/FISH positive* | IHC/FISH negative | total | |
|---|---|---|---|
| dCt ≥−1 | 26 | 3 | 29 |
| dCt < −1 | 4 | 47 | 51 |
| total | 30 | 50 | 80 |
IHC/FISH defined as positive if clinically IHC =3+ or IHC 2+ and FISH amplified. IHC/FISH defined as negative if clinically IHC=0 or 1+ or IHC=2+ but FISH not amplified using ASCO/CAP 2007 guidelines.
Abbreviations: IHC = Immunohistochemistry, FISH= Fluorescence In Situ Hybridization, dCt = delta ct or difference in cycle threshold (see methods section)
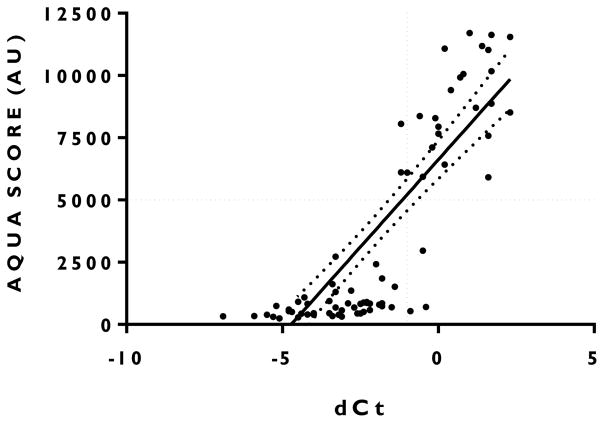
Since QIF does not have a 4-point ordinal scoring system like IHC, definitive cut-points for comparison are less well established. To compensate for this, we chose a stringent cut-point that would increase specificity at the expense of sensitivity. The cut-point separating HER2 overexpression and HER2 normal cases was determined to be 5000 Aqua Units (AU) using the CB11 antibody at a 1:100 dilution (Figure 4). Using this AU cut-point, concordance between BC STRAT4 (using the pre-defined cutoff of dCt ≥ −1) and QIF was 94% (sensitivity = 0.90; specificity = 0.96; PPV =0.93; NPV = 0.94) (Table 2).
Figure 4. Correlation between mRNA quantification of HER2 (delta Ct) and QIF protein measurement (AQUA SCORE).
R-square = 0.63
Table 2.
Concordance between mRNA quantification by GeneXpert and QIF.
| dCt ≥ −1 | dCt < −1 | total | |
|---|---|---|---|
| < 5000 AU | 26 | 2 | 28 |
| >5000 AU | 3 | 49 | 52 |
| total | 29 | 51 | 80 |
AU=AQUA score
DISCUSSION
The current practice for determining HER2 receptor status in breast cancer by either IHC or FISH does not unequivocally define receptor expression. For IHC this may be due to its semi-quantitative nature and non-standardized methods. FISH is thought by some to provide a more accurate assessment for HER2 status [7, 8] since a chromosome count can be done, but the weakness of this method is that it does not necessarily reflect target protein expression [9, 10] and counting FISH spots is tedious and biased by tumor heterogeneity [11]. Historically, slide-based measurements of mRNA have been tested, including using several commercially available platforms [12–14], but have not gained broad acceptance for assessment of HER2. However, RNA measurement, as a continuous value, has the potential for more accurate assessment of receptor expression, including adjudication of the equivocal category.
In the current analysis, our data demonstrate that the BC STRAT4 closed-system RT-qPCR assay shows greater than 90% concordance with ASCO/CAP 2007 HER2 IHC/FISH scoring. A significant weakness of this approach is that the 2007 system is no longer in practice and we now use the revised system established in 2013 [1]. Since the tissue used for this study was obtained from specimens prior to 2013, the results from the older scoring system were retained. Future studies are underway that include recent tissue samples.
Previous studies by our group have suggested that QIF measurements of HER2 may be more analytically accurate than the IHC standard of care [4]. However, since it is no longer acceptable to generate data from patients randomized to a placebo instead of trastuzumab, assessing clinical accuracy is challenging (the statistically rigorous interaction score cannot be calculated without a “no treatment” arm). Fortuitously, robust quantitative methods are available to assess analytic accuracy, within the limitations of non-randomized outcomes. Since the BC STRAT4 method has quantitative potential, we compared it to QIF, which has also been shown to be quantitative [15]. It is notable that comparison of these two quantitative tests shows high concordance (94%), which may reflect the true biological continuum of HER2 receptor status in invasive breast cancer. These initial results suggest that rapid, closed-system molecular assays may have a future value in resolving HER2 ASCO/CAP guideline-determined equivocal cases. In addition, the observed high concordance between the BC STRAT4 assay compared with QIF, as well as conventional methods for assessing HER2 status, suggests that an analytically validated but easy to use RT-qPCR test may provide a reasonable solution for HER2 testing in resource limited settings where conventional tests, such as IHC and FISH, are not available. Future efforts with this assay will benefit from being tested in settings with known response to HER2-targeted therapies.
CONCLUSIONS
In summary, we compared a closed-system RT-qPCR assay (BC STRAT4) to conventional methods (IHC and FISH) and QIF for assessing HER2 status in breast cancer. We found a high level of concordance between BC STRAT4 and the other methods. These results suggest that, with further study, this platform could have utility in clinical settings including both for adjudication of equivocal cases and for routine use in low resource settings.
Supplementary Material
Acknowledgments
The authors gratefully acknowledge Lori Charette and the team at the Yale Pathology Tissue Service for production of the high-quality tissue microarrays used in this study. This study was supported by a sponsored research agreement from Cepheid to Dr. Rimm. Additional support was provided by The Breast Cancer Research Foundation, and the Yale Cancer Center.
Abbreviations
- AU
AQUA UNITS
- FFPE
formalin-fixed paraffin-embedded
- HER2
human epidermal growth factor receptor 2
- IHC
immunohistochemistry
- FISH
fluorescence in situ hybridization
- QIF
quantitative immunofluorescence
- RT-qPCR
quantitative reverse transcription polymerase chain reaction
- TMA
tissue microarray
Footnotes
Competing Interests:
Within the last 12 months, DLR has served as a paid consultant or advisor to Astra Zeneca, Bethyl, BMS, Biocept, Merck, Perkin Elmer, Cell Signaling Technology and Ultivue. Kenneth Ho, Wendy Wong, Natalie Wu, Victor C. Chu, Edwin W. Lai, Jodi M. Weidler and Michael Bates are employees of Cepheid.
Author’s contributions:
BW carried out the immunofluorescence staining and analysis of data and drafted the manuscript, in addition to tissue and pathology review. VN made substantial contributions to the analysis and interpretation of data, and helped revise the manuscript. DC provided tissue and pathology review and helped revise the manuscript. KH, NW, VCC, WW, JW and EWL provided technical assistance, aided in analysis and interpretation of data, and helped revise the manuscript. MB designed the study, made substantial contributions to the analysis and interpretation of data, helped revise the manuscript, and provided financial support to carry out the study. DR conceived and designed the study, revised the final version of the manuscript for submission, and provided finances and resources to carry out the study. All authors have read and approved the final version of the manuscript.
References
- 1.Wolff AC, et al. Recommendations for Human Epidermal Growth Factor Receptor 2 Testing in Breast Cancer: American Society of Clinical Oncology/College of American Pathologists Clinical Practice Guideline Update. Archives of Pathology & Laboratory Medicine. 2014;138(2):241–256. doi: 10.5858/arpa.2013-0953-SA. [DOI] [PMC free article] [PubMed] [Google Scholar]
- 2.Camp RL, Chung GG, Rimm DL. Automated subcellular localization and quantification of protein expression in tissue microarrays. Nat Med. 2002;8(11):1323–7. doi: 10.1038/nm791. [DOI] [PubMed] [Google Scholar]
- 3.Press MF, et al. Assessing the New American Society of Clinical Oncology/College of American Pathologists Guidelines for HER2 Testing by Fluorescence In Situ Hybridization: Experience of an Academic Consultation Practice. Archives of Pathology & Laboratory Medicine. 2016;140(11):1250–1258. doi: 10.5858/arpa.2016-0009-OA. [DOI] [PMC free article] [PubMed] [Google Scholar]
- 4.Carvajal-Hausdorf DE, et al. Measurement of Domain-Specific HER2 (ERBB2) Expression May Classify Benefit From Trastuzumab in Breast Cancer. Journal of the National Cancer Institute. 2015;107(8) doi: 10.1093/jnci/djv136. [DOI] [PMC free article] [PubMed] [Google Scholar]
- 5.Carvajal-Hausdorf DE, et al. Quantitative measurement of cancer tissue biomarkers in the lab and in the clinic. Lab Invest. 2015;95(4):385–396. doi: 10.1038/labinvest.2014.157. [DOI] [PMC free article] [PubMed] [Google Scholar]
- 6.Neumeister VM, et al. Quantitative Assessment of Effect of Preanalytic Cold Ischemic Time on Protein Expression in Breast Cancer Tissues. Journal of the National Cancer Institute. 2012;104(23):1815–1824. doi: 10.1093/jnci/djs438. [DOI] [PMC free article] [PubMed] [Google Scholar]
- 7.Press MF, et al. Evaluation of HER-2/neu gene amplification and overexpression: comparison of frequently used assay methods in a molecularly characterized cohort of breast cancer specimens. J Clin Oncol. 2002;20(14):3095–105. doi: 10.1200/JCO.2002.09.094. [DOI] [PubMed] [Google Scholar]
- 8.Hanna WM, et al. HER2 in situ hybridization in breast cancer: clinical implications of polysomy 17 and genetic heterogeneity. Mod Pathol. 2014;27(1):4–18. doi: 10.1038/modpathol.2013.103. [DOI] [PubMed] [Google Scholar]
- 9.Bahreini F, Soltanian AR, Mehdipour P. A meta-analysis on concordance between immunohistochemistry (IHC) and fluorescence in situ hybridization (FISH) to detect HER2 gene overexpression in breast cancer. Breast Cancer. 2015;22(6):615–625. doi: 10.1007/s12282-014-0528-0. [DOI] [PubMed] [Google Scholar]
- 10.Wolff AC, et al. American Society of Clinical Oncology/College of American Pathologists Guideline Recommendations for Human Epidermal Growth Factor Receptor 2 Testing in Breast Cancer. Archives of Pathology & Laboratory Medicine. 2007;131(1):18–43. doi: 10.5858/2007-131-18-ASOCCO. [DOI] [PubMed] [Google Scholar]
- 11.Qian XL, et al. Assessment of dual-probe Her-2 fluorescent in situ hybridization in breast cancer by the 2013 ASCO/CAP guidelines produces more equivocal results than that by the 2007 ASCO/CAP guidelines. Breast Cancer Research and Treatment. 2016;159(1):31–39. doi: 10.1007/s10549-016-3917-6. [DOI] [PMC free article] [PubMed] [Google Scholar]
- 12.Park MM, et al. ER and PR Immunohistochemistry and HER2 FISH versus Oncotype DX: Implications for Breast Cancer Treatment. The Breast Journal. 2014;20(1):37–45. doi: 10.1111/tbj.12223. [DOI] [PubMed] [Google Scholar]
- 13.Duffy MJ, et al. Chapter One - Biomarkers in Breast Cancer: Where Are We and Where Are We Going? In: Gregory SM, editor. Advances in Clinical Chemistry. Elsevier; 2015. pp. 1–23. [DOI] [PubMed] [Google Scholar]
- 14.Hagemann Ian S. Molecular Testing in Breast Cancer: A Guide to Current Practices. Archives of Pathology & Laboratory Medicine. 2016;140(8):815–824. doi: 10.5858/arpa.2016-0051-RA. [DOI] [PubMed] [Google Scholar]
- 15.McCabe A, et al. Automated Quantitative Analysis (AQUA) of In Situ Protein Expression, Antibody Concentration, and Prognosis. Journal of the National Cancer Institute. 2005;97(24):1808–1815. doi: 10.1093/jnci/dji427. [DOI] [PubMed] [Google Scholar]
Associated Data
This section collects any data citations, data availability statements, or supplementary materials included in this article.


