

Summary
SCF (Skp1-Cullin-F-box) ubiquitin ligases comprise several dozen modular enzymes that have diverse roles in biological regulation. SCF enzymes share a common catalytic core containing Cul1•Rbx1, which is directed towards different substrates by a variable substrate receptor (SR) module comprising one of 69 F-box proteins bound to Skp1. Despite the broad cellular impact of SCF enzymes, important questions remain about the architecture and regulation of the SCF repertoire, including whether SRs compete for Cul1, and if so, how this competition is managed. Here, we devise methods that preserve the in vivo assemblages of SCF complexes, and apply quantitative mass spectrometry to perform a census of these complexes (the ‘SCFome’) in various states. We show that Nedd8 conjugation and the SR exchange factor Cand1 have a profound effect on shaping the SCFome. Together, these factors enable rapid remodeling of SCF complexes to promote biased assembly of SR modules bound to substrate.
ETOC
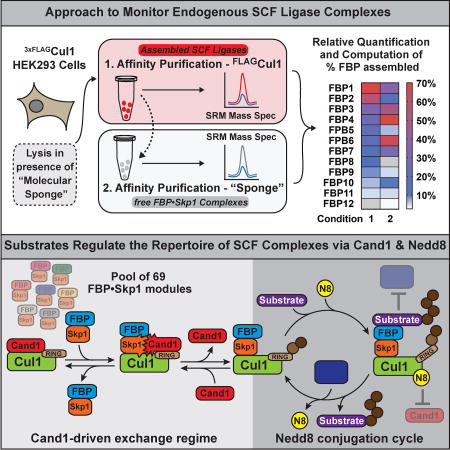
A cell’s repertoire of SCF ubiquitin ligases, which target proteins for degradation, is directly shaped by the substrates present.
Introduction
Regulation of protein stability and function by the ubiquitin-proteasome system (UPS) influences diverse aspects of eukaryotic biology. The ubiquitylation cascade involves three enzymes – E1, E2, and E3 – that work successively to attach ubiquitin to substrate proteins, which results in altered protein function or proteasomal degradation (Dye and Schulman, 2007; Husnjak and Dikic, 2012). Substrate specificity is conferred by E3 ubiquitin ligases, of which the SCF family of cullin–RING ubiquitin ligases (CRLs) is among the most intensively studied (Deshaies and Joazeiro, 2009; Skaar et al., 2013).
Each SCF comprises a Cul1•Rbx1 catalytic core bound to a variable F-box protein (FBP)•Skp1 substrate recognition (SR) module (Feldman et al., 1997; Kamura et al., 1999; Ohta et al., 1999; Seol et al., 1999; Skowyra et al., 1997). The human genome encodes ≥69 FBPs, alluding to the possibility of 69 distinct SCFs, though only 42 are confirmed and most of these complexes remain uncharacterized (Jin et al., 2004; Lee et al., 2011). Due to their substrate specificity, SCF ligases represent promising targets for therapeutic manipulation. Gain or loss of function of specific SCFs is directly implicated in tumorigenesis and other diseases (Nakayama and Nakayama, 2006; Skaar et al., 2014).
The cumulative functional output and physiological impact of all SCFs at any given time is presumably determined by the extant repertoire of SCFs. This repertoire can change dramatically as cells differentiate, as shown for CRL3 complexes (Werner et al., 2015). Therefore, a key unanswered question is, what mechanism(s) sculpts the repertoire of SCF and other CRLs? The prevailing model, which is based on biochemical studies, predicts that SR modules bind tightly to Cul1, but their interaction is rendered dynamic by Cand1, which is an SR exchange factor (SREF) that equilibrates Cul1 with the cellular pool of SR modules (Pierce et al., 2013; Wu et al., 2013; Zemla et al., 2013). This exchange is controlled by Nedd8 conjugation: when substrate is bound to SCF, preservation of Nedd8 modification on Cul1 stimulates substrate ubiquitination and blocks Cand1 from dislodging the SR module. When substrate dissociates, Nedd8 is removed by isopeptidase Cop9-Signalosome (CSN), allowing Cand1 to catalyze exchange of the SR module (Bornstein et al., 2006; Cavadini et al., 2016; Emberley et al., 2012; Enchev et al., 2012; Fischer et al., 2011; Pierce et al., 2013; Schmidt et al., 2009; Zemla et al., 2013). This model predicts that substrate availability governs the cellular landscape of SCF enzymes.
This model, though attractive, is based primarily on in vitro biochemical studies with a few FBPs (Pierce et al., 2013). Moreover, blocking Nedd8 conjugation has no effect on SCF assembly, suggesting either that SCF ubiquitin ligases are not undergoing cycles of dynamic assembly/disassembly in cells or there exist alternative mechanisms that regulate dynamics in vivo (Bennett et al., 2010; Lee et al., 2011). Meanwhile, Cand1 depletion yields conflicting results, with some studies reporting no effect (Bennett et al., 2010) and others reporting a change in the SCF repertoire (Pierce et al., 2013; Wu et al., 2013). However, we demonstrate here that prior analyses of cellular SCF complexes were confounded by rapid exchange of SR modules during immunoprecipitation from cell lysate, and this would affect prior results and their interpretation in ways that are difficult to predict. Here, we developed a multiplex affinity purification-selected reaction monitoring (SRM) platform to query the assembly state of SR modules in human cells. By suppressing exchange, we show that the cellular SCF repertoire is in a state of disequilibrium that is sustained by Nedd8 conjugation and Cand proteins, and is modulated by substrate availability.
Results
Post-cell lysis equilibration of SCF complexes is extremely rapid
Based on our finding that Cand1 is a potent SREF (Pierce et al., 2013), we investigated whether Cand1 might mediate exchange of SR modules in cell lysate during a conventional immunoprecipitation. To evaluate this, we developed a SILAC-based SRM exchange assay that enabled us to monitor the levels of all SCF regulators and subunits (Table S1A). In parallel, we used CRISPR technology to engineer HEK293 cells such that endogenous Cul1 was tagged with 3XFLAG at its N-terminus (Fig. S1A–D). Insertion of the 3xFLAG tag did not affect cell proliferation or steady-state levels of cyclin E, an SCFFBXW7 substrate (Fig. S1D–E) (Koepp et al., 2001; Strohmaier et al., 2001). The rationale for developing this cell line is that it enabled rapid and efficient immunodepletion of Cul1 (Fig. S1F) while avoiding artifacts that are inherent to overexpression of scaffold proteins (Gibson et al., 2013). To evaluate exchange in cell lysate, we mixed isotopically light-labeled HEK2933xFLAG-Cul1 cells 1:1 with heavy-labeled untagged HEK293 cells, lysed the cells in native lysis buffer that blocks the Nedd8 cycle (Fig. S1G) and allows complete extraction of 3xFLAGCul1 into the soluble fraction (Fig. S1H), immunoprecipitated 3xFLAGCul1, and measured the H:L ratio of co-precipitating factors (Fig. 1A). We observed pervasive equilibration of FBPs, Skp1, Cand1, and CSN during immunoprecipitation, whereas essentially no exchange was observed for Cul1•Rbx1 (Figs. 1B–C, S2A–C; Table S2A). Although exchange increased over time, it was substantial even in 10’ immunoprecipitations. We surmised that this robust equilibration was due to Cand1. Because Nedd8 shields Cul1 from Cand1-mediated exchange (Pierce et al., 2013), blocking Nedd8 conjugation should increase FBP exchange. To test this idea, HEK2933xFLAG-Cul1 cells were pretreated with the Nedd8 activating enzyme (NAE) inhibitor, MLN4924 (Fig. S1I) (Brownell et al., 2010; Soucy et al., 2009) and subjected to SILAC-SRM analysis. MLN4924 exacerbated exchange for all FBPs (Figs. 1B, S2A–C) but had a much greater effect on some FBPs than others (e.g. FBXO11 vs. FBXO7), indicating that the wide variation in FBP exchange was due in part to differential neddylation of the respective SCF complexes (Fig. S2D). Indeed, the FBPs most refractory to exchange (FBXO9 and FBXO11) exhibited near-median exchange upon MLN4924 treatment (Figs. 1B–C, S2A–C).
Fig. 1. Post-cell lysis exchange of FBPs is rapid and modulated by neddylation.

(A) SILAC-SRM method used to measure percent exchange of FBPs in cell lysate. Cells were lysed in the presence of oPT and MLN4924 to inhibit Nedd8 deconjugation and conjugation, respectively. Percent exchange was determined based on the ratio of heavy to light protein that co-precipitated with 3xFLAGCul1, whereby a ratio of 1 indicates 100% exchange. IP: immunoprecipitation. (B) Time-dependent exchange of FBPs in cell lysate. When present, MLN4924 was added 30 minutes prior to lysis and IP. The red line represents the median % exchange. Slow (FBXO11 and FBXO9) and fast (Skp2 and FBXO31) exchangers are colored. (C) Average post-cell lysis exchange of core SCF subunits and representative FBPs. Each measurement in (B) and (C) is the average of 4 biological replicates, with ± SEM shown in (C). Statistically significant changes are presented in Table S2A
To further explore the idea that SREF activity mediates FBP exchange, we used CRISPR technology to knockout both Cand1 and its paralog Cand2 in HEK2933xFLAG-Cul1 cells to generate tagged double-knockout (DKO) cells (Fig. S1C–E) and subjected these cells to our SILAC-SRM exchange assay (Fig. 2A). In the absence of Cand1/2, exchange in cell lysate was significantly suppressed for Skp1 and all FBPs, except FBXO5/Emi1 (Figs. 2B–C, S2E–G; Table S2B). Exchange was restored back to DKO lysate upon mixing with untagged wild type (Wt) lysate. Moreover, spiking recombinant Cand1 (rCand1) into DKO lysate displaced Skp1 and FBPs from endogenous Cul1 (Fig. 2D). These data demonstrate that Cand1/2-dependent post-lysis exchange has a major but previously unappreciated effect on SCF and probably other CRLs.
Fig. 2. Post-lysis exchange of FBPs is mediated by Cand1/2.

(A) SILAC SRM protocol used to measure the effect of Cand1/2 knockout on exchange in cell lysate. In each experiment, cells were mixed 1:1 prior to cell lysis and IP. (B) Cand1/2 mediates exchange in cell lysate. Cells of indicated genotype were processed as described in (A). FBXO5/EMI1 is highlighted by green dots. Red bars indicated the median exchange and differences were considered significant at p≤0.05 (*). (C) Average exchange of core SCF subunits and representative FBPs. Data in (B) and (C) represent the average of 3 biological replicates (mean ± SEM; p≤0.05 (*)). Statistically significant changes are presented in Table S2B. (D) Spiking DKO cell lysate with increasing concentrations of rCand1 results in loss of Skp1 and FBP assembly with Cul1. DKO cells were lysed in the presence of rCand1 at 1x or 2x endogenous levels followed by IP of 3xFLAGCul1 and Western blot analysis.
Post-lysis exchange of FBPs is suppressed by addition of a molecular sponge
To investigate the repertoire of cellular SCFs and how it changes in response to environmental or genetic perturbations, it was essential to suppress exchange in cell lysate. Our prior work established that binary SR•Cul1 and Cul1•Cand1 complexes are exceptionally stable, whereas ternary SR•Cul1•Cand1 complexes dissociate ~106 fold more rapidly (Pierce et al., 2013). We hypothesized that a large excess of recombinant Cul1•GSTRbx1 (rCul1GSTRbx1) added to lysis buffer prior to cell lysis would function like a molecular sponge and soak up free Cand1/2 and any SR module not bound to Cul1 to form stable binary complexes, and thus prevent endogenous Cul1 from forming metastable ternary complexes in lysate that underlie exchange (Fig. 3A). Indeed, this was the case. By performing a 20’ immunoprecipitation in the presence of rCul1GSTRbx1 (Fig. S3A), exchange of Skp1, Cand1, and all FBPs, except FBXO5/Emi1 was greatly curbed (Figs. 3B–C, S3B–D; Table S2C). Importantly, we also show that excess rCul1GSTRbx1 suppresses the ability of endogenous Cul1 to form new SCF complexes in the lysate (Fig. S3E).
Fig. 3. Post-lysis exchange of FBPs is suppressed by addition of excess rCul1•Rbx1.

(A) Scheme used to limit FBP exchange in cell lysate. The excess Cul1•GSTRbx1 should titrate Cand1/2 and thereby suppress their exchange activity. (B) Addition of excess rCul1GSTRbx1 suppresses post-lysis FBP exchange. rCul1GSTRbx1 was added to IP lysis buffer at 100x endogenous Cul1 levels. Cells were processed according to Fig. 1A and IP was for 20’. FBXO5/EMI1 is highlighted by green dots. Red bars indicate median exchange and differences were considered significant at p≤0.05 (*). (C) rCul1GSTRbx1 suppresses post-lysis exchange of Cand1, Skp1, and representative FBPs, but not the CSN complex. Data in (B) and (C) represent the average of 3 biological replicates (mean ± SEM; p≤0.05 (*)). Statistically significant changes are presented in Table S2C.
A potential concern of adding a large bolus of rCul1GSTRbx1 to cell lysate is that it would compete off SRs and Cand1 that were bound to endogenous 3xFLAGCul1. To address this issue, we immunoprecipitated 3xFLAGCul1 from Wt cell lysate in the presence or absence of rCul1GSTRbx1. Contrary to conventional expectation, rCul1GSTRbx1 increased the yield of Skp1, Skp2, and FBXO7 bound to endogenous 3xFLAGCul1, whereas recovery of Cand1 was modestly decreased (Fig. S3F). We also evaluated this concern by SRM analysis of 3xFLAGCul1 immunoprecipitates from DKO cells to monitor assembly of all FBPs in the absence of Cand1/2-mediated exchange. Excess rCul1GSTRbx1 sequestered only CSN from endogenous 3xFLAGCul1 (Fig. S3G–H), which is consistent with the fast koff of CSN from Cul1 (Mosadeghi et al., 2016). This result was also confirmed by IP/Western blot in the presence of MLN4924, which removes any influence of neddylation (Fig. S3I). Thus, addition of rCul1GSTRbx1 preserves the in vivo cellular landscape of SCF ligases by titrating out Cand1/2 and thereby preventing SR exchange. This result also suggests that the FBXW7•Skp1 studied previously (Pierce et al., 2013) is not unusual in terms of its interaction with Cul1•Rbx1, and that the koff of SR modules from SCF in the absence of Cand1 is very slow for all FBPs.
Analysis of endogenous Cul1 in the absence of exchange is necessary to observe regulation of the SCF landscape
Extensive exchange of SR modules during the course of a Cul1 immunoprecipitation has major implications for measuring dynamic changes in the SCF network. Any non-equilibrium state that existed in vivo may be lost during immunoprecipitation. Biochemical analyses of purified proteins predict that inhibiting Cul1 neddylation should promote net disassembly of SR modules from Cul1 because Nedd8 conjugation blocks Cand1 from binding Cul1 (Pierce et al., 2013). Conversely, depletion of Cand1 should favor assembly of SRs with Cul1. Paradoxically, prior studies concluded that inhibition of NAE had no significant impact on the cellular landscape of SCF ligases (Bennett et al., 2010; Lee et al., 2011). On the other hand, conflicting results were reported for depletion of Cand1 (Bennett et al., 2010; Pierce et al., 2013; Wu et al., 2013). However, these studies were performed with lysates that contained Cand1, and thus they may have been monitoring SCF complexes formed in cell lysate during immunoprecipitation. Since we could now limit post-lysis exchange with rCul1GSTRbx1, we re-examined whether MLN4924 treatment promoted net disassembly of SCF complexes. The Cul1 assembly states of Skp2 and βTrCP were monitored as surrogates for fast and slow exchanging FBPs, respectively (Fig. 1C). MLN4924 treatment strongly decreased assembly of Skp2, βTrCP, and Skp1 with 3xFLAGCul1 when the lysis buffer contained rCul1GSTRbx1 (Fig. 4A). By contrast, MLN4924 had less or no effect on FBP assembly with Cul1 when immunoprecipitations were carried out for 3 h in the absence of rCul1GSTRbx1.
Fig. 4. Post-lysis FBP exchange and Cul1 overexpression obscure regulation of SCF assembly by Nedd8 conjugation.

(A) The effect of MLN4924 is largely eliminated upon IP under standard conditions. HEK2933xFLAG-Cul1 cells were pretreated ± 1µM MLN4924. Cells were lysed in the presence or absence of rCul1GSTRbx1 and subjected to IP with anti-FLAG for 20’ or 180’, as indicated. Fast (Skp2) and slow (βTrCP2) exchanging FBPs (Fig. S2A–C) were monitored by Western blot of the IPs. S.E.: short exposure. (B) Overexpression (O.E.) of Cul1 abolishes the effect of MLN4924. HEK293 Flp-in 3xFLAG-Cul1 were pretreated with tetracycline to induce 3xFLAG-Cul1 expression. HEK2933xFLAG-Cul1 and HEK293 Flp-in 3xFLAG-Cul1 were then pretreated with MLN4924 and processed as described above. L.E.: long exposure. Endo: endogenous.
Another limitation of prior studies is that the human SCF repertoire was studied by stably integrating an additional copy of tagged Cul1. Overexpression of scaffold proteins is known to create potential artifacts (Gibson et al., 2013). To investigate whether extra Cul1 blunts the effect of MLN4924 treatment, we constructed a Flp-In cell line in which 3xFLAGCul1 expression was approximately 5-fold above endogenous Cul1 levels (Fig. 4B). Indeed, transgenic 3xFLAGCul1 completely abolished the effect of MLN4924 (Fig. 4B). This can be understood in light of the fact that endogenous levels of Skp1 are in modest excess over Cul1 (Fig. S5A and (Bennett et al., 2010)). These data demonstrate that analyzing endogenous Cul1 under conditions where FBP exchange is suppressed is necessary to observe proper regulation of SCF assembly.
Nedd8 conjugation and Cand1/2-mediated exchange sustain a non-equilibrium pool of SCF ubiquitin ligases
Using the methods described above, we set out to examine the effect of perturbing Cand1/2 activity and Nedd8 conjugation on the cellular SCF repertoire. Specifically, we sought to measure the percent of every SR module that is bound to Cul1. However, this required us to quantify SRs that were not bound to Cul1. Preliminary studies on the flow-through from a 3xFLAGCul1 immunoprecipitation revealed that only 6 FBPs could be reliably detected via SRM (data not shown). However, we hypothesized that the rCul1GSTRbx1 that was added to suppress exchange would sequester all free SR modules and other Cul1-binding proteins and that recovery of rCul1GSTRbx1 after 3xFLAGCul1 immunoprecipitation would enrich for these proteins sufficiently to allow their detection by SRM. Indeed, Western blot analysis (Fig. S3J) revealed that pull-down of rCul1GSTRbx1 depleted all Skp1 and Cand1 and about half of the CSN5 that was in the flow-through of the 3xFLAGCul1 immunoprecipitation. The remaining CSN5 might be bound to other CRL complexes. Because all FBPs are presumed bound to Skp1 (with perhaps one or two exceptions; (Reiterer et al., 2017; Yen et al., 2012)), complete depletion of Skp1 implied that all assembly-competent FBPs not bound to endogenous 3xFLAGCul1 were retrieved by rCul1GSTRbx1. These results indicate that, with the exception of CSN, we could accurately determine the percentages of all Cul1-binding proteins that were associated with Cul1 in cells by assessing their relative amounts in the 3xFLAGCul1 and rCul1GSTRbx1 pull-downs.
Application of our quantification methodology to determine the assembly state of FBPs in unperturbed HEK2933xFLAG-Cul1 cells revealed two striking and unexpected observations. First, FBPs exhibited remarkable range (0–70%) in their percent association with 3xFLAGCul1. This dramatic variation suggested that FBPs were not in equilibrium with 3xFLAGCul1 (Figs. 5A, S4A–C; Table S2D), hinting at the existence of cellular mechanisms to sustain a non-equilibrium pool of SCFs. Second, most FBPs exhibited inefficient association with endogenous 3xFLAGCul1. Of those FBPs that were quantified, only 1/5 exhibited greater than 30% binding to 3xFLAGCul1, and more than 1/4 (27%) showed no detectable association (Figs. 5A, S4A–C). This was consistent with Skp1 being present in 4-fold molar excess of Cul1 (Fig. S5A). Thus, despite the prevailing assumption that FBPs are assembled into SCF complexes, with the exception of FBXO11 and FBXL14 more than half of the molecules of all 47 other quantified FBPs were not bound to 3xFLAGCul1 in HEK2933xFLAG-Cul1 cells. The third major conclusion from this experiment is that nearly 30% of all known FBPs were not detected in either the 3xFLAGCul1 or rCul1GSTRbx1 pull-downs, suggesting they were either poorly expressed or were not competent to bind Cul1. Consistent with this observation, several of these FBPs are tissue-restricted (Ye et al., 2007), expressed early during development (Okita et al., 2007), or dependent on small molecules for stability (Salahudeen et al., 2009).
Fig. 5. Nedd8 conjugation and Cand1/2-mediated exchange sustain a non-equilibrium population of SCF ubiquitin ligases.

(A) Heat map showing the percent binding of each FBP to Cul1. Wt and DKO HEK293 (3xFLAGCul1) cells were treated ± 1µM MLN4924 for 30’ prior to lysis in the presence of excess rCu1•GSTRbx1. FBPs bound to endogenous Cul1 and those captured by recovering rCul1GSTRbx1 were monitored by SRM. The heat map is sorted relative to Wt-untreated from 70 (red) to 0% bound (white). FBPs not detected (ND) in either sample are shaded grey. Data represents the average of 4 biological replicates. Statistically significant changes are presented in Table S2D. (B) Percent of Cul1 occupied by Skp1, Cand1, and Cand2. Cellular concentrations were determined by SRM (Fig. S5A–B) and percent of Cul1 was then derived from the percent that each protein assembles with Cul1. Data represent the mean of 2 biological replicates. (C) Heat map showing the cellular levels of individual SCF ligases. FBP concentrations in Wt and DKO cell lysate were determined by SRM (Fig. S5B) and the percent of Cul1 bound to each was determined as described above. Percent of SCF ligases was determined by summing the percent of Cul1 bound by the FBPs, and then dividing by the percent of Cul1 that is assembled with Skp1 (Fig. 5B). Data represent the mean of 2 biological replicates.
Now that we had successfully defined the assembly status of all FBPs in HEK2933xFLAG-Cul1 cells, we sought to investigate how various perturbations altered the assembly of different FBPs. In contrast to prior reports (Bennett et al., 2010; Lee et al., 2011), inhibition of Cul1 neddylation shifted FBPs towards an unassembled state (Figs. 5A, S4D–F) whereas association of Cand1/2 increased (Figs. 5B; S4F–G). Meanwhile, double knockout of Cand1/2 had the opposite effect (Figs. 5A–B, S4D–G). A core prediction of the SCF assembly model that emerged from biochemical studies is that the SREF activity of Cand1 is regulated by cullin neddylation (Pierce et al., 2013). If this is correct, the disruption of SCF complexes by MLN4924 should be dependent on Cand1/2. Indeed, MLN4924 had no significant effect on FBP assembly in DKO cells (Figs 5A, S4E). These striking results are at odds with claims that Cand1 depletion has no effect on SCF assembly in human cells (Bennett et al., 2010) and Cand1 deletion causes a net reduction in SCF complexes in fission yeast (Wu et al., 2013). Two factors may account for the former discrepancy. First, knockdown of Cand1 results in elevated Cand2 binding to Cul1 (X. Liu, unpublished data). Second, elimination of Cand1 function in C. elegans requires its depletion beyond the level reported by Bennett et al. (Bosu et al., 2010).
Although the overall trends in FBP behavior in response to MLN4924 or Cand1/2 knockout were clear and striking, there was considerable unexplained granularity in the data. For example, FBXO44 assembly increased in cells treated with MLN4924 whereas several FBPs continued to show little or no assembly with Cul1 in DKO cells, at least one of which (FBXL16) does not appear to form an SCF complex (Honarpour et al., 2014). These observations highlight how SRM studies can open up new, unanticipated lines of inquiry.
To determine what percent of Cul1 was occupied by SR modules or Cand1/2 under various conditions, we determined the absolute concentrations of total and assembled pools of Skp1, Cand1/2, Cul1, and other SCF components in HEK293 (Wt and DKO cells) and 293T cells using SRM (Fig. S5A, D–F). There are some important discrepancies between values published by Bennett et al. (2010) and those reported here, which we discuss in the methods section. 3xFLAGCul1 was shared equally between Cand1 and Skp1 in HEK2933xFLAG-Cul1 cells. Meanwhile, Cand2 occupied less than 0.25% of Cul1 suggesting that it either has very little impact on SCF assembly in unperturbed HEK293 cells or is limited to a specific cellular locale (Figs. 5B, S5B). MLN4924 treatment decreased the Skp1 occupancy of Cul1 by 50%, while the Cand1 occupancy increased by ~37% (Fig. 5B); the latter figure was presumably constrained by the excess of Cul1-Cul5 (~2,050 nM) over Cand1 (~1210 nM). MLN4924 treatment increased the Cand2 occupancy of Cul1 dramatically, although it still only occupied less than 1% of Cul1. In the absence of Cand1/2, Skp1 occupied 100% of endogenous Cul1.
To gain further insight into the landscape of SCF enzymes, we measured the cellular concentration of 10 FBPs in both Wt and DKO HEK2933xFLAG-Cul1 cells (Fig. S5B). The FBPs selected were those that gave the strongest signals above background in SRM analyses of total cell lysate with unpurified peptides. The differences in FBP concentration between the 2 cell types were all within 2-fold, except for FBXO11 (~3 fold higher in DKO cells; Fig. S5B). Using the measured concentrations of these FBPs and Cul1, we calculated the percent of Cul1 which each FBP occupies in both Wt and DKO cells ± MLN4924 (Fig. 5C). Although FBXO11 was the FBP that assembled most efficiently with Cul1 (Fig. 5A), SCFFBXO11 was not the most abundant SCF complex; that distinction, at least in 293 cells, went to SCFFBXO33 (Fig. 5C), about which little is known. In keeping with the idea that formation of SCF complexes is regulated, there was no correlation between the cellular concentration of FBPs and their percent assembly with Cul1 in Wt or DKO 293 cells (Fig. S5C). Notably, in Wt cells these 10 FBPs accounted for 56% of total SCF ligases (Fig. 5C). Upon treatment with MLN4924 all 10 of these SCF complexes decreased in amount, whereas most of them were increased in DKO cells, mirroring the changes in percent assembly of FBPs (Fig. 5A). Together, these provide the most detailed and quantitative picture reported to date of the repertoire of FBPs and SCF complexes in a human cell.
Substrate drives assembly of SCF complexes
If Nedd8 conjugation and Cand1/2 jointly sustain a non-equilibrium population of SCF complexes, how are their actions controlled so that the SCF repertoire matches cellular demand? Biochemical data suggest that substrate may be the key, because bound substrate represses deneddylation, which should stabilize a CRL complex against exchange (Emberley et al., 2012; Enchev et al., 2012; Fischer et al., 2011; Pierce et al., 2013). We next sought to test this idea in a physiological context. Previous work demonstrated that EGF induces the degradation of phoso-AKT via SCFSKP2 and this corresponded to increased co-immunoprecipitation of overexpressed Skp2 with Cul1 (Chan et al., 2012). Therefore, we investigated whether EGF treatment influences assembly of the endogenous Skp2 and Cul1 proteins. Serum-starved Wt 3xFLAGCul1 cells were treated ± EGF for 15 minutes and 3xFLAGCul1 immunoprecipitated from the cells was analyzed via SRM. We observed that EGF reproducibly increased Cul1 assembly of not only Skp2, but also βTrCP1 and FBXL18 by >2-fold (Fig 6A; Table S2E), suggesting roles for the latter two proteins in the EGF response. Indeed, FBXL18 has been linked to EGF signaling (Zhang et al., 2017). Western blot analysis revealed that DKO cells had a higher resting level of p-AKT and Skp2•Cul1 complex, but that the EGF-induced assembly of Skp2 with Cul1 was dependent on Cand1/2 and Nedd8 conjugation (Fig. S6A, C–D). Consistent with this, the half-life of p-AKT was increased by ~3-fold in DKO cells (Fig. S6B). We additionally verified that EGF enhances formation of SCFFBXL18 in a Cand1/2 and Nedd8 dependent manner (Fig. S6D) pointing to the intriguing possibility that regulated assembly can be used to discover new functions for FBPs.
Fig. 6. Signaling events alter the cellular repertoire of SCF ligases.

(A) EGF treatment alters the repertoire of SCF ligases. Serum-starved Wt HEK2933xFLAG-Cul1 cells were treated ± 50 ng/ml of EGF for 15’. An equal number of cells were lysed in the presence of excess rCul1GSTRbx1, subjected to anti-FLAG IP, spiked with heavy synthetic peptide, and analyzed by SRM. Samples were normalized to the H/L ratio of Cul1 and presented as the +EGF/Control protein ratio. (B) Relative differences in the SCFome at two cell cycle checkpoint arrests. Wt HEK2933xFLAG-Cul1 cells were treated with either 100 ng/ml of nocodazole or 5 mM hydroxyurea for 16 hrs. Cells were lysed and prepared for SRM analysis as described above. NOC only: assembly of SCFcycF and SCFFBXO8 was detected only in nocodazole-treated cells. Data from (A) and (B) represent 2 biological replicates. Statistically significant changes from (A–B) are presented in Table S2E–F. (C) Heat map showing % binding of each FBP to Cul1 after DNA damage. Wt HEK2933xFLAG-Cul1 cells were treated with either DMSO or 50 µM of etoposide for 16 hrs. Cells were lysed in the presence of rCul1GSTRbx1. FBPs bound to endogenous Cul1 and those captured by recovering Cul1•GSTRbx1 were quantified by SRM. The heat map is sorted relative to Wt-untreated from 80 (red) to 0% bound (white). FBPs not detected (ND) in either sample are shaded grey. Data represents the average of 2 biological replicates. Changes were considered significant at p≤0.05 (*) (Table S2G). (D) Time-dependent accumulation of SCFFBXO6 after DNA damage. Wt HEK2933xFLAG-Cul1 cells were treated with either DMSO or 50 µM of etoposide or cisplatin (CPT) for the indicated time (CPT for 16 hrs). Cells were lysed in the presence of excess rCul1GSTRbx1, subjected to anti-FLAG IP, and analyzed by Western blot.
We further pursued this idea by examining relative assembly of SCF complexes at the DNA replication and spindle checkpoints. (Figs. 6B, S6E). Notably, 8 FBPs exhibited >2-fold change in relative assembly with Cul1 at the two arrest points (Figs. 6B, S6F; Table S2F). Of the 5 FBPs that exhibited increased assembly in metaphase arrest, cyclin F was previously linked to centrosome duplication and maintenance of dNTP pools during G2 phase of the cell cycle (D’Angiolella et al., 2012; D’Angiolella et al., 2010). Meanwhile of the 3 FBPs that exhibited increased assembly with Cul1 in S phase relative to metaphase arrest (Figs. 6B, S6F; Table S2F), FBXW7 and Skp2 are functionally linked to G1/S phase progression (Carrano et al., 1999; Koepp et al., 2001; Strohmaier et al., 2001; Sutterluty et al., 1999; Zhang et al., 1995).
Finally, we employed the SRM approach to quantify percent assembly of SCF enzymes upon induction of DNA damage with etoposide (Fig. S7A). This revealed substantial variation in percent assembly of a few FBPs (Figs. 6C, S7B–E, Table S2G). Notably, the FBP that showed the largest magnitude change, FBXO6 (Figs. 6C–D, S7F), was previously implicated in the recovery from DNA damage (Zhang et al., 2009). Enhanced formation of SCFFBXO6 was observed within 3 hrs of etoposide addition (Fig. 6D). In addition to FBXO6, FBXO9 also showed strong DNA damage-induced assembly with Cul1 (Figs. 6C, S7G–H), suggesting that it too may function in the DNA damage response. Taken together, these experiments show that three distinct perturbations induce assembly of SCF complexes that have already been linked to each perturbation, suggesting that the substrate-induced stabilization of particular SCF complexes can be exploited to discover new functions for FBPs. Our results suggest unanticipated functions for several FBPs, including βTrCP1 in EGF signaling and FBXO9 in DNA damage response.
A potential confounding factor with the experiments described above, is that the perturbation employed could influence not only substrate, but perhaps the enzyme itself. For example, induced assembly of Skp2 with Cul1 upon addition of EGF could be triggered not only by formation of p-AKT substrate but possibly by EGF-induced modification of Skp2. To definitively establish that substrate is sufficient to drive formation of an SCF complex, we used a bio-orthogonal signal to generate substrate. We turned to the auxin-dependent degradation of proteins bearing an auxin-inducible degron (AID) because this process: (i) is well characterized and depends on an SCF complex; (ii) has been successfully transplanted into human cells, where auxin has no known biological effect. We engineered Wt and DKO 3xFLAGCul1 cells to express the rice FBP Tir1 tagged with a 9xMyc epitope and its engineered substrate H2BAID-YFP (Holland et al., 2012). Like endogenous FBPs, Tir19xMyc exhibited increased assembly with 3xFLAGCul1 in DKO cells (Tir1 occupied 2.2% and 9.5% of 3xFLAGCul1 in Wt and DKO cells, respectively; Fig. 7A). Consistent with Holland et al. (2012), H2BAID-YFP was degraded with a t1/2 of 45’ in Wt cells. This increased to 82’ in DKO cells despite the elevated assembly of Tir19xMyc with 3xFLAGCul1 (Fig. 7B). To evaluate if substrate promotes formation of SCFTir1, we induced expression of H2BAID-YFP with tetracycline and then treated with auxin to initiate H2BAID-YFP degradation, followed by cell lysis and immunoprecipitation of 3xFLAGCul1. Auxin treatment increased assembly of Tir19xMyc with 3xFLAGCul1 by ~3-fold (Fig. 7C–E). This effect was both fast and specific: enhanced assembly was observed in as little as 10 min (Fig. 7C), and auxin had no effect on 3xFLAGCul1 association with the FBPs Skp2 (Fig. 7C–E), β-TrCP (Fig. 7E), or FBXO7 (Figs. 7C–D). To evaluate the role of Nedd8 conjugation and Cand1/2-mediated exchange in induced formation of SCFTir1 complexes, we repeated the experiment in Wt and DKO cells treated with MLN4924 (Fig. 7E–F). Strikingly, auxin failed to enhance formation of SCFTir1 in either case. Consistent with the idea that substrate enhances accumulation of its cognate SCF complex by protecting it from deneddylation, auxin increased the percent neddylation of Cul1 bound to Tir1 (Fig. 7F).
Fig. 7. Substrate drives SCF complex assembly in a Cand1/2- and neddylation-dependent manner.

(A) Steady state assembly of osTir19xMyc with 3xFLAGCul1 in Wt and DKO cells in the absence of auxin. Wt and DKO HEK2933xFLAG-Cul1 cells stably expressing osTir19xMyc and Tet-inducible H2BAID-YFP were lysed in the presence of rCul1GSTRbx1 and subjected to IP with anti-Myc. The bound (IP) and unbound (FT) fractions were Western blotted with the indicated antibodies. (B) Degradation of H2B AID-YFP substrate is hindered in the absence of Cand1/2. The cell lines from (A) were treated with tetracycline for 24 hrs to activate H2BAID-YFP expression, treated with 500 µM auxin, and at the indicated time points after auxin addition samples were lysed and analyzed by Western blot. The half-life of H2BAID-YFP was calculated from 2 biological replicates. (C) Auxin-induced osTir1 AID-YFP assembly with Cul1 is rapid. Wt cells from (A) were treated with 500 µM auxin for the indicated time, lysed in the presence of rCul1GSTRbx1, and subjected to IP followed by Western blot. (D) Auxin-driven SCFTir1 assembly peaks in 30’ and depends on Cand1/2. Cells from (A) were treated as described in (C) for the indicated amount of time. Fold change in osTir19xMyc association with 3xFLAGCul1 is displayed below. (E) Inhibition of neddylation blocks substrate driven SCF complex assembly. Same as (D) except cells were treated ± MLN4924 and auxin, as indicated, for 30’ prior to cell lysis. (F) Substrate increases the association of neddylated Cul1 interacting with osTir19xMyc. Cells were treated and processed as described above except that auxin treatment was for 30’ or 60’ and IP was for osTir19xMyc. Percent neddylated Cul1 (N8-Cul1) is indicated. S.E., L.E.: short and long exposures.
Discussion
In this study, we developed a multiplex affinity purification-SRM mass spectrometry assay to measure SCF ubiquitin ligase assembly in cells and identified an important but previously unappreciated limitation of prior studies that investigated SCF assembly (Bennett et al., 2010; Chua et al., 2011; Lee et al., 2011; Pierce et al., 2013; Wu et al., 2013; Yumimoto et al., 2013). The SR exchange factor Cand1 catalyzes unexpectedly rapid and pervasive exchange of SR modules during the course of a conventional immunoprecipitation, such that the sample that is analyzed is comprised largely of complexes that formed during in vitro manipulations. Because of the exchange that occurs post-cell lysis, non-equilibrium steady-states that exist in cells are scrambled upon generation of a homogeneous lysate. We show that post-lysis SR exchange, as well as modest overexpression of Cul1 scaffold, obscure the profound effect of MLN4924 treatment on SCF assembly. It is unclear whether post-lysis SR exchange is a problem for other CRL complexes, but we suspect that it is considering that Cand1 binds other cullins (Bennett et al., 2010; Chua et al., 2011; Liu et al., 2002; Min et al., 2003; Zheng et al., 2002). Although SR exchange is a facilitated process, in the case of the p97 network rapid equilibration of cofactors is mediated by their high intrinsic kon and koff (Xue et al., 2016). This problem is likely to be widespread and may affect other heteromeric enzymes that undergo dynamic remodeling, like protein phosphatase 2A (Kong et al., 2009).
To suppress the rampant Cand1/2-dependent exchange of SR modules in cell lysate, we used rCul1GSTRbx1 as a molecular sponge to ‘soak-up’ free Cand1/2 and SR modules by recruiting them into stable SR•Cul1•GSTRbx1 and Cul1• GSTRbx1•Cand1 complexes. The molecular sponge not only limits post-lysis SR exchange, but it also enables independent recovery and quantification of both assembled and free pools of Cul1-binding proteins, thereby revealing the composition of the ‘SCFome’.
Using the methodology developed here, we report two unexpected findings regarding assembly of FBPs into SCF complexes. First, we show that the steady-state repertoire of SCF ubiquitin ligases is in disequilibrium as different FBPs display massive variation in efficiency of binding to Cul1 (ranging from 0–70%). Second, we show that FBP assembly with Cul1 is inefficient; greater than half of all FBPs exhibit ≤10% assembly into SCF complexes. This low binding is a consequence of two factors: (i) Skp1 is in 4-fold molar excess over Cul1, and (ii) nearly half of the Cul1 pool is occupied by Cand1. The substantial imbalance between Cul1 and SRs underscores a need for a mechanism to remodel the repertoire of SCF complexes to allow cells to adapt to different physiological states. Deconjugation of Nedd8 from Cul1 and subsequent Cand1/2-mediated exchange together serve as the driving force to sustain dynamic reshuffling of SCF complexes in cells. Inhibition of Nedd8 conjugation shifts FBPs towards net disassembly. By contrast, elimination of the Cand1/2 proteins has the opposite effect. Importantly, the disassembly of FBPs caused by MLN4924 is driven by Cand1/2 activities because MLN4924 has little effect on the SCF repertoire in cells lacking these proteins.
In addition to a mechanism to remodel their SCF complexes, cells need to regulate remodeling to guide it in an advantageous direction. How does this happen? To avoid confounding effects that might arise from using an endogenous regulatory pathway that could impinge on both enzyme and substrate, we employed a ‘synthetic biology’ approach that capitalizes on a heterologous rice ubiquitylation pathway transplanted into 293 cells. With this system we demonstrate that addition of auxin stimulates binding of the auxin-dependent model substrate H2BAID-YFP to its cognate rice FBP Tir1, which in turn binds endogenous human Cul1 to form an SCF complex. Crucially, auxin-induced formation of SCFTir1 was dependent on both Cand1/2 activity and Nedd8 conjugation. More generally, this observation implies that SCF complexes mobilized in response to a particular signal or stress are reacting to substrates generated in that context, which could point the way to new functions for FBPs. Indeed, we demonstrate in three separate examples (+EGF, cell cycle arrest, and DNA damage induction) that signaling events drive the formation of a specific SCF complexes, some of which have already been implicated in these processes, but including others which have not. For EGF signaling, we demonstrated that mitogen-induced formation of SCFSkp2 and SCFFBXL18 are dependent on Cand-mediated exchange and Nedd8 conjugation
Our studies indicate that the cellular landscape of SCF ligases resembles a “Just in Time” system, which in business is a strategy to increase efficiency and decrease waste by only receiving goods for production as they are needed. Similarly, a cell preferentially accumulates a particular SCF complex to high levels when its substrate is present. It will be interesting to see how these events are coordinated in time and space, and whether other CRLs are governed by similar principles.
Star Methods
Contact for Reagent and Resource Sharing
Further information and reagent requests may be directed to the lead contact Raymond J. Deshaies (deshaies@caltech.edu).
Experimental Model and Subject Details
Human Cell Lines
All cell lines were authenticated by Laragen Inc. using the Promega PowerPlex 16 system and periodically tested for mycoplasma contamination.
Flp-In T-REX 293 Cells
Cells were maintained in DMEM supplemented with 10% heat-inactivated fetal bovine serum (FBS), 2 mM glutamine, and penicillin-streptomycin. The Cand1/2 knockout Flp-In T-REx HEK293 cells were developed using CRISPR technology and described in an accompanying manuscript. SILAC labeling was carried out in SILAC DMEM containing 10% dialyzed FBS and 13C615N2-lysine and 13C6-arginine.
293FT and 293T/17 Cells
Cells were maintained in DMEM supplemented with 10% heat-inactivated fetal bovine serum (FBS), 2 mM glutamine, and penicillin-streptomycin.
Method Details
Materials and plasmids
MLN4924, 1,10 phenanthroline (oPT), Etoposide, Nocodazole, and Cisplatin were dissolved in dimethyl sulfoxide (DMSO). Hydroxyurea was dissolved in water. Human recombinant EGF protein was dissolved in 0.1% FBS in PBS.
The lentiviral backbone pCDH-EF1-MCS-IRES-NEO was used to direct the expression of HAFBXO6 and osTir19xMyc. The osTir19xMyc backbone sequence and the H2BAID-YFP construct was a kind gift from Dr. Don Cleveland and is described in (Holland et al., 2012). The pX330-U6-Chimeric BB-CBh-hSpCas9 plasmid (Cong et al., 2013) was used to create Cul1 epitope-tagged cell lines. pCR-Blunt II-TOPO was used to create the CRISPR donor construct.
Generation of stable cell lines
Lentivirus were generated as described (Nguyen et al., 2016). Briefly, osTir19xMyc and HAFBXO6 lentiviral constructs were cotransfected with packaging (psPAX2) and enveloping (pMD.2G) plasmids into 293FT cells using Fugene HD. Virus-containing supernatants were harvested at 48 and 72 hrs after transfection. The viral titer was determined using Lenti-X GoStix. 3xFLAGCul1 Wt and DKO (osTir19xMyc only) HEK293 cells were infected at a multiplicity of infection of 2.0. Expression of the proteins in all cells was verified by immunofluorescence.
Targeted integration of constructs into 293 Flp-In T-REx cells
Targeted integration of H2BAID-YFP and FLAGCul1 coding sequences into the Flp-In site was carried out as previously described (Holland et al., 2012; Pierce et al., 2013). Briefly, 293 Flp-in T-Rex cells were cotransfected with pcDNA.5/FRT/TO based vectors and pOG44 Flp-Recombinase using Lipofectamine 3000. One day following transfection, cells were treated with 100 µg/ml Hygromycin to select for cells with successful integration. To induce protein expression, cells were treated with 1 µg/mL tetracycline.
Affinity-Purification for SRM and Western blot analysis
Approximately 25 µl of packed 3xFLAGCul1 HEK293 cells were lysed in 500 µl Pierce IP lysis buffer containing 1x protease inhibitor, 1 µM MLN4924, and 2 mM oPT. When determining percent bound to Cul1 or suppressing post-cell lysis exchange, rCul1GSTRbx1 was added to the IP buffer at 100x endogenous levels (~1.5 µM) prior to cell lysis (Bennett et al., 2010). Cell lysates were briefly sonicated (10 seconds; 1 second ON/OFF; 10% of maximum amplitude using Branson Digital Sonifier) and cleared by centrifugation at 14,100 RPM for 2-minutes at 4°C. Analysis of the insoluble pellet confirmed essentially complete solubilization of 3xFLAGCul1 (Fig. S1H). Approximately 3-minutes elapsed from addition of lysis buffer to the immunoprecipitation step. The soluble fraction was transferred to 50 µl of anti-FLAG affinity gel and immunoprecipitated for the indicated amount of time. The anti-FLAG affinity gel was washed 2x with IP lysis buffer, 1x with lysis buffer lacking detergent, and 3x with 100 mM Tris (pH 8.0). The flow-through was transferred to 300 µl of pack glutathione sepharose 4B beads plus 500 µl more lysis buffer and incubated for 2 hrs at 4°C. Beads were washed as described above. For SRM analysis, protein was eluted from anti-FLAG and glutathione beads with 10% ammonium hydroxide. Samples were lyophilized and protein was digested according to (Lee et al., 2011). For Western blot analysis, samples were eluted in 2x SDS loading buffer. Quantification of Western blots was performed using ImageStudioLite software.
Effects of mitogen signaling, cell cycle arrest, and DNA damage on the SCFome
To assess DNA damage-dependent changes in the SCFome, HEK2933xFLAGCul1 cells (70% confluency) were treated with DMSO or 50 µM etoposide for 16 hrs. To assess cell cycle-dependent changes in the SCFome, HEK2933xFLAGCul1 cells were treated with either 100 ng/ml of nocodazole or 5 mM hydroxyurea for 16 hrs (Bengoechea-Alonso et al., 2005). To assess EGF-dependent changes in the SCFome HEK2933xFLAGCul1 cells were serum starved for 18 hrs and then EGF was added to cells at 50 ng/ml (Chan et al., 2012). Cells were lysed and prepared for SRM analysis or Western blot as described above. Prior to injection, samples were spiked with heavy synthetic peptide standards, which we used to normalize between replicates.
Epitope tagging using CRISPR/Cas9
pX330 was constructed as described in (Cong et al., 2013) using the Cul1 targeting sequences (Fig. S1A). Efficient Cas9 cleavage of the Cul1 targeting site was assessed using a Surveyor Mutation Detection Kit (Integrated DNA Technologies) (Fig. S1B). To assemble the CRISPR donor sequence, we synthesized gBlock DNA (Integrated DNA Technologies) sequences corresponding to that shown in Fig. S1A and then assembled into one amplicon using Gibson Assembly. The Cul1 homology arms were 500 bp in length. The donor sequence was cloned into a vector (pCR II- Blunt-Topo) that does not contain a promoter that drives transcription. HEK293 cells (Wt and DKO) were transfected with the Cul1-targeting CRISPR plasmid and the donor plasmid using Lipofectamine 3000 at a 3:1 molar ratio, respectively. After 24 hrs, single cells were seeded into 96-well plates. Once clones reached confluency, they were screened for homologous insertion of the 3xFLAG tag at the N-terminus of Cul1 using PCR and Western blot (Fig. S1C–D). Cell morphology, cell growth (Fig. 1SE), and Cul1 neddylation (Fig. 1SD) were compared to parental cells to ensure that the epitope-tagging did not affect cell physiology.
Purified recombinant proteins
Cul1GSTRbx1, UBC12, DCN1, Skp2-Skp1, and Nedd8 were purified as described in (Li et al., 2005; Saha and Deshaies, 2008). Cand1 and FBXW7-Skp1 were purified as described in (Pierce et al., 2013). CSN was purified as described in (Enchev et al., 2012). Ubiquitin was purchased from Boston Biochem. Protein purity was assessed by SDS-PAGE and coomassie staining (Figs. S3A; S5D–F).
Quantitative reverse transcription PCR
Quantitative PCR (qPCR) was performed using primers specific to FBXO6 and Beta Actin mRNA following methodology described previously (Radhakrishnan et al., 2014). Briefly, RNA was isolated from Wt HEK2933xFLAG-Cul1 using the RNAeasy kit. Superscript III first strand synthesis kit was used to prepare cDNA. qPCR was performed using LightCycler 480 SYBR Green I Master reagent on a LightCycler 480 qPCR instrument (Roche).
SRM assay development
Peptide selection, SRM assay generation, and method optimization were developed following established guidelines (Picotti and Aebersold, 2012; Picotti et al., 2010). At least two (and in most cases three) unique tryptic peptides per protein were selected and synthesized as isotopically heavy (13C615N2-lysine and 13C615N4-arginine) standards (Table S1A). Peptides that have been observed in-house were given top priority in peptide selection, but for those that have not been observed, we used SRMAtlas (Kusebauch et al., 2016). Unpurified peptides were pooled together in a 50 pmol/peptide/µl stock. The synthetic peptide mix with added indexed Retention Time (iRT) peptide mix (Escher et al., 2012) were analyzed on a QTRAP 6500 mass spectrometer (AB Sciex) in SRM-triggered MS2 mode to extract the most intense precursor ions, the 4 most SRM-suitable transition ions, and the retention time for every peptide (Table S1A). The MS2 data were searched using Mascot. 0.75µg of peptide was injected into the instrument and was analyzed in SRM-scheduled mode. The data was analyzed using Skyline (MacLean et al., 2010). Peptides that were undetectable and interfering product ions were manually removed. Peptides were not considered for relative quantification if the most intense transition was less than 1,000 counts/second.
For the experiments in which we estimated the percent of all queried proteins bound to Cul1 (Fig. 5; Fig. S4), lyophilized peptides from the FLAG immunoprecipitation and GST-pulldown were resuspended in equal volumes of MS buffer (2% acetonitrile, 0.2% formic acid, 98% H2O), spiked with synthetic peptides standards, and 0.75µg was injected into the instrument. Data was normalized to injection volume.
Absolute quantification
To determine the cellular concentration of the invariant SCF subunits and regulatory proteins, HEK293 and 293T cells were grown for 12-cell doublings in isotopically heavy SILAC medium. Cells were harvested from 10 cm dishes and counted using a CEDEX HiRES automated cell counter (Roche), which determines average cell number and cell diameter from 20-technical replicates. The concentration of purified proteins (Fig. S5D–F) was determined on a NanoDrop (ThermoFisher). Cells were lysed in 500 µl of lysis buffer (8 M Urea, 40 mM Tris (pH 8.0), 0.1 M ammonium bicarbonate, 5 mM TCEP) that was spiked with purified protein in similar amounts as described in (Bennett et al., 2010). Lysate was sonicated 2x for 10-seconds (20% maximum efficiency) and then centrifuged for 15 min at 15,000 RPM at 4°C. No insoluble pellet was observed using these conditions. The samples were digested as described in (Lee et al., 2011). Peptides were desalted using HyperSep C18 Cartridges. Data were analyzed using Skyline (MacLean et al., 2010).
In order to test the overall accuracy of the standard/endogenous protein ratios reported by our SRM absolute quantification method, we spiked heavy cell lysates from 293T cells with 5 different concentrations (1.56, 6.25, 25, 100, 400 nM) of light recombinant proteins and analyzed the samples via SRM. The computed standard/endogenous protein ratios were accurate over a range of three orders of magnitude.
For determining the cellular concentrations of FBPs and Cand2, a surrogate peptide for each protein was selected from our established SRM assay based on its consistent MS detectability, signal intensity, and amino acid composition (Table S1A–B) (Picotti and Aebersold, 2012; Schubert et al., 2013). Each protein was quantified by SRM by spiking lysis buffer with absolute-quantified heavy-isotope labeled standard peptide in defined concentrations. These heavy peptides include a trypsin-cleavable tag so that peptide digestion efficiency is similar to endogenous. Samples were then prepped as described in the previous paragraph. The measured concentrations of Cand1 and Skp1 were very similar to that measured using purified protein (Fig. S5A–B), supporting the method of using peptide surrogates to measure protein concentration.
The cellular concentrations reported in (Bennett et al., 2010) are lower and have a smaller Cul1:Cand1:Skp1 ratio than what we observe. We suspect that the discrepancy exists due to differing methods of sample preparation. Bennett et al., 2010, spiked their samples with AQUA peptides immediately prior to MS injection. This approach fails to account for peptide loss inherent to sample preparation. To account for peptide loss, we added either purified protein or peptide directly to our lysis buffer (Gerber et al., 2003; Mani et al., 2012).
Quantification and Statistical Analysis
Statistical analysis of SRM data is listed in Table S2. p-values were computed using limma (Ritchie et al., 2015; Smyth, 2004) on the log2 transformed protein ratios. P-values were adjusted for multiple hypothesis testing using the Benjamini and Hochberg method (Benjamini and Hochberg, 1995). All non-Western blot figures were generated using GraphPad Prism software.
SRM acquisition
Analysis of the samples was performed on the ABSciex QTRAP 6500 LC-MS/MS system, equipped with an Eksigent ekspert nanoLC 425 pump, ekspert nanoLC400 autosampler, ekspert cHiPLC, and Analyst software. Samples were desalted using an on-line CHiPLC Chrom XP C18-CL 3 µm, 120 Å trap column (200 µm × 0.5 mm) then directed onto an analytical CHiPLC Chrom XP C18-CL 3 µm column, 120 Å (75 µm × 150 mm) at a column temperature of 45°C. Chromatogr aphic separation was achieved using a 300 nl/min flow rate and a linear gradient of 5 to 30 % B within 45 min; 30–90 % B in 2 min, followed by 100 % B for 10 min, solvent A was 0.2 % formic acid and solvent B was 98.8 % acetonitrile containing 0.2 % formic acid.
For all SRM experiments, 6500 QTRAP acquisition parameters were as follows: 2000–2200 V nano-spray voltage, curtain gas setting of 30 psi and nebulizer gas setting of 10 psi, interface heater at 15°C, 2.5 × 10⁻⁵ torr base pressure, and Q1 and Q3 set to unit resolution (0.6–0.8 Da full width at peak half-height).
SRM acquisition methods were constructed in Skyline (MacLean et al., 2010) using a maximum of 1,300 SRM transitions per injection with peptide-specific tuned declustering potential (DP), collision energy (CE) voltages, and retention time constraints. A default collision cell exit potential of 15 V was used for all SRM transitions, and the scheduled SRM option was used for all data acquisition with a target cycle time of 2 s and a 4-min SRM detection window.
Supplementary Material
(A) List of unpurified synthetic peptides that were used as standards for SRM analysis. (B) Absolute-quantified synthetic peptide standards used to determine protein concentration. Details of (A) and (B) discussed in STAR Methods.
(A) Time-dependent FBP exchange (Figure 1B–C). (B) FBP exchange is dependent on Cand1/2 (Figure 2B–C). (C) rCul1GSTRbx1 suppresses FBP exchange (Figure 3B–C). (D) Percent binding of FBPs to Cul1 (Figure 5A). (E) EGF treatment alters the repertoire of SCF ligases (Figure 6A). (F) Relative differences in the SCFome at cell cycle checkpoint arrests (Figure 6B). (G) Percent binding of FBPs to Cul1 after DNA damage (Figure 6C).
(A) (Top) Schematic of the human Cul1 locus targeted by CRISPR/Cas9, (middle) the Cul1 donor sequence, (bottom) structure of the donor vector used for tagging. (B) Specific cleavage of the Cul1 locus by CRISPR/Cas9. HEK293 cells were transfected with empty CRISPR/Cas9 vector or vector targeting Cul1. After 48hrs, Surveyor nuclease assay was used to visualize Cas9 cleavage of the Cul1 locus. * Indicates nuclease cleavage. (C) The Cul1 donor sequence successfully integrated into all Cul1 alleles. HEK293 and HEK293DKO Cells were transfected with CRISPR/Cas9 vector and donor vector at a ratio of 3:1. Single cells were sorted and screened for correct insertion of the donor via PCR. (D) Western blot validation showing that all expressed Cul1 was tagged with 3xFLAG, and that the 3xFLAG tag had no adverse effects on Cul1 function as judged by normal accumulation of the Cul1 substrate cyclin E. NT, non-tagged parental cells. (E) Tagging Cul1 did not affect cell growth. Parental and 3xFLAG-CulHEK293 cells were seeded at equal confluency. Cell doubling was calculated by determining the proliferation rate out to 72hrs. Data represents 3 biological replicates ± SD. (F)3xFLAGCul1 was rapidly immunodepleted. Cells were lysed in buffer containing MLN4924 and oPT and subjected to IP with anti-FLAG beads for the indicated times prior to analysis of bound (IP) and unbound (FT) fractions. Note that essentially all 3XFLAGCul1 was immunoprecipitated within 20’. (G) Adding Nedd8 conjugation/deconjugation inhibitors to IP lysis buffer stabilized neddylated:deneddylated Cul1 ratio. HEK2933xFLAG-Cul1 cells were lysed with 1% NP40 lysis buffer with or without inhibitors, sonicated, and incubated at 4°C for the indicated times prior to a nalysis by Western blot. Note that even with inclusion of oPT in lysis buffer, there was modest deneddylation compared to samples lysed directly in SDS. (H) Comparison of efficiency of 3xFLAGCul1 extraction using various IP lysis buffers. Cells were either directly lysed in 2% SDS lysis buffer (D.L.) or the indicated IP lysis buffers. Lysates were sonicated and the insoluble fractions were pelleted. Soluble and pellet fractions were analyzed by Western blot. (I) MLN4924 treatment results in complete deconjugation of Nedd8 from 3xFLAGCul1 within 30 minutes. HEK2933xFLAG-Cul1 cells were treated with 1 µM MLN4924 for 30 min, lysed directly into denaturing SDS buffer, and evaluated by Western blot.
(A–C) Time-dependent post-lysis FBP exchange in Wt cell lysate partitioned by FBP-subclass. Data represent 4 biological replicates (Mean ± SEM). These measurements correspond to the data points in Fig. 1B. (D) Estimation of the percent neddylation of different SCF complexes in Wt cells. Percent neddylation was derived from the percent exchange data in (A–C) at 20 minutes ± MLN4924 by calculating how much the percent exchange increases when cells were treated with MLN4924. (E–G) Post-lysis FBP exchange in DKO cell lysate partitioned by FBP-subclass. Data represent 3 biological replicates (Mean ± SEM). These measurements correspond to the data points in Fig. 2B.
(A) Purified rCul1GSTRbx1 expressed in E. coli. The NTD and CTD of split-and-coexpress Cul1 comigrated as a single band at the indicated position. (*) represents proteins that co-purified with rCul1GSTRbx1. (B–D) Exchange of individual FBPs in cell lysate made with rCul1GSTRbx1 partitioned by FBP-subclass. Data represent 3 biological replicates (Mean ± SEM). These measurements correspond to the data points in Fig. 3B. (E) rCul1GSTRbx1 blocks recombinant FBXW7 from binding endogenous 3xFLAGCul1. HEK2933xFLAG-Cul1 cell extract was split into three tubes and rCul1GSTRbx1 was added to one. Samples were then supplemented with ± FBXW7•Skp1 and immunoprecipitated for 3xFLAGCul1. Samples were spiked with heavy internal synthetic peptides and analyzed for the extent of assembly of the exogenous FBXW7•Skp1with the endogenous 3xFLAGCul1 using SRM. Data presented as mean of 2 replicates ± SEM; significance p≤0.05 (*). (F) Spiking cell lysate with rCul1GSTRbx1 stabilizes endogenous SCF complexes. HEK2933xFLAG-Cul1 cells were lysed in the presence or absence of rCul1GSTRbx1. Lysates were subjected to IP for the indicated amount of time and analyzed by Western blot. Note that in the presence of rCul1GSTRbx1, the recoveries of Skp1, Skp2, and Fbxo7 in association with endogenous 3xFLAGCul1 were enhanced. This is contrary to what is expected for addition of a competitor, and underscores the ability of excess rCul1GSTRbx1 to increase recovery of endogenous SCF complexes by sequestering Cand1/2. S.E, L.E.: short and long exposures. (G) rCul1GSTRbx1 does not sequester FBPs from endogenous 3xFLAGCul1. HEK2933xFLAG-Cul1 DKO cells were lysed in the presence or absence of rCul1GSTRbx1 and 3xFLAGCul1 was immunoprecipitated for 20’. Samples were spiked with isotopically heavy peptide standards and subjected to SRM analysis. Data presented as mean ± SEM; significance p≤0.05 (*). (H) Individual FBPs from panel (C). Note that all of the FBPs shown must dissociate very slowly from endogenous Cul1, otherwise they would have been titrated out by the excess rCul1GSTRbx1. (I) Verification of panel (F). HEK2933xFLAG-Cul1 DKO cells were pretreated with MLN4924 and then lysed in the presence or absence of rCul1GSTRbx1 prior to IP with anti-FLAG and analysis by Western blot. (J) Retrieving Cul1GSTRbx1 after FLAG IP enables measurement of FBPs and Cand1/2 that are not bound to endogenous 3xFLAGCul1. HEK2933xFLAG-Cul1 cells were lysed in the presence or absence of rCul1GSTRbx1 and 3xFLAGCul1 was isolated by IP for 20’. Flow-through (FT) was collected and rCul1GSTRbx1 was recovered using Glutathione Sepharose resin. Proteins bound to FLAG and glutathione beads were eluted in equal volumes of SDS sample buffer and analyzed by Western blot..
(A–C) Percent binding of individual FBPs to endogenous 3xFLAGCul1 in Wt and DKO cells partitioned by FBP-subclass. Data represents 4 biological replicates (Mean ± SEM). These measurements correspond to the data shown in Fig. 5A. (D) Scatter plot representing the average percent binding of each FBP to Cul1. Each dot represents the mean percent bound to Cul1 for individual FBPs from 4 biological replicates. The red bars indicate the median percent bound to Cul1. Median differences were considered significant at p≤0.05. Data is derived from Fig. 5A. (E) Cand1/2 are required for MLN4924-mediated disassembly. Data from Fig. 5A were plotted as the average change in percent binding of all FBPs to endogenous Cul1 upon treatment of Wt and DKO cells with MLN4924. Data presented as mean ± SEM; significance p≤0.05 (*). (F) Western blot verification of Fig. 5A. Equal portions of the anti-FLAG- and GSH-bound fractions were evaluated across all four experiments. S.E., L.E.: short and long exposures. (G) Changes in Cand1, Cand2, and Skp1 association with endogenous 3xFLAGCul1. Data presented as mean ± SEM; significance p≤0.05 (*).
(A) Cellular concentrations determined in HEK293 and 293T cells. Cells were grown in heavy SILAC medium and were lysed in buffer containing known concentrations of light purified recombinant proteins. Samples were analyzed by SRM. Data represents the mean from 2 biological replicates. SEM: standard error of the mean. (B) Cellular concentrations of invariant SCF subunits and FBPs. Wt and DKO HEK2933xFLAG-Cul1 cells were lysed in the presence of surrogate heavy purified peptide corresponding to each protein (Table S1B). Samples were analyzed by SRM. Data represents the mean from 2 biological replicates. (C) Correlation analysis of percent bound to Cul1 and cellular FBP concentration for Wt and DKO cells. (D–F) Purity of recombinant proteins used for absolute quantification. Coomassie-stained SDS-polyacrylamide gels show the relative purity of each protein used for absolute quantification by SRM.
(A) Steady-state levels of p-AKT in Wt and DKO cells. Cells were lysed in 2% SDS lysis buffer and analyzed by Western blot. (B) Degradation of p-AKT is impaired in DKO cells. Wt and DKO cells were serum starved for 18 hrs and then treated with 50 ng/ml of EGF for 10 min. Cells were washed 3x with PBS, replaced with serum free medium, and lysed at the indicated time point using 2% SDS buffer. (C) EGF drives Cand1/2-dependent assembly of Skp2 with Cul1. Serum starved Wt and DKO HEK2933xFLAG-Cul1 cells were treated with 50 ng/ml of EGF for the indicated time, lysed in the presence of rCul1GSTRbx1, and analyzed by anti-FLAG IP followed by Western blot. (D) EGF-stimulated assembly of Skp2 with Cul1 requires Nedd8 conjugation. Serum starved Wt and DKO HEK2933xFLAG-Cul1 cells were pretreated with or without MLN4924 for 30 min and then treated with or without 50 ng/ml of EGF for 10 minutes. Cells were processed as described in (C). (E) Western blot analysis of cells synchronized by nocodazole (NOC) or hydroxyurea (HU) for 16 hrs. (F) Western blot validation of changes observed in Fig. 6B. Cell lysis was performed in the presence of rCul1GSTRbx1 followed by anti-FLAG IP and Western blot analysis..
(A) Changes in markers of DNA damage in HEK2933xFLAG-Cul1 cells treated with 50 µM etoposide for 0–16 hrs. (B) Changes in Cand1, Cand2, and Skp1 association with endogenous 3xFLAGCul1 as measured in anti-FLAG IPs and GSH pull-downs upon treatment of HEK2933xFLAG-Cul1 cells with 50 µM etoposide for 16 hrs. (C–E) Same as panel (B), except specific subclasses of FBPs are shown. (C) FBXO subclass. (D) FBXW subclass. (E) FBXL subclass. Data represents 2 biological replicates (Mean ± SEM). These measurements correspond to the data shown in Fig. 6C. (F) DNA damage does not alter FBXO6 gene expression. Wt cells were treated with etoposide for 16 hrs and prepped for qPCR analysis. Data represents 3 biological replicates (Mean ± SEM). (G) Orthogonal verification of changes in FBXO9 assembly from Fig. 6C. HEK2933xFLAG-Cul1 cells were treated with or without 50 µM etoposide for 16 hrs, lysed in the presence of rCul1GSTRbx1, subjected to IP with anti-FLAG, and both the IP and flow-through were analyzed by Western blot. (H) Time-dependent changes in FBXO9 assesmbly with Cul1. As in panel (B), except that cells were treated with etoposide for the 0, 3, 6, or 16 hrs and the input lysate was analyzed instead of the anti-FLAG flow-through.
Highlights.
Cand1-driven equilibration of SCF enzymes in lysate is quelled by molecular sponge
Assembly of F-box proteins into SCF complexes ranges from 0–70%; median of ~19%
Cellular SCF repertoire is tightly regulated by Nedd8 and Cand1/2
Cells preferentially accumulate a specific SCF ligase when its substrate is present
Acknowledgments
We would like to thank Christina Ludwig and Ruedi Aebersold for providing J.M.R. with technical training in SRM mass spectrometry. We also thank Don Cleveland for reagents. Finally, we thank the Deshaies lab and the Proteome Exploration Laboratory for helpful discussions. M.J.S., A.M., and S.H. were supported by the Gordon and Betty Moore Foundation (GBMF775) and the Beckman Institute. J.M.R. is supported by F32 grant GM112308. X.L. is supported by the Jane Coffin Childs Memorial Fund for Medical Research. R.J.D. is an Investigator of the Howard Hughes Medical Institute and this work was supported in part by HHMI.
Footnotes
Publisher's Disclaimer: This is a PDF file of an unedited manuscript that has been accepted for publication. As a service to our customers we are providing this early version of the manuscript. The manuscript will undergo copyediting, typesetting, and review of the resulting proof before it is published in its final citable form. Please note that during the production process errors may be discovered which could affect the content, and all legal disclaimers that apply to the journal pertain.
Author Contributions
Conceptualization, J.M.R. and R.J.D.; Experimentation, J.M.R., X.L., and K.M.R., Resources, J.M.R., X.L., K.M.R., A.M., and S.H.; Funding Acquisition and Supervision, J.M.R., X.L., S.H., and R.J.D.; Visualization and Writing, J.M.R., M.J.S., K.M.R., and R.J.D.
References
- Bengoechea-Alonso MT, Punga T, Ericsson J. Hyperphosphorylation regulates the activity of SREBP1 during mitosis. Proc Natl Acad Sci U S A. 2005;102:11681–11686. doi: 10.1073/pnas.0501494102. [DOI] [PMC free article] [PubMed] [Google Scholar]
- Benjamini Y, Hochberg Y. Controlling the False Discovery Rate - a Practical and Powerful Approach to Multiple Testing. J Roy Stat Soc B Met. 1995;57:289–300. [Google Scholar]
- Bennett EJ, Rush J, Gygi SP, Harper JW. Dynamics of cullin-RING ubiquitin ligase network revealed by systematic quantitative proteomics. Cell. 2010;143:951–965. doi: 10.1016/j.cell.2010.11.017. [DOI] [PMC free article] [PubMed] [Google Scholar]
- Bornstein G, Ganoth D, Hershko A. Regulation of neddylation and deneddylation of cullin1 in SCFSkp2 ubiquitin ligase by F-box protein and substrate. Proc Natl Acad Sci U S A. 2006;103:11515–11520. doi: 10.1073/pnas.0603921103. [DOI] [PMC free article] [PubMed] [Google Scholar]
- Bosu DR, Feng H, Min K, Kim Y, Wallenfang MR, Kipreos ET. C. elegans CAND-1 regulates cullin neddylation, cell proliferation and morphogenesis in specific tissues. Dev Biol. 2010;346:113–126. doi: 10.1016/j.ydbio.2010.07.020. [DOI] [PMC free article] [PubMed] [Google Scholar]
- Brownell JE, Sintchak MD, Gavin JM, Liao H, Bruzzese FJ, Bump NJ, Soucy TA, Milhollen MA, Yang X, Burkhardt AL, et al. Substrate-assisted inhibition of ubiquitin-like protein-activating enzymes: the NEDD8 E1 inhibitor MLN4924 forms a NEDD8-AMP mimetic in situ. Mol Cell. 2010;37:102–111. doi: 10.1016/j.molcel.2009.12.024. [DOI] [PubMed] [Google Scholar]
- Carrano AC, Eytan E, Hershko A, Pagano M. SKP2 is required for ubiquitin-mediated degradation of the CDK inhibitor p27. Nat Cell Biol. 1999;1:193–199. doi: 10.1038/12013. [DOI] [PubMed] [Google Scholar]
- Cavadini S, Fischer ES, Bunker RD, Potenza A, Lingaraju GM, Goldie KN, Mohamed WI, Faty M, Petzold G, Beckwith RE, et al. Cullin-RING ubiquitin E3 ligase regulation by the COP9 signalosome. Nature. 2016;531:598–603. doi: 10.1038/nature17416. [DOI] [PubMed] [Google Scholar]
- Chan CH, Li CF, Yang WL, Gao Y, Lee SW, Feng Z, Huang HY, Tsai KK, Flores LG, Shao Y, et al. The Skp2-SCF E3 ligase regulates Akt ubiquitination, glycolysis, herceptin sensitivity, and tumorigenesis. Cell. 2012;149:1098–1111. doi: 10.1016/j.cell.2012.02.065. [DOI] [PMC free article] [PubMed] [Google Scholar]
- Chua YS, Boh BK, Ponyeam W, Hagen T. Regulation of cullin RING E3 ubiquitin ligases by CAND1 in vivo. PLoS One. 2011;6:e16071. doi: 10.1371/journal.pone.0016071. [DOI] [PMC free article] [PubMed] [Google Scholar]
- Cong L, Ran FA, Cox D, Lin S, Barretto R, Habib N, Hsu PD, Wu X, Jiang W, Marraffini LA, et al. Multiplex genome engineering using CRISPR/Cas systems. Science. 2013;339:819–823. doi: 10.1126/science.1231143. [DOI] [PMC free article] [PubMed] [Google Scholar]
- D’Angiolella V, Donato V, Forrester FM, Jeong YT, Pellacani C, Kudo Y, Saraf A, Florens L, Washburn MP, Pagano M. Cyclin F-mediated degradation of ribonucleotide reductase M2 controls genome integrity and DNA repair. Cell. 2012;149:1023–1034. doi: 10.1016/j.cell.2012.03.043. [DOI] [PMC free article] [PubMed] [Google Scholar]
- D’Angiolella V, Donato V, Vijayakumar S, Saraf A, Florens L, Washburn MP, Dynlacht B, Pagano M. SCF(Cyclin F) controls centrosome homeostasis and mitotic fidelity through CP110 degradation. Nature. 2010;466:138–142. doi: 10.1038/nature09140. [DOI] [PMC free article] [PubMed] [Google Scholar]
- Deshaies RJ, Joazeiro CA. RING domain E3 ubiquitin ligases. Annu Rev Biochem. 2009;78:399–434. doi: 10.1146/annurev.biochem.78.101807.093809. [DOI] [PubMed] [Google Scholar]
- Dye BT, Schulman BA. Structural mechanisms underlying posttranslational modification by ubiquitin-like proteins. Annu Rev Biophys Biomol Struct. 2007;36:131–150. doi: 10.1146/annurev.biophys.36.040306.132820. [DOI] [PubMed] [Google Scholar]
- Emberley ED, Mosadeghi R, Deshaies RJ. Deconjugation of Nedd8 from Cul1 is directly regulated by Skp1-F-box and substrate, and the COP9 signalosome inhibits deneddylated SCF by a noncatalytic mechanism. J Biol Chem. 2012;287:29679–29689. doi: 10.1074/jbc.M112.352484. [DOI] [PMC free article] [PubMed] [Google Scholar]
- Enchev RI, Scott DC, da Fonseca PC, Schreiber A, Monda JK, Schulman BA, Peter M, Morris EP. Structural basis for a reciprocal regulation between SCF and CSN. Cell Rep. 2012;2:616–627. doi: 10.1016/j.celrep.2012.08.019. [DOI] [PMC free article] [PubMed] [Google Scholar]
- Escher C, Reiter L, MacLean B, Ossola R, Herzog F, Chilton J, MacCoss MJ, Rinner O. Using iRT, a normalized retention time for more targeted measurement of peptides. Proteomics. 2012;12:1111–1121. doi: 10.1002/pmic.201100463. [DOI] [PMC free article] [PubMed] [Google Scholar]
- Feldman RM, Correll CC, Kaplan KB, Deshaies RJ. A complex of Cdc4p, Skp1p, and Cdc53p/cullin catalyzes ubiquitination of the phosphorylated CDK inhibitor Sic1p. Cell. 1997;91:221–230. doi: 10.1016/s0092-8674(00)80404-3. [DOI] [PubMed] [Google Scholar]
- Fischer ES, Scrima A, Bohm K, Matsumoto S, Lingaraju GM, Faty M, Yasuda T, Cavadini S, Wakasugi M, Hanaoka F, et al. The molecular basis of CRL4DDB2/CSA ubiquitin ligase architecture, targeting, and activation. Cell. 2011;147:1024–1039. doi: 10.1016/j.cell.2011.10.035. [DOI] [PubMed] [Google Scholar]
- Gerber SA, Rush J, Stemman O, Kirschner MW, Gygi SP. Absolute quantification of proteins and phosphoproteins from cell lysates by tandem MS. Proc Natl Acad Sci U S A. 2003;100:6940–6945. doi: 10.1073/pnas.0832254100. [DOI] [PMC free article] [PubMed] [Google Scholar]
- Gibson TJ, Seiler M, Veitia RA. The transience of transient overexpression. Nat Methods. 2013;10:715–721. doi: 10.1038/nmeth.2534. [DOI] [PubMed] [Google Scholar]
- Holland AJ, Fachinetti D, Han JS, Cleveland DW. Inducible, reversible system for the rapid and complete degradation of proteins in mammalian cells. Proc Natl Acad Sci U S A. 2012;109:E3350–3357. doi: 10.1073/pnas.1216880109. [DOI] [PMC free article] [PubMed] [Google Scholar]
- Honarpour N, Rose CM, Brumbaugh J, Anderson J, Graham RL, Sweredoski MJ, Hess S, Coon JJ, Deshaies RJ. F-box protein FBXL16 binds PP2A–B55alpha and regulates differentiation of embryonic stem cells along the FLK1+ lineage. Mol Cell Proteomics. 2014;13:780–791. doi: 10.1074/mcp.M113.031765. [DOI] [PMC free article] [PubMed] [Google Scholar]
- Husnjak K, Dikic I. Ubiquitin-binding proteins: decoders of ubiquitin-mediated cellular functions. Annu Rev Biochem. 2012;81:291–322. doi: 10.1146/annurev-biochem-051810-094654. [DOI] [PubMed] [Google Scholar]
- Jin J, Cardozo T, Lovering RC, Elledge SJ, Pagano M, Harper JW. Systematic analysis and nomenclature of mammalian F-box proteins. Genes Dev. 2004;18:2573–2580. doi: 10.1101/gad.1255304. [DOI] [PMC free article] [PubMed] [Google Scholar]
- Kamura T, Koepp DM, Conrad MN, Skowyra D, Moreland RJ, Iliopoulos O, Lane WS, Kaelin WG, Jr, Elledge SJ, Conaway RC, et al. Rbx1, a component of the VHL tumor suppressor complex and SCF ubiquitin ligase. Science. 1999;284:657–661. doi: 10.1126/science.284.5414.657. [DOI] [PubMed] [Google Scholar]
- Koepp DM, Schaefer LK, Ye X, Keyomarsi K, Chu C, Harper JW, Elledge SJ. Phosphorylation-dependent ubiquitination of cyclin E by the SCFFbw7 ubiquitin ligase. Science. 2001;294:173–177. doi: 10.1126/science.1065203. [DOI] [PubMed] [Google Scholar]
- Kong M, Ditsworth D, Lindsten T, Thompson CB. Alpha4 is an essential regulator of PP2A phosphatase activity. Mol Cell. 2009;36:51–60. doi: 10.1016/j.molcel.2009.09.025. [DOI] [PMC free article] [PubMed] [Google Scholar]
- Kusebauch U, Campbell DS, Deutsch EW, Chu CS, Spicer DA, Brusniak MY, Slagel J, Sun Z, Stevens J, Grimes B, et al. Human SRMAtlas: A Resource of Targeted Assays to Quantify the Complete Human Proteome. Cell. 2016;166:766–778. doi: 10.1016/j.cell.2016.06.041. [DOI] [PMC free article] [PubMed] [Google Scholar]
- Lee JE, Sweredoski MJ, Graham RL, Kolawa NJ, Smith GT, Hess S, Deshaies RJ. The steady-state repertoire of human SCF ubiquitin ligase complexes does not require ongoing Nedd8 conjugation. Mol Cell Proteomics. 2011;10:M110 006460. doi: 10.1074/mcp.M110.006460. [DOI] [PMC free article] [PubMed] [Google Scholar]
- Li T, Pavletich NP, Schulman BA, Zheng N. High-level expression and purification of recombinant SCF ubiquitin ligases. Methods Enzymol. 2005;398:125–142. doi: 10.1016/S0076-6879(05)98012-9. [DOI] [PubMed] [Google Scholar]
- Liu J, Furukawa M, Matsumoto T, Xiong Y. NEDD8 modification of CUL1 dissociates p120(CAND1), an inhibitor of CUL1-SKP1 binding and SCF ligases. Mol Cell. 2002;10:1511–1518. doi: 10.1016/s1097-2765(02)00783-9. [DOI] [PubMed] [Google Scholar]
- MacLean B, Tomazela DM, Shulman N, Chambers M, Finney GL, Frewen B, Kern R, Tabb DL, Liebler DC, MacCoss MJ. Skyline: an open source document editor for creating and analyzing targeted proteomics experiments. Bioinformatics. 2010;26:966–968. doi: 10.1093/bioinformatics/btq054. [DOI] [PMC free article] [PubMed] [Google Scholar]
- Mani DR, Abbatiello SE, Carr SA. Statistical characterization of multiple-reaction monitoring mass spectrometry (MRM-MS) assays for quantitative proteomics. BMC Bioinformatics. 2012;13(Suppl 16):S9. doi: 10.1186/1471-2105-13-S16-S9. [DOI] [PMC free article] [PubMed] [Google Scholar]
- Min KW, Hwang JW, Lee JS, Park Y, Tamura TA, Yoon JB. TIP120A associates with cullins and modulates ubiquitin ligase activity. J Biol Chem. 2003;278:15905–15910. doi: 10.1074/jbc.M213070200. [DOI] [PubMed] [Google Scholar]
- Mosadeghi R, Reichermeier KM, Winkler M, Schreiber A, Reitsma JM, Zhang Y, Stengel F, Cao J, Kim M, Sweredoski MJ, et al. Structural and kinetic analysis of the COP9-Signalosome activation and the cullin-RING ubiquitin ligase deneddylation cycle. Elife. 2016:5. doi: 10.7554/eLife.12102. [DOI] [PMC free article] [PubMed] [Google Scholar]
- Nakayama KI, Nakayama K. Ubiquitin ligases: cell-cycle control and cancer. Nat Rev Cancer. 2006;6:369–381. doi: 10.1038/nrc1881. [DOI] [PubMed] [Google Scholar]
- Nguyen TV, Lee JE, Sweredoski MJ, Yang SJ, Jeon SJ, Harrison JS, Yim JH, Lee SG, Handa H, Kuhlman B, et al. Glutamine Triggers Acetylation-Dependent Degradation of Glutamine Synthetase via the Thalidomide Receptor Cereblon. Mol Cell. 2016;61:809–820. doi: 10.1016/j.molcel.2016.02.032. [DOI] [PMC free article] [PubMed] [Google Scholar]
- Ohta T, Michel JJ, Schottelius AJ, Xiong Y. ROC1, a homolog of APC11, represents a family of cullin partners with an associated ubiquitin ligase activity. Mol Cell. 1999;3:535–541. doi: 10.1016/s1097-2765(00)80482-7. [DOI] [PubMed] [Google Scholar]
- Okita K, Ichisaka T, Yamanaka S. Generation of germline-competent induced pluripotent stem cells. Nature. 2007;448:313–317. doi: 10.1038/nature05934. [DOI] [PubMed] [Google Scholar]
- Picotti P, Aebersold R. Selected reaction monitoring-based proteomics: workflows, potential, pitfalls and future directions. Nat Methods. 2012;9:555–566. doi: 10.1038/nmeth.2015. [DOI] [PubMed] [Google Scholar]
- Picotti P, Rinner O, Stallmach R, Dautel F, Farrah T, Domon B, Wenschuh H, Aebersold R. High-throughput generation of selected reaction-monitoring assays for proteins and proteomes. Nat Methods. 2010;7:43–46. doi: 10.1038/nmeth.1408. [DOI] [PubMed] [Google Scholar]
- Pierce NW, Lee JE, Liu X, Sweredoski MJ, Graham RL, Larimore EA, Rome M, Zheng N, Clurman BE, Hess S, et al. Cand1 promotes assembly of new SCF complexes through dynamic exchange of F box proteins. Cell. 2013;153:206–215. doi: 10.1016/j.cell.2013.02.024. [DOI] [PMC free article] [PubMed] [Google Scholar]
- Radhakrishnan SK, den Besten W, Deshaies RJ. p97-dependent retrotranslocation and proteolytic processing govern formation of active Nrf1 upon proteasome inhibition. Elife. 2014;3:e01856. doi: 10.7554/eLife.01856. [DOI] [PMC free article] [PubMed] [Google Scholar]
- Reiterer V, Figueras-Puig C, Le Guerroue F, Confalonieri S, Vecchi M, Jalapothu D, Kanse SM, Deshaies RJ, Di Fiore PP, Behrends C, et al. The pseudophosphatase STYX targets the F-box of FBXW7 and inhibits SCFFBXW7 function. EMBO J. 2017;36:260–273. doi: 10.15252/embj.201694795. [DOI] [PMC free article] [PubMed] [Google Scholar]
- Ritchie ME, Phipson B, Wu D, Hu Y, Law CW, Shi W, Smyth GK. limma powers differential expression analyses for RNA-sequencing and microarray studies. Nucleic Acids Res. 2015;43:e47. doi: 10.1093/nar/gkv007. [DOI] [PMC free article] [PubMed] [Google Scholar]
- Saha A, Deshaies RJ. Multimodal activation of the ubiquitin ligase SCF by Nedd8 conjugation. Mol Cell. 2008;32:21–31. doi: 10.1016/j.molcel.2008.08.021. [DOI] [PMC free article] [PubMed] [Google Scholar]
- Salahudeen AA, Thompson JW, Ruiz JC, Ma HW, Kinch LN, Li Q, Grishin NV, Bruick RK. An E3 ligase possessing an iron-responsive hemerythrin domain is a regulator of iron homeostasis. Science. 2009;326:722–726. doi: 10.1126/science.1176326. [DOI] [PMC free article] [PubMed] [Google Scholar]
- Schmidt MW, McQuary PR, Wee S, Hofmann K, Wolf DA. F-box-directed CRL complex assembly and regulation by the CSN and CAND1. Mol Cell. 2009;35:586–597. doi: 10.1016/j.molcel.2009.07.024. [DOI] [PMC free article] [PubMed] [Google Scholar]
- Schubert OT, Mouritsen J, Ludwig C, Rost HL, Rosenberger G, Arthur PK, Claassen M, Campbell DS, Sun Z, Farrah T, et al. The Mtb proteome library: a resource of assays to quantify the complete proteome of Mycobacterium tuberculosis. Cell Host Microbe. 2013;13:602–612. doi: 10.1016/j.chom.2013.04.008. [DOI] [PMC free article] [PubMed] [Google Scholar]
- Seol JH, Feldman RM, Zachariae W, Shevchenko A, Correll CC, Lyapina S, Chi Y, Galova M, Claypool J, Sandmeyer S, et al. Cdc53/cullin and the essential Hrt1 RING-H2 subunit of SCF define a ubiquitin ligase module that activates the E2 enzyme Cdc34. Genes Dev. 1999;13:1614–1626. doi: 10.1101/gad.13.12.1614. [DOI] [PMC free article] [PubMed] [Google Scholar]
- Skaar JR, Pagan JK, Pagano M. Mechanisms and function of substrate recruitment by F-box proteins. Nat Rev Mol Cell Biol. 2013;14:369–381. doi: 10.1038/nrm3582. [DOI] [PMC free article] [PubMed] [Google Scholar]
- Skaar JR, Pagan JK, Pagano M. SCF ubiquitin ligase-targeted therapies. Nat Rev Drug Discov. 2014;13:889–903. doi: 10.1038/nrd4432. [DOI] [PMC free article] [PubMed] [Google Scholar]
- Skowyra D, Craig KL, Tyers M, Elledge SJ, Harper JW. F-box proteins are receptors that recruit phosphorylated substrates to the SCF ubiquitin-ligase complex. Cell. 1997;91:209–219. doi: 10.1016/s0092-8674(00)80403-1. [DOI] [PubMed] [Google Scholar]
- Smyth GK. Linear models and empirical bayes methods for assessing differential expression in microarray experiments. Stat Appl Genet Mol Biol. 2004;3 doi: 10.2202/1544-6115.1027. Article3. [DOI] [PubMed] [Google Scholar]
- Soucy TA, Smith PG, Milhollen MA, Berger AJ, Gavin JM, Adhikari S, Brownell JE, Burke KE, Cardin DP, Critchley S, et al. An inhibitor of NEDD8-activating enzyme as a new approach to treat cancer. Nature. 2009;458:732–736. doi: 10.1038/nature07884. [DOI] [PubMed] [Google Scholar]
- Strohmaier H, Spruck CH, Kaiser P, Won KA, Sangfelt O, Reed SI. Human F-box protein hCdc4 targets cyclin E for proteolysis and is mutated in a breast cancer cell line. Nature. 2001;413:316–322. doi: 10.1038/35095076. [DOI] [PubMed] [Google Scholar]
- Sutterluty H, Chatelain E, Marti A, Wirbelauer C, Senften M, Muller U, Krek W. p45SKP2 promotes p27Kip1 degradation and induces S phase in quiescent cells. Nat Cell Biol. 1999;1:207–214. doi: 10.1038/12027. [DOI] [PubMed] [Google Scholar]
- Werner A, Iwasaki S, McGourty CA, Medina-Ruiz S, Teerikorpi N, Fedrigo I, Ingolia NT, Rape M. Cell-fate determination by ubiquitin-dependent regulation of translation. Nature. 2015;525:523–527. doi: 10.1038/nature14978. [DOI] [PMC free article] [PubMed] [Google Scholar]
- Wu S, Zhu W, Nhan T, Toth JI, Petroski MD, Wolf DA. CAND1 controls in vivo dynamics of the cullin 1-RING ubiquitin ligase repertoire. Nature communications. 2013;4:1642. doi: 10.1038/ncomms2636. [DOI] [PMC free article] [PubMed] [Google Scholar]
- Xue L, Blythe EE, Freiberger EC, Mamrosh JL, Hebert AS, Reitsma JM, Hess S, Coon JJ, Deshaies RJ. Valosin-containing protein (VCP)-Adaptor Interactions are Exceptionally Dynamic and Subject to Differential Modulation by a VCP Inhibitor. Mol Cell Proteomics. 2016;15:2970–2986. doi: 10.1074/mcp.M116.061036. [DOI] [PMC free article] [PubMed] [Google Scholar]
- Ye J, Zhang Y, Xu J, Zhang Q, Zhu D. FBXO40, a gene encoding a novel muscle-specific F-box protein, is upregulated in denervation-related muscle atrophy. Gene. 2007;404:53–60. doi: 10.1016/j.gene.2007.08.020. [DOI] [PubMed] [Google Scholar]
- Yen JL, Flick K, Papagiannis CV, Mathur R, Tyrrell A, Ouni I, Kaake RM, Huang L, Kaiser P. Signal-induced disassembly of the SCF ubiquitin ligase complex by Cdc48/p97. Mol Cell. 2012;48:288–297. doi: 10.1016/j.molcel.2012.08.015. [DOI] [PMC free article] [PubMed] [Google Scholar]
- Yumimoto K, Muneoka T, Tsuboi T, Nakayama KI. Substrate binding promotes formation of the Skp1-Cul1-Fbxl3 (SCF(Fbxl3)) protein complex. J Biol Chem. 2013;288:32766–32776. doi: 10.1074/jbc.M113.511303. [DOI] [PMC free article] [PubMed] [Google Scholar]
- Zemla A, Thomas Y, Kedziora S, Knebel A, Wood NT, Rabut G, Kurz T. CSN- and CAND1-dependent remodelling of the budding yeast SCF complex. Nat Commun. 2013;4:1641. doi: 10.1038/ncomms2628. [DOI] [PubMed] [Google Scholar]
- Zhang H, Kobayashi R, Galaktionov K, Beach D. p19Skp1 and p45Skp2 are essential elements of the cyclin A-CDK2 S phase kinase. Cell. 1995;82:915–925. doi: 10.1016/0092-8674(95)90271-6. [DOI] [PubMed] [Google Scholar]
- Zhang J, Yang Z, Ou J, Xia X, Zhi F, Cui J. The F-box protein FBXL18 promotes glioma progression by promoting K63-linked ubiquitination of Akt. FEBS Lett. 2017;591:145–154. doi: 10.1002/1873-3468.12521. [DOI] [PubMed] [Google Scholar]
- Zhang YW, Brognard J, Coughlin C, You Z, Dolled-Filhart M, Aslanian A, Manning G, Abraham RT, Hunter T. The F box protein Fbx6 regulates Chk1 stability and cellular sensitivity to replication stress. Mol Cell. 2009;35:442–453. doi: 10.1016/j.molcel.2009.06.030. [DOI] [PMC free article] [PubMed] [Google Scholar]
- Zheng J, Yang X, Harrell JM, Ryzhikov S, Shim EH, Lykke-Andersen K, Wei N, Sun H, Kobayashi R, Zhang H. CAND1 binds to unneddylated CUL1 and regulates the formation of SCF ubiquitin E3 ligase complex. Mol Cell. 2002;10:1519–1526. doi: 10.1016/s1097-2765(02)00784-0. [DOI] [PubMed] [Google Scholar]
Associated Data
This section collects any data citations, data availability statements, or supplementary materials included in this article.
Supplementary Materials
(A) List of unpurified synthetic peptides that were used as standards for SRM analysis. (B) Absolute-quantified synthetic peptide standards used to determine protein concentration. Details of (A) and (B) discussed in STAR Methods.
(A) Time-dependent FBP exchange (Figure 1B–C). (B) FBP exchange is dependent on Cand1/2 (Figure 2B–C). (C) rCul1GSTRbx1 suppresses FBP exchange (Figure 3B–C). (D) Percent binding of FBPs to Cul1 (Figure 5A). (E) EGF treatment alters the repertoire of SCF ligases (Figure 6A). (F) Relative differences in the SCFome at cell cycle checkpoint arrests (Figure 6B). (G) Percent binding of FBPs to Cul1 after DNA damage (Figure 6C).
(A) (Top) Schematic of the human Cul1 locus targeted by CRISPR/Cas9, (middle) the Cul1 donor sequence, (bottom) structure of the donor vector used for tagging. (B) Specific cleavage of the Cul1 locus by CRISPR/Cas9. HEK293 cells were transfected with empty CRISPR/Cas9 vector or vector targeting Cul1. After 48hrs, Surveyor nuclease assay was used to visualize Cas9 cleavage of the Cul1 locus. * Indicates nuclease cleavage. (C) The Cul1 donor sequence successfully integrated into all Cul1 alleles. HEK293 and HEK293DKO Cells were transfected with CRISPR/Cas9 vector and donor vector at a ratio of 3:1. Single cells were sorted and screened for correct insertion of the donor via PCR. (D) Western blot validation showing that all expressed Cul1 was tagged with 3xFLAG, and that the 3xFLAG tag had no adverse effects on Cul1 function as judged by normal accumulation of the Cul1 substrate cyclin E. NT, non-tagged parental cells. (E) Tagging Cul1 did not affect cell growth. Parental and 3xFLAG-CulHEK293 cells were seeded at equal confluency. Cell doubling was calculated by determining the proliferation rate out to 72hrs. Data represents 3 biological replicates ± SD. (F)3xFLAGCul1 was rapidly immunodepleted. Cells were lysed in buffer containing MLN4924 and oPT and subjected to IP with anti-FLAG beads for the indicated times prior to analysis of bound (IP) and unbound (FT) fractions. Note that essentially all 3XFLAGCul1 was immunoprecipitated within 20’. (G) Adding Nedd8 conjugation/deconjugation inhibitors to IP lysis buffer stabilized neddylated:deneddylated Cul1 ratio. HEK2933xFLAG-Cul1 cells were lysed with 1% NP40 lysis buffer with or without inhibitors, sonicated, and incubated at 4°C for the indicated times prior to a nalysis by Western blot. Note that even with inclusion of oPT in lysis buffer, there was modest deneddylation compared to samples lysed directly in SDS. (H) Comparison of efficiency of 3xFLAGCul1 extraction using various IP lysis buffers. Cells were either directly lysed in 2% SDS lysis buffer (D.L.) or the indicated IP lysis buffers. Lysates were sonicated and the insoluble fractions were pelleted. Soluble and pellet fractions were analyzed by Western blot. (I) MLN4924 treatment results in complete deconjugation of Nedd8 from 3xFLAGCul1 within 30 minutes. HEK2933xFLAG-Cul1 cells were treated with 1 µM MLN4924 for 30 min, lysed directly into denaturing SDS buffer, and evaluated by Western blot.
(A–C) Time-dependent post-lysis FBP exchange in Wt cell lysate partitioned by FBP-subclass. Data represent 4 biological replicates (Mean ± SEM). These measurements correspond to the data points in Fig. 1B. (D) Estimation of the percent neddylation of different SCF complexes in Wt cells. Percent neddylation was derived from the percent exchange data in (A–C) at 20 minutes ± MLN4924 by calculating how much the percent exchange increases when cells were treated with MLN4924. (E–G) Post-lysis FBP exchange in DKO cell lysate partitioned by FBP-subclass. Data represent 3 biological replicates (Mean ± SEM). These measurements correspond to the data points in Fig. 2B.
(A) Purified rCul1GSTRbx1 expressed in E. coli. The NTD and CTD of split-and-coexpress Cul1 comigrated as a single band at the indicated position. (*) represents proteins that co-purified with rCul1GSTRbx1. (B–D) Exchange of individual FBPs in cell lysate made with rCul1GSTRbx1 partitioned by FBP-subclass. Data represent 3 biological replicates (Mean ± SEM). These measurements correspond to the data points in Fig. 3B. (E) rCul1GSTRbx1 blocks recombinant FBXW7 from binding endogenous 3xFLAGCul1. HEK2933xFLAG-Cul1 cell extract was split into three tubes and rCul1GSTRbx1 was added to one. Samples were then supplemented with ± FBXW7•Skp1 and immunoprecipitated for 3xFLAGCul1. Samples were spiked with heavy internal synthetic peptides and analyzed for the extent of assembly of the exogenous FBXW7•Skp1with the endogenous 3xFLAGCul1 using SRM. Data presented as mean of 2 replicates ± SEM; significance p≤0.05 (*). (F) Spiking cell lysate with rCul1GSTRbx1 stabilizes endogenous SCF complexes. HEK2933xFLAG-Cul1 cells were lysed in the presence or absence of rCul1GSTRbx1. Lysates were subjected to IP for the indicated amount of time and analyzed by Western blot. Note that in the presence of rCul1GSTRbx1, the recoveries of Skp1, Skp2, and Fbxo7 in association with endogenous 3xFLAGCul1 were enhanced. This is contrary to what is expected for addition of a competitor, and underscores the ability of excess rCul1GSTRbx1 to increase recovery of endogenous SCF complexes by sequestering Cand1/2. S.E, L.E.: short and long exposures. (G) rCul1GSTRbx1 does not sequester FBPs from endogenous 3xFLAGCul1. HEK2933xFLAG-Cul1 DKO cells were lysed in the presence or absence of rCul1GSTRbx1 and 3xFLAGCul1 was immunoprecipitated for 20’. Samples were spiked with isotopically heavy peptide standards and subjected to SRM analysis. Data presented as mean ± SEM; significance p≤0.05 (*). (H) Individual FBPs from panel (C). Note that all of the FBPs shown must dissociate very slowly from endogenous Cul1, otherwise they would have been titrated out by the excess rCul1GSTRbx1. (I) Verification of panel (F). HEK2933xFLAG-Cul1 DKO cells were pretreated with MLN4924 and then lysed in the presence or absence of rCul1GSTRbx1 prior to IP with anti-FLAG and analysis by Western blot. (J) Retrieving Cul1GSTRbx1 after FLAG IP enables measurement of FBPs and Cand1/2 that are not bound to endogenous 3xFLAGCul1. HEK2933xFLAG-Cul1 cells were lysed in the presence or absence of rCul1GSTRbx1 and 3xFLAGCul1 was isolated by IP for 20’. Flow-through (FT) was collected and rCul1GSTRbx1 was recovered using Glutathione Sepharose resin. Proteins bound to FLAG and glutathione beads were eluted in equal volumes of SDS sample buffer and analyzed by Western blot..
(A–C) Percent binding of individual FBPs to endogenous 3xFLAGCul1 in Wt and DKO cells partitioned by FBP-subclass. Data represents 4 biological replicates (Mean ± SEM). These measurements correspond to the data shown in Fig. 5A. (D) Scatter plot representing the average percent binding of each FBP to Cul1. Each dot represents the mean percent bound to Cul1 for individual FBPs from 4 biological replicates. The red bars indicate the median percent bound to Cul1. Median differences were considered significant at p≤0.05. Data is derived from Fig. 5A. (E) Cand1/2 are required for MLN4924-mediated disassembly. Data from Fig. 5A were plotted as the average change in percent binding of all FBPs to endogenous Cul1 upon treatment of Wt and DKO cells with MLN4924. Data presented as mean ± SEM; significance p≤0.05 (*). (F) Western blot verification of Fig. 5A. Equal portions of the anti-FLAG- and GSH-bound fractions were evaluated across all four experiments. S.E., L.E.: short and long exposures. (G) Changes in Cand1, Cand2, and Skp1 association with endogenous 3xFLAGCul1. Data presented as mean ± SEM; significance p≤0.05 (*).
(A) Cellular concentrations determined in HEK293 and 293T cells. Cells were grown in heavy SILAC medium and were lysed in buffer containing known concentrations of light purified recombinant proteins. Samples were analyzed by SRM. Data represents the mean from 2 biological replicates. SEM: standard error of the mean. (B) Cellular concentrations of invariant SCF subunits and FBPs. Wt and DKO HEK2933xFLAG-Cul1 cells were lysed in the presence of surrogate heavy purified peptide corresponding to each protein (Table S1B). Samples were analyzed by SRM. Data represents the mean from 2 biological replicates. (C) Correlation analysis of percent bound to Cul1 and cellular FBP concentration for Wt and DKO cells. (D–F) Purity of recombinant proteins used for absolute quantification. Coomassie-stained SDS-polyacrylamide gels show the relative purity of each protein used for absolute quantification by SRM.
(A) Steady-state levels of p-AKT in Wt and DKO cells. Cells were lysed in 2% SDS lysis buffer and analyzed by Western blot. (B) Degradation of p-AKT is impaired in DKO cells. Wt and DKO cells were serum starved for 18 hrs and then treated with 50 ng/ml of EGF for 10 min. Cells were washed 3x with PBS, replaced with serum free medium, and lysed at the indicated time point using 2% SDS buffer. (C) EGF drives Cand1/2-dependent assembly of Skp2 with Cul1. Serum starved Wt and DKO HEK2933xFLAG-Cul1 cells were treated with 50 ng/ml of EGF for the indicated time, lysed in the presence of rCul1GSTRbx1, and analyzed by anti-FLAG IP followed by Western blot. (D) EGF-stimulated assembly of Skp2 with Cul1 requires Nedd8 conjugation. Serum starved Wt and DKO HEK2933xFLAG-Cul1 cells were pretreated with or without MLN4924 for 30 min and then treated with or without 50 ng/ml of EGF for 10 minutes. Cells were processed as described in (C). (E) Western blot analysis of cells synchronized by nocodazole (NOC) or hydroxyurea (HU) for 16 hrs. (F) Western blot validation of changes observed in Fig. 6B. Cell lysis was performed in the presence of rCul1GSTRbx1 followed by anti-FLAG IP and Western blot analysis..
(A) Changes in markers of DNA damage in HEK2933xFLAG-Cul1 cells treated with 50 µM etoposide for 0–16 hrs. (B) Changes in Cand1, Cand2, and Skp1 association with endogenous 3xFLAGCul1 as measured in anti-FLAG IPs and GSH pull-downs upon treatment of HEK2933xFLAG-Cul1 cells with 50 µM etoposide for 16 hrs. (C–E) Same as panel (B), except specific subclasses of FBPs are shown. (C) FBXO subclass. (D) FBXW subclass. (E) FBXL subclass. Data represents 2 biological replicates (Mean ± SEM). These measurements correspond to the data shown in Fig. 6C. (F) DNA damage does not alter FBXO6 gene expression. Wt cells were treated with etoposide for 16 hrs and prepped for qPCR analysis. Data represents 3 biological replicates (Mean ± SEM). (G) Orthogonal verification of changes in FBXO9 assembly from Fig. 6C. HEK2933xFLAG-Cul1 cells were treated with or without 50 µM etoposide for 16 hrs, lysed in the presence of rCul1GSTRbx1, subjected to IP with anti-FLAG, and both the IP and flow-through were analyzed by Western blot. (H) Time-dependent changes in FBXO9 assesmbly with Cul1. As in panel (B), except that cells were treated with etoposide for the 0, 3, 6, or 16 hrs and the input lysate was analyzed instead of the anti-FLAG flow-through.