Abstract
Background
Hospitalized patients are assigned to available staffed beds based on patient acuity and services required. In hospitals with double-occupancy rooms, patients must be additionally matched on gender. Patients with methicillin-resistant Staphylococcus aureus (MRSA) or vancomycin-resistant Enterococcus (VRE) must be bedded in single-occupancy rooms or cohorted with other patients with similar MRSA/VRE flags.
Methods
We developed a discrete event simulation (DES) model of patient flow through an acute care hospital. Patients are matched to beds based on acuity, service, gender, and known MRSA/VRE colonization. Outcomes included time to bed arrival, length of stay, patient-bed acuity mismatches, occupancy, idle beds, acuity-related transfers, rooms with discordant MRSA/VRE colonization, and transmission due to discordant colonization.
Results
Observed outcomes were well-approximated by model-generated outcomes for time to bed arrival (6.7 vs. 6.2–6.5 hours) and length of stay (3.3 vs. 2.9–3.0 days), with overlapping 90% coverage intervals. Patient-bed acuity mismatches where patient acuity exceeds bed acuity, and where patient acuity is lower than bed acuity ranged from 0.6 to 0.9 and 8.6 to 11.1 mismatches per hour, respectively. Values for observed occupancy, total idle beds, and acuity-related transfers compared favorably to model-predicted values (91% vs. 86%–87% occupancy, 15.1 vs. 14.3–15.7 total idle beds, and 27.2 vs. 22.6–23.7 transfers). Rooms with discordant colonization status and transmission due to discordance were modeled without an observed value for comparison. One-way and multi-way sensitivity analyses were performed for idle beds and rooms with discordant colonization.
Conclusions
We developed and validated a DES model of patient flow incorporating MRSA/VRE flags. The model allowed quantification of the substantial impact of MRSA/VRE flags on hospital efficiency and potentially avoidable nosocomial transmission.
Keywords: MRSA, VRE, discrete event simulation, infection control, patient flow
INTRODUCTION
Over the last several decades, the number of hospital beds in the United States has decreased from 1.5 million to 0.9 million, with a stable number of admissions and decreasing length of stay [1]. Outpatient visits, inclusive of Emergency Department (ED) visits have increased over three-fold, as have wait-times [2]; more than half of all teaching hospitals report EDs at or above capacity [3], raising concerns about the impact on clinical outcomes [4–6].
The bed allocation process requires matching patients to available staffed beds based on clinical needs, and may delay patient flow. Patients must be matched to specific units and beds based on acuity, or severity of illness, and services required (i.e., medical or surgical). In double-occupancy rooms, additional matching is required based on gender, as well as methicillin-resistant Staphylococcus aureus (MRSA) and vancomycin-resistant Enterococcus (VRE) colonization. Patients who are colonized with MRSA/VRE, which are endemic in hospital settings [7–9], can act as reservoirs for contact transmission to other patients within the hospital. Infected or colonized patients are identified, or flagged, so appropriate infection control measures can be instituted.
The Centers for Disease Control and Prevention (CDC) recommends policies aimed at decreasing the likelihood of transmission of MRSA/VRE, including placement in a single-occupancy room, institution of Contact Precautions (CP), and active surveillance for MRSA/VRE in high-risk populations, such as those admitted to intensive care units (ICUs). If single-occupancy rooms are not available, cohorting patients with the same organisms (e.g., MRSA with MRSA) is an acceptable arrangement [10].
We designed and validated a discrete-event simulation (DES) model of hospital bed allocation, incorporating CDC recommendations related to MRSA/VRE. The main objectives were to develop and demonstrate a model of patient flow in a general hospital, specifically incorporating MRSA/VRE flags and true colonization. The model allows for presentation of conclusions important for optimization of patient flow and prevention of MRSA/VRE transmission.
Discrete event simulation models focused on hospital capacity have provided important insights into optimal hospital expansion [11], tradeoffs between using a first-in-first-out model of resource allocation compared to other methods of prioritization [13], and minimization of overcrowding [14, 15], among other examples [16–19]. We sought to extend this literature to focus on the impact of infection control on the flow of hospital patients and allocation of resources.
METHODS
Modeling Framework
Our choice of model was influenced by the need to model simultaneous interactions between individuals and their environment. We applied a constrained-resource model assuming a fixed capacity of staffed beds available, with competing access resulting in queues.
We used the following model outcomes to assess the validity of the model: 1) time to bed arrival; 2) length of stay; 3) patient-bed acuity mismatches; 4) occupancy; 5) idle beds (due to either MRSA/VRE flags or lack of available staffing); and 6) acuity-related within-hospital transfers. Two additional outcomes, rooms with discordant colonization (double-occupancy rooms with two patients discordant for MRSA/VRE true colonization) and incident MRSA/VRE colonization due to transmission in discordant rooms were included, but unable to be validated on historical data. The outcomes include commonly accepted metrics of hospital operations that would be expected to be influenced by alterations in infection control policy, and tests of key features of the model’s function. Model programming details are provided (Supplement Section A).
Modeling Patient Flow
Our simulation model was based on the Massachusetts General Hospital (MGH), a tertiary care academic medical center in Boston, Massachusetts. Content experts worked in collaboration to develop a conceptual approach to how patient- and bed-level characteristics were considered when assigning patients to beds. A schematic of the simulation model is provided (Figure 1).
Figure 1.
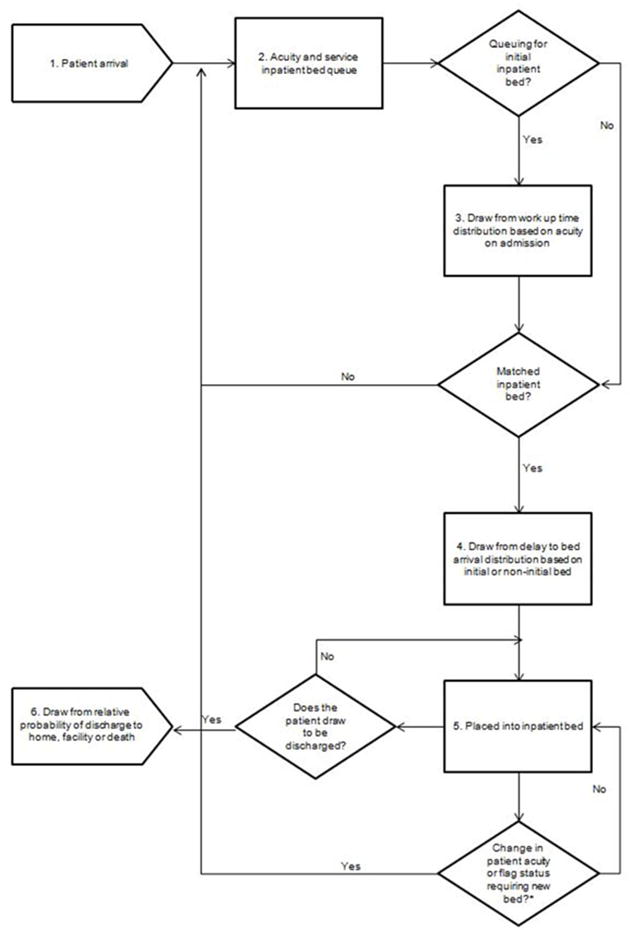
Model schematic. Patients experience six different events as they progress through the model: First, patients arrive in the hospital on an hourly basis (1). Each patient has four inherent characteristics that are relevant for bed allocation: acuity on arrival, service required (medical or surgical), gender, and MRSA and VRE flag status. The source of patient arrival is not modeled, nor is their physical location as they await initial bed placement. Next, on the basis of the combination of their four characteristics upon arrival, patients awaiting admission are instantly assigned to an acuity/service queue (2). The model does not begin to look for available beds immediately upon entrance to the queue. Instead, the model approximates work up time (i.e., an approximation of the time required by clinicians to evaluate and begin initial management of the patient) (3). During the time patients are being worked up, they may experience changes in acuity at each time step (i.e., if their condition improves their acuity will decrease, if their condition worsens, their acuity level will increase). If this change occurs, a patient’s acuity is updated and informs the bed match. Once a bed match is made, patients do not instantly arrive in the assigned bed. In order to account for delays in clinician-to-clinician pass-offs, as well as transport and other non-clinical administrative delays, the model draws from a relative distribution of delay in bed arrival in hours (4). At the completion of the delay to bed arrival, patients are placed in an inpatient bed within their required service and acuity level (5).Finally, at each hour the model draws from a discharge distribution to determine if each patient is ready to be discharged (6).
*Not all patients experience a change in patient acuity or flag status requiring a new bed. These patients will remain in their initial inpatient bed until discharge.
Bed Allocation
Bed allocation first requires matching patients to beds based on acuity and service required. Bed acuity is graded in order of level of care required: increasing from Observation Unit, General Care Unit, Step-Down Unit, to ICU. Patients then require either medical or surgical service, and each unit assigned one or the other designation. Patients awaiting admission are prioritized ahead of patients who are already occupying inpatient beds but require a bed transfer.
In the setting of single-occupancy rooms, neither patient gender nor MRSA/VRE flags influence bed allocation. For double-occupancy rooms only, an incoming patient must either be matched to a room in which current occupant is of same gender and same MRSA or VRE flag, or queue until a match becomes available. In the absence of sufficient staffing, beds cannot be used for patient care, and remain unfilled. For each bed at each time step, this information is modeled as a probability of closure and a distribution of closure duration in hours. When queues exist, unfilled beds are considered idle, and are attributed to either MRSA/VRE flags or staffing constraints.
Patient Movement
Once admitted to an inpatient bed, patients can be transferred if they experience: 1) a change in acuity resulting in discordance between their acuity and the bed acuity; or 2) a change in MRSA or VRE flags (e.g., they are found to be positive for MRSA or VRE) resulting in discordance with their current roommate. In both cases, the model will resolve the acuity or flag discordance by entering a proxy patient in the appropriate acuity/service queue to await appropriate bed placement. The proxy patient represents a bedded patient in the hospital bed queue, searching for an available transfer bed.
Time
The model runs in 1-hour time steps. Transfers can occur at each time step, with the exception of 7 PM to 8 AM, during which a rule was imposed based on discussions with internal subject matter experts.
Model Inputs
Patient characteristics, arrivals, work-up time distribution, delays to bed arrival distribution, acuity changes, discharges, and hospital structure were derived from hospital-based clinical and administrative data sources, and combined into a single database [20]. The cohort includes patients admitted to ED observation units.
Patient Characteristics
Patient characteristics include acuity on admission, service (medical or surgical), gender, and historical colonization with MRSA/VRE, denoted as flags. The cohort consisted of 95,091 patients of which 48% were female, 70% were admitted to a General Care Unit, and 52% required a medical service bed. Patient acuity on admission was derived from the level of care of the first bed assigned, but once admitted was subject to change based on the acuity transition probability matrix (see below Acuity Changes). Frequencies of patients in each combination of all characteristic variables are drawn from the assembled database. These frequencies were used as inputs to the model, with the model pulling from relative frequencies when selecting simulated patients on arrival at each time step. MRSA/VRE flags are based on the patient history of MRSA/VRE prior to admission. Such designations are commonly used by healthcare systems to facilitate implementation of infection control measures as recommended by the CDC [10] and are often based on either surveillance or clinical isolates, as they are in the historical data used for this model. These flags may be discordant with true colonization, as patients can acquire or clear colonization without detection, and without changes to their flag. Thus, for patients in the model, true colonization with MRSA/VRE, conditional on their flag, was derived from the literature and imposed upon all patients [21–23]. For patients without flags (e.g., no prior history of MRSA/VRE), published estimates of population prevalence were used as inputs for true colonization with MRSA/VRE [20]. In the model, as at MGH, active surveillance for MRSA/VRE is conducted for patients admitted to ICUs using culture methods, based on CDC recommendations. Universal surveillance outside of ICUs is not conducted. A new positive test results in updating the MRSA/VRE flag. Sensitivity and specificity of the MRSA assay were 0.88 and 0.98 respectively, and for VRE were 0.85 and 0.98, respectively, based on published literature [24, 25]. Selected admission cohort characteristics and data sources are provided (Table 1).
Table 1.
Selected Input Parameters Used in the Model Base Case
| Patient Characteristics | Base Case Value | References |
|---|---|---|
| Gender (% female) | 48% | 11 |
| Acuity on admission | 11 | |
| Observation Unit | 13% | |
| General Care Unit | 70% | |
| Step-Down Unit | 8% | |
| Intensive Care Unit | 9% | |
| Clinical service | 11 | |
| Medical | 52% | |
| Surgical | 48% | |
| Concordance between true colonization status given flag status | ||
| MRSA positive / MRSA nag positive (+/+) | 0.53 | Data warehouse, 26 |
| MRSA positive / no MRSA flag (+/−) | 0.025 | |
| MRSA negati ve I MRSA flag positive (−/+) | 0.47 | Data warehouse, 21 |
| MRSA negative / no MRSA flag (−/−) | 0.97 | |
| VRE positive / VRE flag positive (+/+) | 0.47 | Data warehouse, 26 |
| VRE positive / no VRE flag (+/−) | 0.03 | |
| VRE negative / VRE nag positive (−/+) | 0.53 | Data warehouse, 22 |
| VRE negative / no VRE flag (−/−) | 0.97 | |
| Work-up time: mean (SD): median [IQR]) | MGH data from Admitting Services | |
| Observation | 3 (3); 2 [1–4] | |
| General Care | 4 (4); 4 [2–6] | |
| Step-Down | 3 (3); 3 [2–4] | |
| Intensive Care Unit | 3 (3); 2 [2–3] | |
| Delays to bed. arrival: mean (SD): median [IQR]) | Data warehouse | |
| Initial bed | 2 (2); 1 [1–1] | |
| Transfer bed | 3 (3); 2 [1–3] |
MRSA, methicillin-resistant Staphylococcus aureus; VRE, vancomycin-resistant Enterococcus: SD, standard deviation; IQR, interquartile range; MGH, Massachusetts General Hospital.
Patient Arrivals
Arrival of patients into the model depends on hour of day and day of week (weekend vs. weekday, see Supplement Figure 1S). The average number of patients arriving by day and time was calculated; at each clock hour for each day, the model pulls the corresponding number of patients into the model as the expected value of a Poisson distribution (Figure 2). All modeled arrivals result in admissions.
Figure 2.
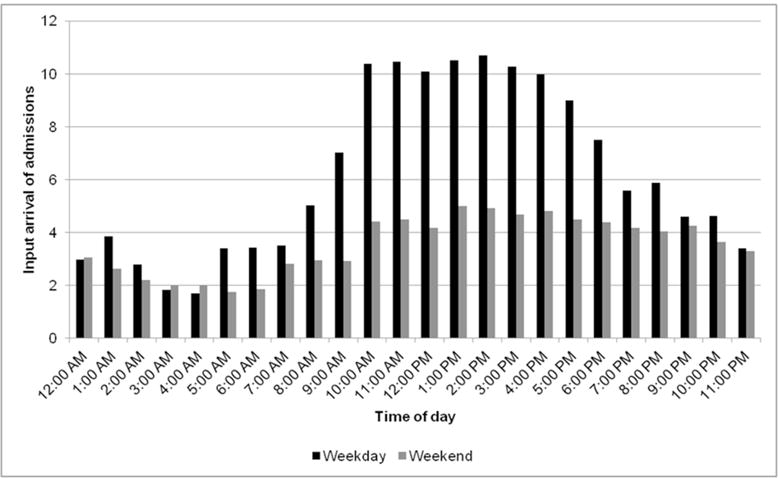
Input admissions by arrival time of day and day of week (weekday vs. weekend). The distribution of admitted patients by arrival time and day of week (weekday vs. weekend) is a model input and is derived from the data warehouse. At each time-step, the number of patients arriving in the model corresponds to the appropriate time of day and day of week.
Work-Up Time
Work-up time is the time between initial patient arrival and admission of the patient to the hospital. Input data to generate this distribution were only available for ED patients. The mean work-up time (hours) for patients requiring an Observation, General Care, Step-Down, and Intensive Care bed were 3±12, 4±16, 3±12, and 3±10, respectively. The work-up time distribution was applied to all patients awaiting their first inpatient bed assignment (Figure 3). When patients enter the acuity/service queue, they draw from a distribution of work-up time specific to their acuity.
Figure 3.
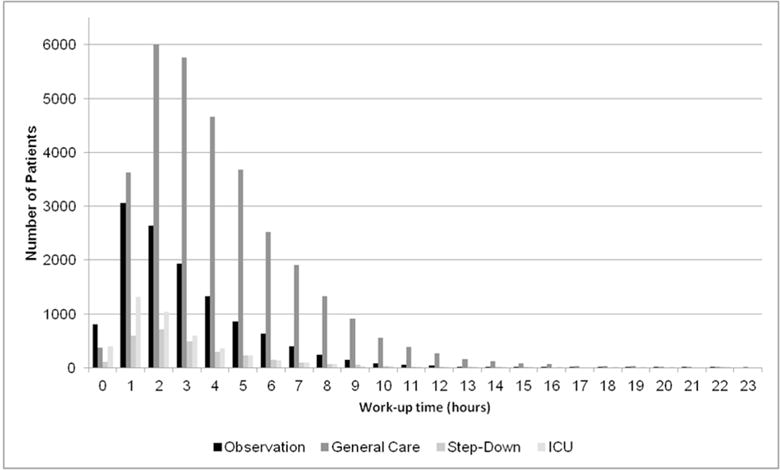
Work-up time input distribution by acuity on admission. The distribution of work-up time in hours by acuity on admission is a model input derived from Emergency Department data. Patients in the mode are assigned a work-up time based on a random draw from this distribution, conditional on their acuity on admission.
Delays to Bed Arrival
Delay to bed arrival is the time required for clinician-to-clinician pass-offs, transport, and other non-clinical administrative tasks prior to patient arrival in an initial or transfer bed, defined as any bed to which a patient was admitted after their initial admission location. The mean delays to initial and transfer beds were 2±5 and 3±10 hours, respectively (Figure 4).
Figure 4.
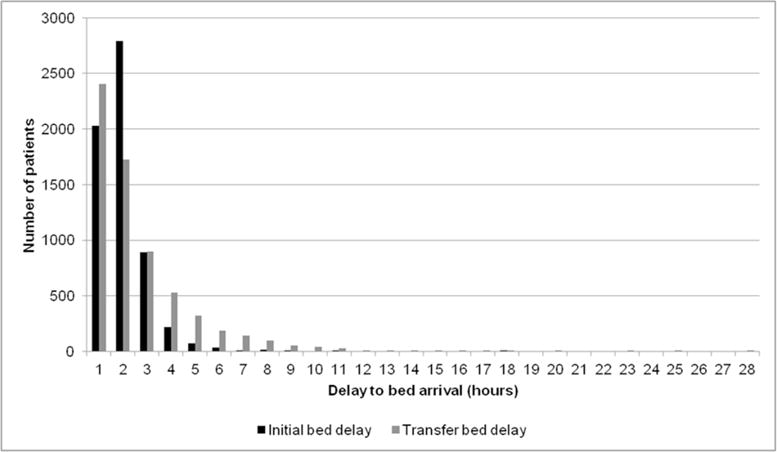
Delay to initial and transfer bed arrival input distribution. The distribution of delay to bed arrival in hours by initial and transfer bed is a model input derived from the data warehouse. Patients in the model are assigned a delay to bed arrival based on a random draw from this distribution, and conditional on whether or not they are queuing for their initial bed or are awaiting transfer to a second inpatient location.
Acuity Changes
Patient acuity change is determined by an acuity transition probability matrix based on the observed frequency of acuity changes in the observed data. The matrix reflects a patient’s relative likelihood of remaining in their current acuity or transitioning to other acuities and is dependent upon how long a patient has already been in their current acuity. Details regarding the construction of the matrix, which is modeled as a Markov chain, with hourly time steps, are provided (Supplement Section B).
Patient Discharges
Patient discharge is a probability dependent on hour of day, day of week, and current acuity, and is calculated by dividing the observed hourly frequency of discharges by the total number of patients, adjusted for acuity. The discharge date and time represents the physical departure time stamp, incorporating any administrative delays. Once a patient draws to be discharged, he/she then draws for their discharge destination (to home, facility, or death) derived from the observed data. Patients are eligible for discharge at any point during their encounter.
Hospital Structure
Each hospital unit was designated as either Observation, General Care, Step-down, or ICU, and characterized as medical or surgical. The final model included 14 Observation, 613 General Care (52% medical, 48% surgical), 57 Step-Down (63% medical, 37% surgery), and 98 ICU (35% medical, 65% surgery) beds (Figure 5).
Figure 5.
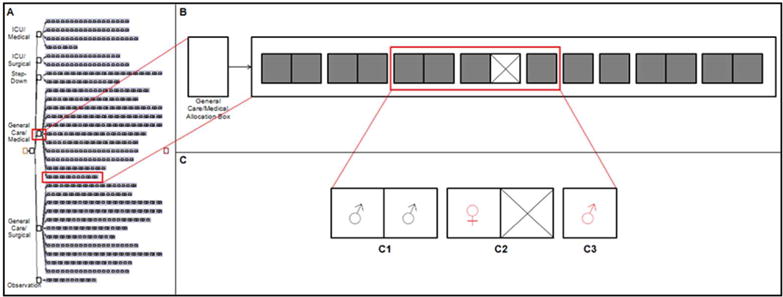
Model Structure. Panel A depicts the model structure including all service and acuity allocation boxes, and units for each acuity and allocation combination containing single-occupancy (single box, one bed) and double-occupancy (double box, two beds) rooms. Panel B shows one of the six service/acuity allocation boxes (General Care, Medical). Panel C shows a subset of three rooms (one private and two semi private) with a total of five inpatient beds occupied with patients of various gender and flag status requirements. The first semi private room (C1) contains two female patients with no flag for either MRSA or VRE. The second semi-private room (C2) contains a single male patient flagged for MRSA or VRE and a closed bed. The private room (C3) contains a single female patient with a flag for MRSA or VRE.
Measuring Model Outcomes
The model outcomes were defined and reported: time to bed arrival, length of stay, occupancy, idle beds, acuity-related transfers, rooms with discordant colonization, and transmission due to discordant colonization. Log-normal descriptors for the patient-level outcomes of time to bed arrival and length of stay were used, summarizing the distributions with the geometric means (i.e., anti-log transformation of the mean of the log-transformed times). Where applicable, the 90% coverage intervals for observed and model outcomes are reported (90% CI: 5th percentile to 95th percentile).
Time to Bed Arrival
The time to bed arrival output is a function of patient arrival, the distribution of patient characteristics, and the allocation algorithm. The model-generated geometric mean time to bed arrival and 90% CI are reported in hours.
Length of Stay
Length of stay is not pre-specified in the model. Instead, the model produces the length of stay, which is a function of patient arrival, the acuity transition probability matrix, and patient discharge. The model-generated geometric mean length of stay and 90% CI are reported in days.
Patient-Bed Acuity Mismatch
A patient-bed acuity mismatch occurs when patient acuity changes resulting in a mismatch with bed acuity. The model generates the mean number of patient-bed acuity mismatches per hour, stratified by mismatches where the patient requires a higher bed acuity and mismatches where the patient requires a lower bed acuity. These mismatches trigger entry into transfer queues and contribute to system congestion, preventing optimal allocation of resources.
Occupancy
Model occupancy is the number of bedded patients divided by the total number of beds. The mean occupancy (expressed as a percentage) and 90% CI are reported.
Idle Beds
Idle beds are reported as mean number of idle beds per hour, along with the 90% CI over 24 hours, and further categorized as attributable to MRSA/VRE flags or staffing constraints.
Acuity-Related Transfers
An acuity-related transfer is defined as a transfer of a bedded patient from one bed to another bed of a different acuity, and is a function of the patient characteristics and acuity transition probability matrix.
Rooms with Discordant Colonization
A room with discordant colonization is a double-occupancy room in which both occupants are matched on MRSA/VRE flags, but due to spontaneous clearance of colonization or unknown acquisition, they have discordant true colonization. Discordance between the flag and colonization can occur if: 1) a patient with no history of MRSA/VRE flag has true colonization; 2) a patient with a MRSA/VRE flag has cleared colonization spontaneously at some point prior to admission but they remain flagged; or 3) a false positive or false negative MRSA/VRE test result. Discordance between the flag and true colonization depends in part on how recently the patient was known to be colonized or infected [26] and test characteristics. This output is a function of patient characteristics, the proportion of patients recently flagged, and the bed allocation algorithm. The model generates the mean number of rooms with discordant colonization in each hour step. These rooms are unobserved; no validation metric is available.
Transmission due to Discordant Colonization
Transmission can occur in the setting of rooms with discordant colonization. We reviewed the literature on MRSA/VRE acquisition based on exposure to colonized roommates in double-occupancy rooms [27–31] and applied a conservative estimate of hourly probability of MRSA and VRE acquisition, 0.0005/hour exposed and 0.0006/hour exposed, respectively. We report the incident cases of MRSA/VRE colonization resulting over the course of a year.
Model Validation: face validity, internal validation, and external validation
Through an iterative and consultative process with content experts, the face validity of the model was established. During this process, bed allocation heuristics used internally by Admitting Services were introduced to the extent possible. For example, patients who were waiting for initial bed placement (i.e., in the emergency department or post-anesthesia care unit) had priority over already bedded patients for available inpatient beds and patients requiring ICU level care were prioritized over those requiring lower level care. Within-hospital transfers of patients undertaken to free up an idle bed due to MRSA/VRE flags were limited to a maximum of three patient moves within a single unit. Partially dependent external validation was performed to assess the fidelity of the model-simulated outcomes to the observed outcomes. Observed data were used to build part of the model but by themselves did not fully determine the outcomes to be validated [32]. For each observed outcome, the means over the two-year period included in the observed data were reported and compared to the mean simulated value and range.
Sensitivity and Scenario Analyses
One-way and multi-way sensitivity analyses were conducted through systematically altering selected inputs and assessing the impact on model outputs. Length of stay was additionally investigated through imposition of discharge holds on patients during the first several hours of admission. Finally, in order to investigate the impact of bedding arrangements on model outcomes, we created a version of the model with exclusively single-occupancy rooms.
Role of the Funders
The funding sources had no role in the study.
RESULTS
Internal Validation
The model accurately assigned patients to beds based on acuity, service, gender, and MRSA/VRE flags. It also accurately responded to changes in patient acuity and flags by resolving discordance between patient and bed characteristics.
External Validation
The model produced simulated results matched closely to observed data for the system outcomes tested.
Time to Bed Arrival
The distribution of the observed and model-generated time to bed arrival is shown (Figure 6). The observed geometric mean time to bed arrival was 6.7 hours and the model output ranged from 6.2 to 6.5 hours (90% CI: 2.0 to 18.0; Figure 2S).
Figure 6.
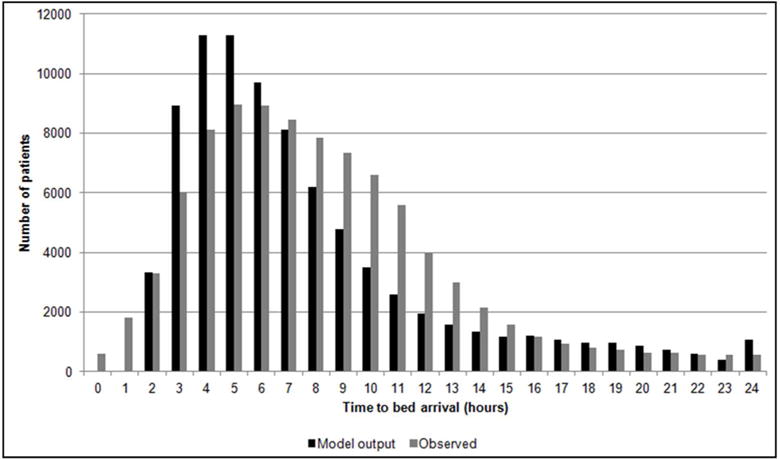
Distribution of time to bed arrival. The observed distribution of time to bed arrival in hours is compared to that of the model outcome of a randomly selected single simulation run. The minimum time to bed arrival in the model output is 2 hours, as all simulated patients require a single hour time step to arrive in the appropriate queue and are subjected to minimum delay to initial bed assignment of another single hour time step.
Length of Stay
The distribution of the observed and model-generated length of stay is shown (Figure 7). The observed geometric mean length of stay was 3.3 days and the model output ranged from 2.8 to 3.0 days (90% CI: 0.2 to 16.5; Figure 3S).
Figure 7.
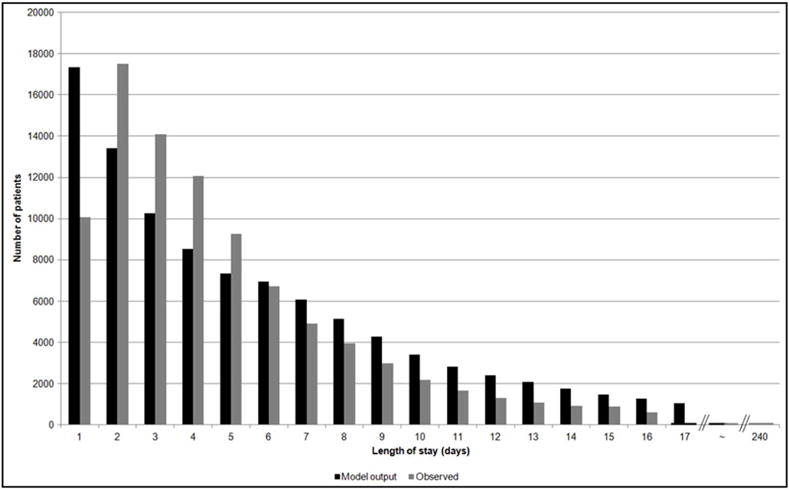
Distribution of length of stay. The observed distribution of length of stay in days is compared to that of the model outcome of a randomly selected single simulation run.
Patient-Bed Acuity Mismatches
Across runs, the mean number of patient-bed acuity mismatches where patient acuity exceeds the bed acuity ranged from 0.6 to 0.9 mismatches per hour. The mean number of patient-bed acuity mismatches where patient acuity is lower than the bed acuity ranged from 8.6 to 11.1 mismatches per hour. This reflects a snapshot of the prevalence of mismatches at any given time step.
Occupancy
The observed mean occupancy was 91%. Across runs, the model-generated mean occupancy ranged from 86% to 87% (90% CI: 81% to 93%; Figure 4S).
Idle Beds
The observed mean number of idle beds for any reason was 15.1 at each hour step, with 11.7 attributable to MRSA/VRE flags and 3.4 to staffing constraints. The model-generated mean total idle beds ranged from 14.3 to 15.7, with 10.7 to11.6 attributable to MRSA/VRE flags and 3.6 to 4.2 to staffing (Figure 8A).
Figure 8A.
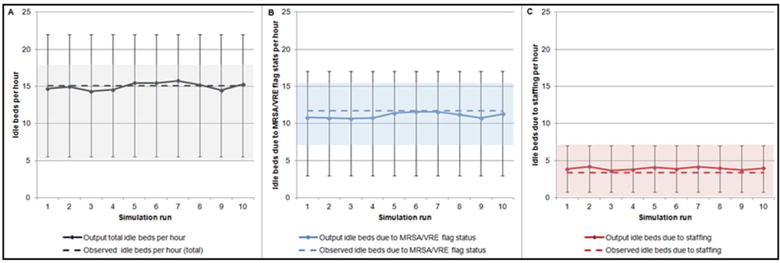
Idle beds. The observed mean number of total idle beds (15.1), idle beds due to MRSA/VRE flag status (11.7), and idle beds due to staffing (3.4) is compared to the mean number of model output total idle beds, idle beds due to MRSA/VRE flag status, and idle beds due to staffing across ten individual simulation runs in panels A, B, and C, respectively.
Acuity-Related Transfers
The observed mean number of acuity-related transfers was 27.2 transfers per day. The model-generated mean ranged from 22.6 to 23.7 (90%CI: 14.6 to 31.5; Figure 8B).
Figure 8B.
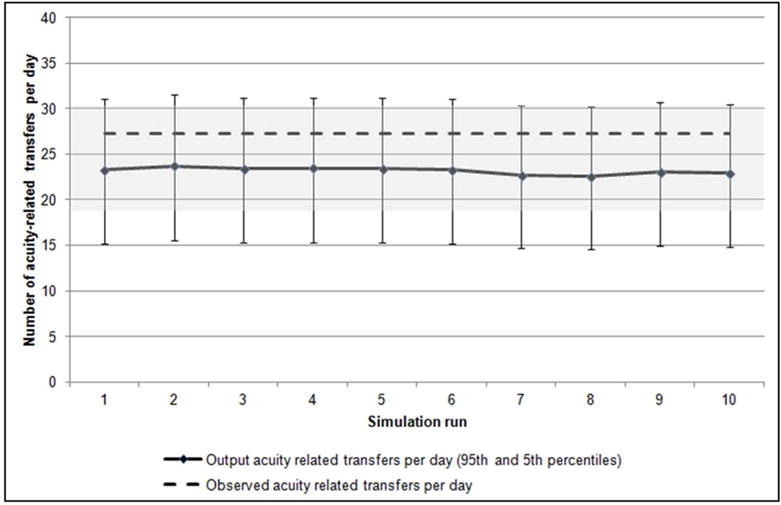
Acuity-related transfers per day. The observed mean number of acuity-related transfers per day (27.2) is compared to the mean number of acuity-related transfers per day output across ten individual simulation runs, along with markers showing the 90% coverage interval fit with a Poisson distribution within each run. The same 90% coverage interval (18.4–35.6) around the observed mean acuity-related transfers is shaded. The coefficient of variation (standard deviation standardized to its own mean) across the ten simulation runs was 1.6%.
Rooms with Discordant Colonization
The model-generated mean number of rooms with discordant colonization at each hour step ranged from 21.8 to 24.6.
Transmission due to Discordant Colonization
The model-generated mean number of newly colonized patients per year with MRSA and VRE was 48.2 and 74.3, respectively.
Sensitivity and Scenario Analyses
Time to bed arrival was most influenced by increasing the proportion of General Care patients on admission (6.3 to 72.6 hours), and extremes of both the work up time (4.1 to 25.1 hours) and delay to initial arrival distributions (5.1 to 26.0 hours; Figure 5S). Length of stay was most sensitive to alterations in the distribution of the delays to initial bed arrival (Figure 6S). Occupancy was most influenced by alterations in volume of arrivals (79% to 96%), and extremes of both the work up time (76% to 88%) and increasing discharge probability on weekends (78% to 87%; Figure 7S). Acuity-related transfers were most sensitive to alterations in volume of arrivals (1.5 to 23.6 transfers), and delays to initial and transfer bed arrival (16.4 to 23.5 and 17.9 to 23.9 transfers, respectively; Figure 8S).
Idle beds were similarly affected by alterations in volume of arrivals (from 5.1 to 24.1 beds) as well as increasing discharge probability on weekends (from 15.0 to 23.9 beds). All other input modifications resulted in more modest changes, but increases in MRSA/VRE flags to 20% uniformly resulted in increases in idle beds above the base case (Figure 9). Further, when MRSA prevalence was increased independently from 0% to 100% the impact of the flag status stabilized in the range of 9–10 idle beds due to MRSA/VRE flags until a prevalence of approximately 80%, at which point the number of idle beds decreased (Figure 9S). In multi-way sensitivity analyses, a combination of increasing the MRSA/VRE flag prevalence to 10% and altering the volume of arrivals had the largest observed impact on idle beds (Figure 10S).
Figure 9.
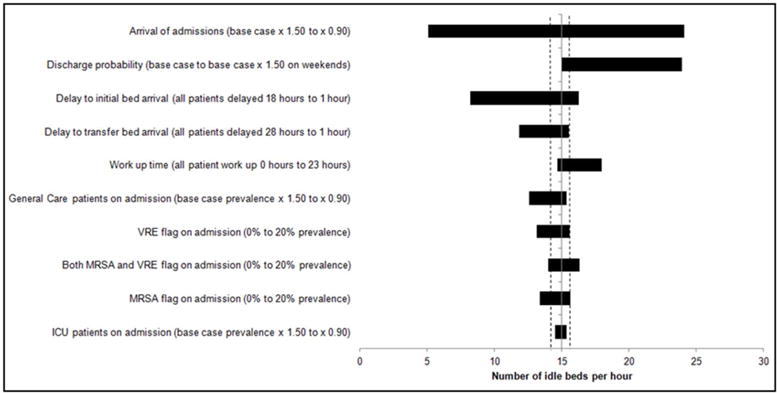
Results of one way sensitivity analysis around total idle beds. Shown are the effects of altering various input parameters on the number of idle beds per hour model output. The solid vertical line indicates the mean base case value (15.1 idle beds) across ten 1-year runs. On either side of this line are two dotted lines indicating the range across the ten 1-year base case runs. Each horizontal bar represents a single input parameter being altered, with the length of each bar representing the range of idle beds over the specified values for each input parameter modified.
Rooms with discordant colonization were most affected by alterations in the volume of arrivals (from 17 to 33 rooms) and flags, with increasing combined MRSA/VRE flag prevalence to 20% resulting in the largest impact (from 21 to 31 rooms; Figure 10). In multi-way sensitivity analyses, rooms with discordant colonization were most sensitive to a combination of increasing the MRSA/VRE flag prevalence to 20% and altering the volume of arrivals (Figure 11S).
Figure 10.
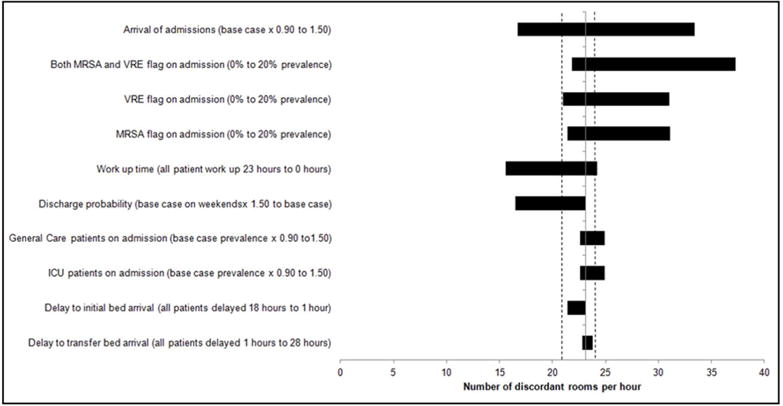
Results of one-way sensitivity analysis around rooms with discordant colonization. Shown are the effects of altering various input parameters on the number of rooms with discordant colonization per hour model output. The solid vertical line indicates the mean base case value (23.1 rooms with discordant colonization per hour) across ten 1-year runs. On either side of this line are two dotted lines indicating the range across the ten 1-year base case runs. Each horizontal bar represents a single input parameter being altered, with the length of each bar representing the range of idle beds over the specified values for each input parameter modified.
Imposing discharge holds of patients for the first four hours after arrival resulted in a model-generated LOS distribution similar to observed (Figures 12S and 13S), with relatively minor alterations in other outcomes (Table 1S).
In the single-occupancy rooms model, reductions in time to bed arrival (5.8 vs. 6.7 hours), length of stay (2.9 vs. 3.3 days), occupancy (73% vs. 91%), idle beds (0 vs. 15.1 beds per hour), and acuity-related transfers (25.2 vs. 27.2 transfers per day) were observed (data not shown).
DISCUSSION
We developed and validated a DES model of patient flow in a general hospital, incorporating MRSA/VRE flags in the allocation of patients to available beds based on CDC guidelines [10]. Using a historical cohort, the model was validated on operational outcomes, including time to bed arrival, length of stay, occupancy, idle beds, and acuity-related transfers.
One of the novelties of our model is the explicit incorporation of infection control designations as well as measurement of idle beds attributable to lack of patient-bed matches due to MRSA/VRE flags as well as staffing shortfalls. We found that capacity is most affected by idle beds due to MRSA/VRE, however staffing constraints are responsible for over 20% of these beds. We also reported on the incidence of rooms with discordant colonization, and this feature of the model, allows for policy makers to assess the potential impact of various strategies for documentation of clearance of colonization, on this important metric. The quantification of newly colonized patients resulting from between-roommate transmission has both clinical and policy implications. The estimates provided suggest that policies that do not accurately identify patient colonization status (either as a result of spontaneous clearance or acquisition) may be responsible for nosocomial transmission. Non-colonized patients cohorted with colonized or infected patients have an increased risk of acquisition from their roommate [27]. Further, given recent reports of facilities choosing to forgo implementation of contact precautions for flagged patients [33–35], our findings highlight the potential for such policies to result in undetected colonization and transmission.
Clinical studies in which patients with MRSA/VRE flags have been screened for persistent colonization have demonstrated that the administrative flag is a poor surrogate for colonization for both [21, 36–41]. The CDC, however, does not provide specific guidance on when and under what circumstances patients can be considered to be no longer colonized, and the flag status removed [10]. We have previously documented significant and substantial decreases in associated idle bed hours among patients in whom rapid, active surveillance for clearance of MRSA colonization was implemented [20]. Multiple studies have investigated potential increased risk of transmission to patients cohorted with colonized patients [27] as well as via contamination of environmental surfaces [42–44].
Screening of patients for MRSA/VRE is costly to implement, and there is a need to quantify the potential benefits prior to incurring the risks and expense of full implementation. The general literature on simulation and modeling in health care is substantial [45], but there is a need for more studies focused in infection control, motivated by real-world problems that clearly identify the trade-offs of alternative simulated solutions [46]. This need is particularly true in the setting of lack of national guidance on screening strategies in which the timing, diagnostic modality used, number of samples, body site sampled, and policy action based on results, are all expected to influence the costs and benefits. Well-validated and transparent models can provide insight into potential policy options, and allow for explicit estimates of the trade-offs of competing strategies.
The model-derived time to bed arrival and length of stay distributions differed from observed, most notably in the early time periods. These distributions are a complex output of a series of model assumptions and structures, including work-up time delays, delays to transfer, acuity changes, among others, many of which were examined through sensitivity analyses. These differences, however, at an individual patient-level, may be essentially insignificant (i.e., a difference of 20 minutes in time to bed arrival for the average patient). We found that altering the prevalence of MRSA/VRE flags had substantial effects on both idle beds and rooms with discordant colonization. Idle beds represent an inefficient use of resources at a time when inpatient bed capacity has contracted. While beds remain idle, patients awaiting admission may be exposed to avoidable harms through extended emergency department boarding, and patients awaiting within-hospital transfers may utilize higher-acuity resources when they are no longer needed. We found that preventing discharge within the first four hours of arrival resulted in a LOS distribution similar to observed, reflecting the fact that the early hours of admission are likely the most volatile with respect to patient clinical status. A single-occupancy only version of the model reduced the number of idle beds and eliminated rooms with discordant colonization. While occupancy declined in the model, in reality, the operational gains would most likely result in increased volume of patient admissions, and allow for an approximation to close to 100% occupancy [47].
Our study has limitations. While the model was built upon the physical structure of a single institution, we purposely simplified the hospital into a recognizable, widely-applicable acuity and service hierarchy in order to retain applicability and generalizability. Bed allocation heuristics are likely to differ from institution to institution, and while we included rules that we believe are reasonable, the model is flexible enough that changes to the rules of allocation can be made to align with local practice. This specific institution includes a combination of double-occupancy and single-occupancy beds, which is similar to the majority of hospitals in the United States. It is possible, however, that varying combinations of double-occupancy and single-occupancy rooms could affect the findings. Patient characteristics used as inputs to the model were based on our historical cohort, and thus may not be directly applicable to institutions with different patient populations. Input data for work-up time was available for ED patients only, however, we applied these data to all patients in the model, regardless of origin. We conducted sensitivity analyses across a wide range of possible work-up times to account for this limitation in available data. We were unable to validate the level of acuity of patients used for patient placement. We were also unable to validate the number of rooms with discordant colonization and transmission due to discordant colonization, as both are unknown. The model did not explore strategies to alter bed assignment prioritization, such as the use of buffer beds [14, 48] or first-come-first-serve [49]. Due to limitations of available data, and a change in the hospital structure with the opening of a new inpatient facility during the end of the second year of the study period, a full external validation was not possible.
The model presented, with explicit incorporation of MRSA/VRE flags can be used to investigate the potential impact of strategies that affect discordance between MRSA/VRE flags and true colonization and thus risk of nosocomial transmission. Models such as the one presented have the potential to provide support to optimize bed assignments in capacity-constrained environments as well as to assist in analysis of the impacts of infection control policy.
CONCLUSION
A DES model of patient flow in the hospital incorporating infection control designations can provide insights into operational impact of such designations. Diagnostic approaches for improving identification of patients who are no longer colonized with MRSA/VRE are needed.
Supplementary Material
Acknowledgments
This work was supported by the National Institute of Allergy and Infectious Diseases of the National Institutes of Health (K01AI110524 to E.S.S.) and The Institute for Health Technology Studies. This work was conducted with support from Harvard Catalyst | The Harvard Clinical and Translational Science Center (National Center for Research Resources and the National Center for Advancing Translational Sciences, National Institutes of Health Award UL1 TR001102) and financial contributions from Harvard University and its affiliated academic healthcare centers. The content is solely the responsibility of the authors and does not necessarily represent the official views of Harvard Catalyst, Harvard University and its affiliated academic healthcare centers, or the National Institutes of Health.
The authors would like to thank Kathryn M. Turcotte, MBA, and Benjamin Orcutt of the Massachusetts General Hospital Admitting Services Department; Victor Grishkan, Kirill Boyarin, Jerry Petrole and Joy Boulware of Information Systems and eMAR and Aaron Sacco of the MGH Pharmacy Department for their assistance in identifying antibiotic data; William Driscoll, MA and Milcho Nikolov, MSEE of the Department of Anesthesia, Critical Care and Pain Medicine; Jessica Cotter, MPH and Lauren R. West, MPH of the Massachusetts General Hospital Infection Control Unit; and Keith Jennings, MBA of the Massachusetts General Hospital, Joshua P. Metlay, MD of the Massachusetts General Hospital Division of General Internal Medicine, Eric M. Weil, MD of the General Medicine Unit, Benjamin A. White, MD of the Emergency Medicine, and Nikos Trichakis, PhD of the Harvard Business School for helpful discussions in the development of the model. Finally, the authors would like to thank the members of Dr. Shenoy’s K01 Scientific Advisory Board: Stephen B. Calderwood, MD of the Massachusetts General Hospital Division of Infection Diseases, Robert S. Huckman, PhD of the Harvard Business School, Thomas Lee, MD, MSc of Press Garney Associates, Inc., Eric Rosenberg, MD of the Massachusetts General Hospital Clinical Microbiology Laboratories, and Joseph P. Newhouse, PhD of the Harvard University Division of Health Policy Research and Education.
Financial support for this study was provided entirely by a grant from the National Institute of Allergy and Infectious Diseases of the National Institutes of Health. The funding agreement ensured the authors’ independence in designing the study, interpreting the data, writing, and publishing the report.
Footnotes
Presentation at Meetings: This research was presented in poster abstract form at ID Week 2014 (October 2014; #319) and as an oral abstract at the 36th Annual North American Meeting of the Society for Medical Decision Making (October 2014; #5N-5).
References
- 1.Statistics, N.C.f.H. Health, United States, 2014: With Special Feature on Adults Aged. Hyattsville, MD: 2015. pp. 55–64. [PubMed] [Google Scholar]
- 2.Hing EB,F. NCHS data brief. National Center for Health Statistics; 2012. Wait time for treatment in hospital emergency departments: 2009. [PubMed] [Google Scholar]
- 3.The State of America’s Hospitals: Taking the Pulse. American Hospital Association; 2010. [Google Scholar]
- 4.Bernstein SL, et al. The effect of emergency department crowding on clinically oriented outcomes. Acad Emerg Med. 2009;16(1):1–10. doi: 10.1111/j.1553-2712.2008.00295.x. [DOI] [PubMed] [Google Scholar]
- 5.Pines JM, et al. The association between emergency department crowding and hospital performance on antibiotic timing for pneumonia and percutaneous intervention for myocardial infarction. Acad Emerg Med. 2006;13(8):873–8. doi: 10.1197/j.aem.2006.03.568. [DOI] [PubMed] [Google Scholar]
- 6.Guttmann A, et al. Association between waiting times and short term mortality and hospital admission after departure from emergency department: population based cohort study from Ontario, Canada. Bmj. 2011;342:d2983. doi: 10.1136/bmj.d2983. [DOI] [PMC free article] [PubMed] [Google Scholar]
- 7.Jarvis WR, Jarvis AA, Chinn RY. National prevalence of methicillin-resistant Staphylococcus aureus in inpatients at United States health care facilities, 2010. Am J Infect Control. 2012;40(3):194–200. doi: 10.1016/j.ajic.2012.02.001. [DOI] [PubMed] [Google Scholar]
- 8.Ramsey AM, Zilberberg MD. Secular trends of hospitalization with vancomycin-resistant enterococcus infection in the United States, 2000–2006. Infect Control Hosp Epidemiol. 2009;30(2):184–6. doi: 10.1086/593956. [DOI] [PubMed] [Google Scholar]
- 9.Jochimsen EM, et al. Control of vancomycin-resistant enterococci at a community hospital: efficacy of patient and staff cohorting. Infect Control Hosp Epidemiol. 1999;20(2):106–9. doi: 10.1086/501598. [DOI] [PubMed] [Google Scholar]
- 10.Siegel JD, et al. 2007 Guideline for Isolation Precautions: Preventing Transmission of Infectious Agents in Health Care Settings. Am J Infect Control. 2007;35(10 Suppl 2):S65–164. doi: 10.1016/j.ajic.2007.10.007. [DOI] [PMC free article] [PubMed] [Google Scholar]
- 11.Shenoy ES, Lee H, Hou T, et al. The impact of methicillin-resistant Staphylococcus aureus (MRSA) and vancomycin-resistant Enterococcus (VRE) flags on hospital operations. Infect Control Hosp Epidemiol. 2016;37:782–90. doi: 10.1017/ice.2016.54. [DOI] [PMC free article] [PubMed] [Google Scholar]
- 12.Devapriya P, et al. StratBAM: A Discrete-Event Simulation Model to Support Strategic Hospital Bed Capacity Decisions. J Med Syst. 2015;39(10):130. doi: 10.1007/s10916-015-0325-0. [DOI] [PubMed] [Google Scholar]
- 13.Comas M, et al. Discrete-Event Simulation Applied to Analysis of Waiting Lists. Evaluation of a Prioritization System for Cataract Surgery. Value in Health. 2008;11(7):1203–1213. doi: 10.1111/j.1524-4733.2008.00322.x. [DOI] [PubMed] [Google Scholar]
- 14.Proudlove NC, Gordon K, Boaden R. Can good bed management solve the overcrowding in accident and emergency departments? Emerg Med J. 2003;20(2):149–55. doi: 10.1136/emj.20.2.149. [DOI] [PMC free article] [PubMed] [Google Scholar]
- 15.Holm LB, Luras H, Dahl FA. Improving hospital bed utilisation through simulation and optimisation: with application to a 40% increase in patient volume in a Norwegian General Hospital. Int J Med Inform. 2013;82(2):80–9. doi: 10.1016/j.ijmedinf.2012.05.006. [DOI] [PubMed] [Google Scholar]
- 16.Kolker A. Process modeling of emergency department patient flow: effect of patient length of stay on ED diversion. J Med Syst. 2008;32(5):389–401. doi: 10.1007/s10916-008-9144-x. [DOI] [PubMed] [Google Scholar]
- 17.Kolker A. Process modeling of ICU patient flow: effect of daily load leveling of elective surgeries on ICU diversion. J Med Syst. 2009;33(1):27–40. doi: 10.1007/s10916-008-9161-9. [DOI] [PubMed] [Google Scholar]
- 18.Bair AE, et al. The impact of inpatient boarding on ED efficiency: a discrete-event simulation study. J Med Syst. 2010;34(5):919–29. doi: 10.1007/s10916-009-9307-4. [DOI] [PMC free article] [PubMed] [Google Scholar]
- 19.Berg B, et al. A discrete event simulation model to evaluate operational performance of a colonoscopy suite. Med Decis Making. 2010;30(3):380–7. doi: 10.1177/0272989X09345890. [DOI] [PubMed] [Google Scholar]
- 20.Shenoy ES, et al. Impact of rapid screening for discontinuation of methicillin-resistant Staphylococcus aureus contact precautions. Am J Infect Control. 2016;44(2):215–21. doi: 10.1016/j.ajic.2015.08.019. [DOI] [PMC free article] [PubMed] [Google Scholar]
- 21.Shenoy ES, et al. Discontinuation of contact precautions for methicillin-resistant staphylococcus aureus: a randomized controlled trial comparing passive and active screening with culture and polymerase chain reaction. Clin Infect Dis. 2013;57(2):176–84. doi: 10.1093/cid/cit206. [DOI] [PMC free article] [PubMed] [Google Scholar]
- 22.Davis KA, et al. Methicillin-resistant Staphylococcus aureus (MRSA) nares colonization at hospital admission and its effect on subsequent MRSA infection. Clin Infect Dis. 2004;39(6):776–82. doi: 10.1086/422997. [DOI] [PubMed] [Google Scholar]
- 23.Ziakas PD, Anagnostou T, Mylonakis E. The prevalence and significance of methicillin-resistant Staphylococcus aureus colonization at admission in the general ICU Setting: a meta-analysis of published studies. Crit Care Med. 2014;42(2):433–44. doi: 10.1097/CCM.0b013e3182a66bb8. [DOI] [PubMed] [Google Scholar]
- 24.Paule SM, et al. Chromogenic media vs real-time PCR for nasal surveillance of methicillin-resistant Staphylococcus aureus: impact on detection of MRSA-positive persons. Am J Clin Pathol. 2009;131(4):532–9. doi: 10.1309/AJCP18ONZUTDUGAQ. [DOI] [PubMed] [Google Scholar]
- 25.D’Agata EM, et al. High rate of false-negative results of the rectal swab culture method in detection of gastrointestinal colonization with vancomycin-resistant enterococci. Clin Infect Dis. 2002;34(2):167–72. doi: 10.1086/338234. [DOI] [PubMed] [Google Scholar]
- 26.Shenoy ES, et al. Natural history of colonization with methicillin-resistant Staphylococcus aureus (MRSA) and vancomycin-resistant Enterococcus (VRE): a systematic review. BMC Infect Dis. 2014;14:177. doi: 10.1186/1471-2334-14-177. [DOI] [PMC free article] [PubMed] [Google Scholar]
- 27.Moore C, et al. Risk factors for methicillin-resistant Staphylococcus aureus (MRSA) acquisition in roommate contacts of patients colonized or infected with MRSA in an acute-care hospital. Infect Control Hosp Epidemiol. 2008;29(7):600–6. doi: 10.1086/588567. [DOI] [PubMed] [Google Scholar]
- 28.Drees M, et al. Research Methods in Healthcare Epidemiology and Antimicrobial Stewardship: Use of Administrative and Surveillance Databases. Infection Control & Hospital Epidemiology. 2016;37(11):1278–1287. doi: 10.1017/ice.2016.189. [DOI] [PubMed] [Google Scholar]
- 29.Zhou Y, et al. Phenotypic and genotypic analysis of Clostridium difficile isolates: a single-center study. J Clin Microbiol. 2014;52(12):4260–6. doi: 10.1128/JCM.02115-14. [DOI] [PMC free article] [PubMed] [Google Scholar]
- 30.Hamel M, Zoutman D, O’Callaghan C. Exposure to hospital roommates as a risk factor for health care-associated infection. Am J Infect Control. 2010;38(3):173–81. doi: 10.1016/j.ajic.2009.08.016. [DOI] [PubMed] [Google Scholar]
- 31.Ng W, et al. Too close for comfort: screening strategy to detect methicillin-resistant Staphylococcus aureus conversion in exposed roommates. Am J Infect Control. 2012;40(9):883–5. doi: 10.1016/j.ajic.2011.11.007. [DOI] [PubMed] [Google Scholar]
- 32.Eddy DM, et al. Model transparency and validation: a report of the ISPOR-SMDM Modeling Good Research Practices Task Force-7. Med Decis Making. 2012;32(5):733–43. doi: 10.1177/0272989X12454579. [DOI] [PubMed] [Google Scholar]
- 33.Martin EM, et al. Elimination of Routine Contact Precautions for Endemic Methicillin-Resistant Staphylococcus aureus and Vancomycin-Resistant Enterococcus: A Retrospective Quasi-Experimental Study. Infect Control Hosp Epidemiol. 2016:1–8. doi: 10.1017/ice.2016.156. [DOI] [PMC free article] [PubMed] [Google Scholar]
- 34.Morgan DJ, et al. Reconsidering contact precautions for endemic methicillin-resistant Staphylococcus aureus and vancomycin-resistant Enterococcus. Infect Control Hosp Epidemiol. 2015;36(10):1163–72. doi: 10.1017/ice.2015.156. [DOI] [PubMed] [Google Scholar]
- 35.Russell D, et al. Routine Use of Contact Precautions for Methicillin-Resistant Staphylococcus aureus and Vancomycin-Resistant Enterococcus: Which Way Is the Pendulum Swinging? Infect Control Hosp Epidemiol. 2016;37(1):36–40. doi: 10.1017/ice.2015.246. [DOI] [PubMed] [Google Scholar]
- 36.Montecalvo MA, et al. Natural history of colonization with vancomycin-resistant Enterococcus faecium. Infect Control Hosp Epidemiol. 1995;16(12):680–5. doi: 10.1086/647041. [DOI] [PubMed] [Google Scholar]
- 37.Park I, et al. Rectal culture screening for vancomycin-resistant enterococcus in chronic haemodialysis patients: false-negative rates and duration of colonisation. J Hosp Infect. 2011;79(2):147–50. doi: 10.1016/j.jhin.2011.04.011. [DOI] [PubMed] [Google Scholar]
- 38.D’Agata EM, et al. Vancomycin-resistant enterococci among chronic hemodialysis patients: a prospective study of acquisition. Clin Infect Dis. 2001;32(1):23–9. doi: 10.1086/317549. [DOI] [PubMed] [Google Scholar]
- 39.Byers KE, et al. Duration of colonization with vancomycin-resistant Enterococcus. Infect Control Hosp Epidemiol. 2002;23(4):207–11. doi: 10.1086/502036. [DOI] [PubMed] [Google Scholar]
- 40.Vikram HR, et al. Discontinuation of contact precautions for patients no longer colonized with methicillin-resistant Staphylococcus aureus. Infect Control Hosp Epidemiol. 2010;31(5):541–3. doi: 10.1086/652455. [DOI] [PubMed] [Google Scholar]
- 41.Wassenberg MW, et al. Rapid diagnostic testing of methicillin-resistant Staphylococcus aureus carriage at different anatomical sites: costs and benefits of less extensive screening regimens. Clin Microbiol Infect. 2011;17(11):1704–10. doi: 10.1111/j.1469-0691.2011.03502.x. [DOI] [PubMed] [Google Scholar]
- 42.Datta R, et al. Environmental cleaning intervention and risk of acquiring multidrug-resistant organisms from prior room occupants. Arch Intern Med. 2011;171(6):491–4. doi: 10.1001/archinternmed.2011.64. [DOI] [PubMed] [Google Scholar]
- 43.Hardy KJ, et al. A study of the relationship between environmental contamination with methicillin-resistant Staphylococcus aureus (MRSA) and patients’ acquisition of MRSA. Infect Control Hosp Epidemiol. 2006;27(2):127–32. doi: 10.1086/500622. [DOI] [PubMed] [Google Scholar]
- 44.Nseir S, et al. Risk of acquiring multidrug-resistant Gram-negative bacilli from prior room occupants in the intensive care unit. Clin Microbiol Infect. 2011;17(8):1201–8. doi: 10.1111/j.1469-0691.2010.03420.x. [DOI] [PubMed] [Google Scholar]
- 45.Brailsford SC, et al. An analysis of the academic literature on simulation and modelling in health care. Journal of Simulation. 2009;3(3):130–140. [Google Scholar]
- 46.Taylor SJE, et al. Simulation modelling is 50! Do we need a reality check? Journal of the Operational Research Society. 2009;60(1):S69–S82. [Google Scholar]
- 47.Bobrow MT,J. Inpatient care facilities. In: RLS Kobus RL, Bobrow M, Thomas J, Payette TM, Klimet SA, editors. Bulding Type Basics for Healthcare Facilities. John Wilfey and sons; New York, NY: 2000. pp. 131–92. [Google Scholar]
- 48.Mur-Veeman I, Govers M. Buffer management to solve bed-blocking in the Netherlands 2000–2010. Cooperation from an integrated care chain perspective as a key success factor for managing patient flows. Int J Integr Care. 2011;11:e080. doi: 10.5334/ijic.650. Spec 10th Anniversary Ed. [DOI] [PMC free article] [PubMed] [Google Scholar]
- 49.Shmueli A, Sprung CL, Kaplan EH. Optimizing admissions to an intensive care unit. Health Care Manag Sci. 2003;6(3):131–6. doi: 10.1023/a:1024457800682. [DOI] [PubMed] [Google Scholar]
Associated Data
This section collects any data citations, data availability statements, or supplementary materials included in this article.


