Abstract
Background
The misuse of prescription opioids (MUPO) is a leading public health concern. Social media are playing an expanded role in public health research, but there are few methods for estimating established epidemiological metrics from social media. The purpose of this study was to demonstrate that the geographic variation of social media posts mentioning prescription opioid misuse strongly correlates with government estimates of MUPO in the last month.
Methods
We wrote software to acquire publicly available tweets from Twitter from 2012 to 2014 that contained at least one keyword related to prescription opioid use (n = 3,611,528). A medical toxicologist and emergency physician curated the list of keywords. We used the semantic distance (SemD) to automatically quantify the similarity of meaning between tweets and identify tweets that mentioned MUPO. We defined the SemD between two words as the shortest distance between the two corresponding word-centroids. Each word-centroid represented all recognized meanings of a word. We validated this automatic identification with manual curation. We used Twitter metadata to estimate the location of each tweet. We compared our estimated geographic distribution with the 2013–2015 National Surveys on Drug Usage and Health (NSDUH).
Results
Tweets that mentioned MUPO formed a distinct cluster far away from semantically unrelated tweets. The state-by-state correlation between Twitter and NSDUH was highly significant across all NSDUH survey years. The correlation was strongest between Twitter and NSDUH data from those aged 18–25 (r = 0.94, p < 0.01 for 2012; r = 0.94, p < 0.01 for 2013; r = 0.71, p = 0.02 for 2014). The correlation was driven by discussions of opioid use, even after controlling for geographic variation in Twitter usage.
Conclusions
Mentions of MUPO on Twitter correlate strongly with state-by-state NSDUH estimates of MUPO. We have also demonstrated that a natural language processing can be used to analyze social media to provide insights for syndromic toxicosurveillance.
Electronic supplementary material
The online version of this article (doi:10.1007/s13181-017-0625-5) contains supplementary material, which is available to authorized users.
Keywords: Social media, Epidemiology, Misuse, Opioids, Natural language processing, Computational linguistics
Introduction
Approximately 35 million Americans over age 12 used prescription opioids for nonmedical reasons at least once in the last year [1]. The misuse of prescription opioids (MUPO) is associated with adverse hormonal and immune system effects, abuse, and addiction [2]. American healthcare costs of MUPO increased from $53.4 billion in 2006 [3] to $70.4 billion in 2013 [4].
Americans turn to online resources and social networks to discuss healthcare issues; 72% of US web users have sought health information online within the past 12 months; 34% of adult web users have read or shared health concerns or commentary on social platforms [5, 6]. Nearly three out of four Americans use at least one social networking site [7].
Social media platforms, such as Twitter, Facebook, or YouTube, facilitate the exchange of short messages, via desktop, laptop, tablet, or smartphone. Messages exchanged on these platforms have previously been successfully analyzed for syndromic surveillance of infectious diseases [8] and sentiment analysis of the treatment of migraine headaches [9]. Twitter is an online news and social networking service where users post messages, called “tweets,” and reply to tweets that others send. Tweets are limited to 140 characters. Anyone can read publicly posted tweets. Only registered users can post tweets. Users access Twitter through its website interface or mobile device app. Among social networks, the microblogging platform of Twitter offers several advantages for digital epidemiology; its users tend to write frequent, short messages (tweets) on a wide variety of topics, users often indicate their location and other demographic information, messages are publicly searchable, by default, and the Twitter platform is frequently used via desktops, laptops, and mobile devices [10]. The use of social media to study the epidemiology of drug use has focused on using social media as a source of material for qualitative analysis, as a means to digitally acquire large amounts of data, often from online forums, that experts then process entirely manually. Prior analyses include an exploration of the demographics of well-defined communities [11], the frequencies of keywords related to stimulant abuse [12] or alcohol [13], and surveys of drugs mentioned in online discussion forums [14]. A limitation of all of these studies is that comparing the findings of these studies to established findings is not straightforward; for example, it is difficult to relate the frequency of words to prevalence of use in the population. This difficulty hinders validation of social media as an emerging data source for public health research.
Our aim was to determine whether Twitter could provide data on MUPO that agreed with government survey data, establishing Twitter as a potential longitudinal source for syndromic surveillance. We used the National Survey on Drug Usage and Health (NSDUH) as our standard for comparison. The NSDUH is conducted by professional interviewers, confidentially surveying residents from a random sample of US households, in person, over the course of about an hour about their substance use [1]. Each year, NSUDH surveys approximately 70,000 people. A secondary objective was to evaluate the potential of social media for toxicosurveillance in a scalable and automated fashion so that our approach could be readily adapted and extended. We hypothesized that the geographic distribution of tweets about MUPO would closely correspond to that of NSDUH survey data about MUPO.
Methods
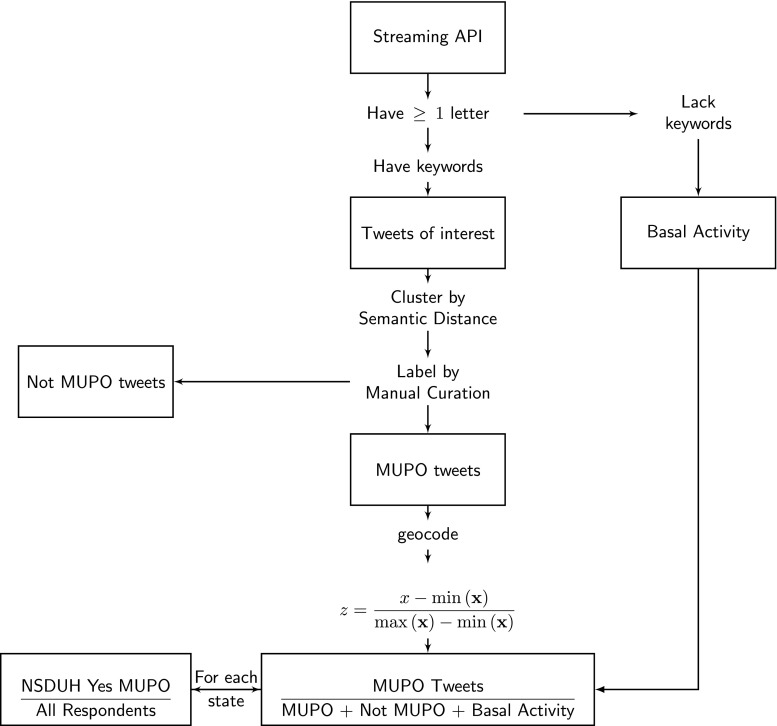
We performed a prospective study of the incidence of discussions on MUPO using publicly available data from Twitter. The Institutional Review Board (IRB) approved this study at the authors’ institutions. Figure 1 outlines the study. We analyzed tweets from January 2012 to December 2014, coinciding with the data collection period for the 2013, 2014, and 2015 National Surveys on Drug Usage and Health (NSDUH). Table 1 briefly defines some terms from Big Data analysis and natural language processing that may be unfamiliar to the reader.
Fig. 1.
Study design. Data are collected from Twitter via Twitter’s Streaming API. Tweets having less than one character are excluded. Tweets are filtered into "signal" tweets (tweets of interest) if they have keywords; otherwise, into "basal activity". MUPO tweets are identified by clustering on SemD and validated by expert curation. A scaled version of the fraction of MUPO tweets in each state is compared with the NSDUH estimate for that same state
Table 1.
Selected terms associated with Big Data analyses
| Term | Description |
|---|---|
| Lemma | The form of the word, without inflections, that would be found in the dictionary, for example “child” not “children” |
| Stopword | A word with no intrinsic semantic value, for example, “a,” “the,” “of.” Additional words may be stopwords in one context but not another. |
| API | Application Program Interface; method to allow programs to access the data of other programs without human interface |
| Ontology | A formal description of the semantic relationship between words |
| GitHub repository | An online cloud storage and code-sharing community. Resource for open-source software |
| Semantic similarity | A quantification of the similarity in meaning between two phrases |
| Twitter Streaming API | An API that provides real-time access to tweets. As soon as a user emits a publicly available tweet, it becomes available to the Streaming API. |
| Semantic similarity matrix | A two-dimensional grid where each square denotes the semantic similarity between two pieces of text (tweets in this context). Each square in the grid is specified by two co-ordinates, canonically called the ith and jth coordinates, counting from 0. For example, the lower right square of a 2 × 2 grid would be identified as 11. |
| Centroid | Mean position of all points in a cluster, analogous to center of mass in physical objects. |
Tweet Preprocessing
Twitter provides an application programming interface (API) that enables programmatic consumption of its data. An API is an access point allowing researchers to collect automatically data that have been made publicly available. The Twitter Streaming API allows unrestricted access to all public tweets matching any given filter criteria in real time. For example, using the keyword filter of “Adderall,” all tweets mentioning that substance are collected. We acquired two types of tweets from Twitter, tweets that contained the keywords in Table S1 (signal tweets) and those that contained at least one alphanumeric character (basal tweets). Using langdetect [15], an open-source Python module built on Google’s language detection algorithm, we restricted data collection to only English language tweets. For each tweet, we converted all words to their dictionary form (lemma) using nltk (a package for natural language processing in Python [16]), removed stopwords, and converted all text to lowercase, as follows:
Lemmatization: All words in the tweet were converted to their associated lemma, or dictionary form. Lemmatization reduces the inflected forms of a word to a common base form, taking context and meaning into account (e.g., better becomes good, saw becomes see if used as a verb and saw if used as a noun). Lemmatization thus allows similar words to be grouped together and treated as a single item.
Stopword removal: Stopwords are words deemed irrelevant or carrying little to no information in a given context, and that can thus be removed. In general, the most common word and words with only grammatical functions (e.g., the, and, is, at, on, that) qualify as stopwords. Specific applications may call for additional stopwords. The list of stopwords we removed from our English language tweets is available on request and at our GitHub repository.
Lowercase conversion: All text was converted to lowercase. Although not strictly necessary, this simplifies computer-based word comparisons.
Comparing Tweets
To quantify the similarity in meaning (semantic similarity) between tweets, we used a straightforward extension of Jiang-Conrath similarity [17]. The Jiang-Conrath similarity quantifies the similarity between two words as proportional to the distance in WordNet to the nearest hypernym common to both words. WordNet [18] is a widely used map of semantic relations among English words that has been extensively validated and is actively maintained. One common way to visualize WordNet is as a grid where similar meanings of words occupy closer positions on the grid. One word is a hypernym of another word if the first word has a more general meaning that includes the second word. For example, color is a hypernym of red and bird is a hypernym of pigeon. Our extension, which we termed the semantic distance (SemD), rests on the concept that the more similar in meaning two words are, the more synonyms they share. Our SemD calculates the semantic similarity between two words as the weighted combination of the Jiang-Conrath similarity between those two words and the Jiang-Conrath similarity between all pairs of synonyms of those two words. In the next section, we discuss how we determined the weighting factors. In keeping with terminology from machine learning, we termed the weighting factors the semantic kernel (see Supplemental section “Jiang-Conrath Similarity and WordNet” for more detail).
Computing the Context of Tweets
The context in which a word occurs helps specify which meanings of that word are most germane. We took context into account by weighting the combinations of meanings of each word by the relative frequency with which all synonyms of the meaning of a word occur in the text. For example, if a text excerpt contains twice as many words pertaining to drugs as to aviation, then the meaning of high as in intoxicated with marijuana receives twice as much weight as as high as in elevated in altitude. We excluded tweets for which we could not calculate the SemD (3.2% for 2012, 2.5% for 2013, and 3.1% for 2014), generally because those tweets contain too few recognizable words (for example, “onereallylongword” cannot be processed, whereas “one really long word” can).
We identified clusters of tweets as tweets with correlated semantic distance values, using k-means clustering [19]. To increase objectivity, we identified the number of clusters as that number that maximized the silhouette coefficient [20], a parameter-free measure of the goodness of separation of data for a given number of clusters. The silhouette coefficient ranges between −1 and 1, with −1 indicating that clusters completely overlap and 1 indicating that the clusters are completely separate. The number of clusters that maximizes the silhouette coefficient is the most likely number of clusters in the data. As an example on more familiar terms, a perfect diagnostic test would have a silhouette coefficient of 1, completely separating those with the disease from those without.
Tweet Curation
Independently, one emergency physician (NG) and one medical toxicologist (AM) manually curated the same 5% random sample of all tweets we acquired, rating each tweet as “related or “not related” to MUPO.” We did this to identify whether the clusters identified using SemD had any toxicologic meaning. Two examples of tweets rated as “related to MUPO”—censored for profanity but not for nonstandard orthography—are as follows:
420 blaze it How abot yo grow up and shoot heroin like an adlt, oxy sh*t
percocet’s keep me motivated, good weed keep me motivated
Examples of tweets rated as “not related to MUPO” are as follows:
Knee x-rayed and been given some pain killers. Waiting to see dr now. Was such a lovely afternoon.
Thank yo! Hx How are you today? I hope everything is amazing.
Try something new today (not heroin) and f*ck the world. ☺☺
Today I get to place a british boy, a heroin addict, and a bookish girl next door in one day.
Geocoding Tweets
We estimated a tweet’s location in three ways. If metadata contained latitude and longitude coordinates, we directly used them. In our sample, approximately 2% of tweets contained explicit coordinates of latitude and longitude. This level of explicit geocoding is consistent with prior studies [21, 22]. For the remaining tweets, we used Carmen [23], an algorithm that estimates the location of the user based on the user’s connections, tweets, and metadata. If a tweet and its metadata contained too little data for Carmen to estimate the location with greater than 80% probability, we added tweets from that user’s profile until the probability exceeded 80%. Using Carmen allowed us to identify the geolocation of an additional 12% of tweets.
Scaling
To compare data from NSDUH and Twitter, we scaled each data set by the population in each state. For NSDUH, we divided the number of respondents in each state who endorsed MUPO by the total number of respondents in that state. For Twitter, we divided the number of MUPO tweets by the total number of tweets geolocated to that state. To allow comparison on the same scale, we scaled each data set by the formula z = (x − min(x)) / (max(x) − min(x)), where min (or max) refers to the minimum (maximum) and x refers to the Twitter or NSUDH data set. The resulting variables range between 0 and 1.
Sample Size Calculation
Our central statistical test is a comparison of the difference between two proportions with independent samples. We chose our chance of false positives (alpha) at 0.01. We adjusted this alpha for the simultaneous comparison of three hypotheses (whether Twitter and NSDUH were comparable for each age group defined by NSDUH) using a Bonferroni correction factor of 3, yielding a final alpha of 0.0033. We chose our initial chance of false negatives (beta) at 0.01, yielding a power (1-beta) of 99%. We chose a more stringent than usual power, in consideration of the novelty of the approach. Choosing a more stringent power also mitigates the effect of unequal sample sizes on the chance of false negatives. Using estimates from the previous 10 NSDUH, we estimated the prevalence of MUPO to be around 2%. We assumed that the Twitter rate would be comparable, i.e., 1.9 to 2.1%. We chose this small difference so that our study would be powered to detect even small differences between Twitter and NSDUH. A sample size calculation using those parameters yielded a suggested sample size of 1,696,621 across all age groups for each year. While we had no control over the number of respondents in NSDUH, we obtained the extra n necessary from Twitter.
Principal Component Analysis
Principal component analysis (PCA) identifies the largest sources of variance in the data and allows high-dimensional data to be visualized in two dimensions [24]. PCA projects the data onto new axes, termed “principal components.” In contrast to the original axes, the principal components are linearly independent. The principal components of a circle, for example, are not the x- and y-axes, but the polar coordinates (radius and angle). PCA is conceptually similar to performing multivariate regression while simultaneously identifying and controlling for confounding variables and collinearity. A limitation of PCA is that it cannot account for nonlinear interactions.
Software
All analyses were performed with available open-source software or custom software (written by MC) in the Python programming language [25]. All code is available upon request and posted publicly at the GitHub repository http://github.com/mac389/Toxic . The terms of service of Twitter prohibit sharing the actual tweets and metadata.
Results
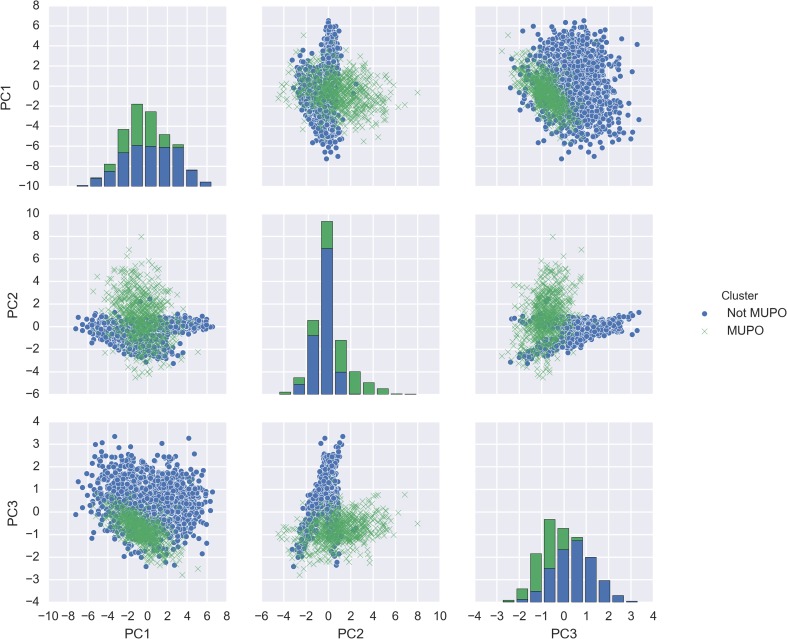
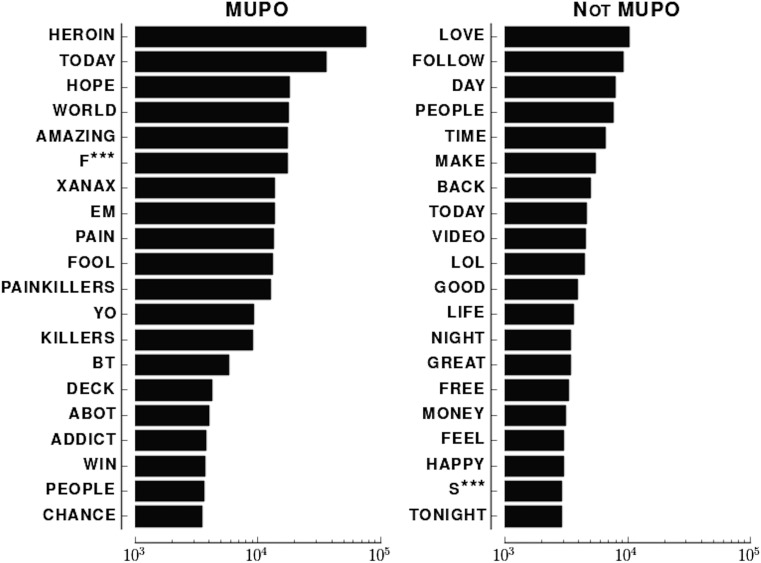
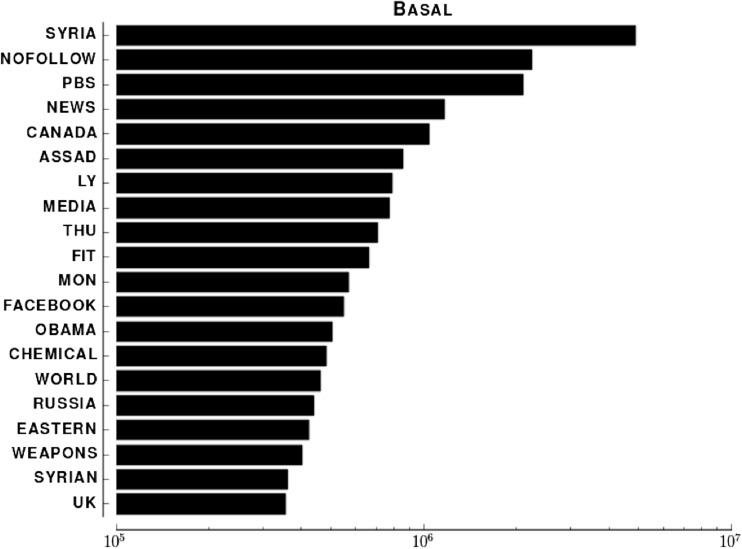
For 2012, we obtained approximately 1.3 million unique English language tweets from the Streaming API that discussed MUPO. For 2013 and 2014, we obtained approximately 1.1 million and 1.2 million tweets, respectively. These account for 0.00065% of the annual volume of tweets. Of those, we obtained geographic information for 85,328 (2012), 64,112 (2013), and 79,442 (2014). The NSDUH surveys approximately 70,000 individuals (each person interviewed is a proxy for approximately 4500 US residents [1]). Tweets readily fell into two clusters (Fig. 2). The silhouette coefficient peaked at 0.44 for two clusters (Fig. S1). We labeled the green cluster as containing tweets referring to MUPO because that cluster was significantly enriched (p = 0.016) for curated tweets discussing MUPO. The Cohen’s kappa for curation was 0.87 (Table S4). The words in MUPO tweets are different from those in non-MUPO tweets (Fig. 3) and those in tweets not mentioning any opioids (Fig. 4).
Fig. 2.
Separation of tweets into semantic clusters. Each panel is the projection of the same 0.01% random sample of tweets projected onto the two principal components indicated by the panel’s axes. PC1 refers to principal component 1, PC2 principal component 2, PC3 principal component 3. Diagonal shows the distribution of values projected onto each principal component. Data from 2012
Fig. 3.
Twenty most common words in MUPO and not-MUPO clusters in signal stream. X-axis shows the frequency of words in each category on a logarithmic scale. Same logarithmic scale for both panels. Twitter data from 2012
Fig. 4.
Twenty most common words from basal activity stream. X-axis shows the frequency of words in each category on a logarithmic scale
The x-axis in Fig. 4 starts at two orders of magnitude greater than the x-axis in Fig. 3, indicating that, as expected, only a small amount of tweets generated each day mention MUPO.
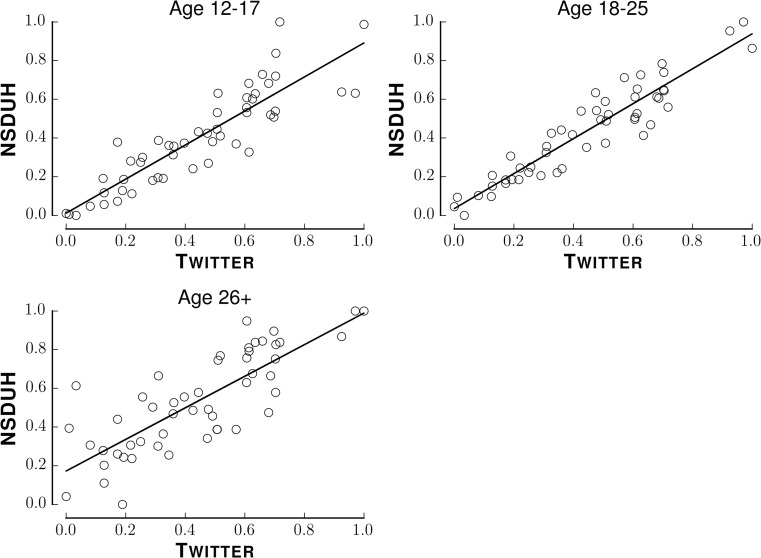
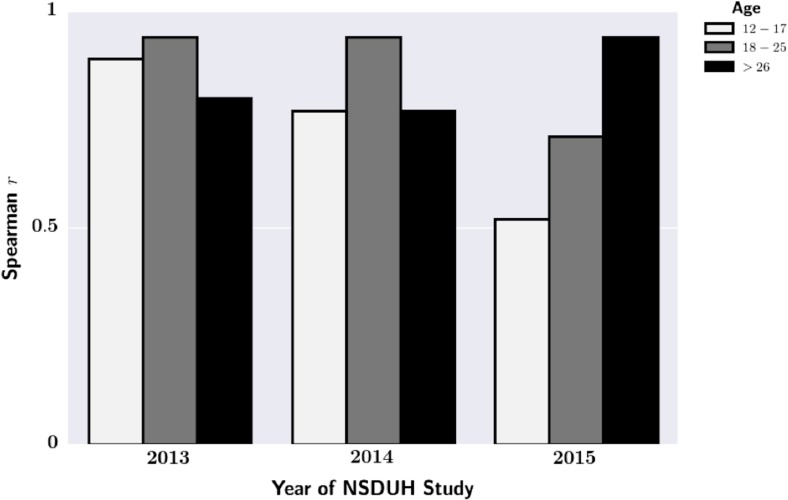
Figure 5 compares our estimate of MUPO from Twitter with NSDUH across NDUH-defined age groups for 2012. Figures S2 and S3 are the counterparts to Fig. 6 for 2013 and 2014. We quantified agreement using the Spearman rank correlation coefficient. Our MUPO estimates significantly correlated across all age groups (Fig. 6). In 2012 and 2013, the coefficient was higher for those ages 18–25 than those ages 12–17, although this difference was not statistically significant (p = 0.78, two-sample Kolmogorov-Smirnov test). In 2014, the correlation coefficient was significantly higher for those 26 or older than for those 12–17 (p < 0.01, two-sample Kolmogorov-Smirnov test) or 18–25 (p < 0.01, two-sample Kolmogorov-Smirnov test).
Fig. 5.
Scatter plot of estimates of MUPO from NSDUH and Twitter for 2012. Title of each panel indicates NSDUH age range. Open circles are estimates for each state scaled as indicated in “Methods” section. Solid line shows linear regression line
Fig. 6.
Correlation between NSDUH and Twitter across age groups. Legend indicates NSDUH age groups. All correlation coefficients are significantly greater than 0
The agreement between Twitter and NSDUH could be confounded by population density. To account for this, we assessed the correlation between unscaled Twitter and NSDUH data. None of these correlations were significant (Table 2).
Table 2.
Median state-by-state Spearman correlation between unscaled Twitter data and unscaled NSDUH responses
| Year of NSDUH study | r |
|---|---|
| 2012 | 0.24 |
| 2013 | 0.32 |
| 2014 | 0.31 |
No correlation is statistically significantly greater than 0 as assessed by the Kolmogorov-Smirnov test
Discussion
The purpose of the study was to determine whether data from social media could accurately estimate the geographic location and relative prevalence of MUPO when compared to an established epidemiologic gold standard (i.e., the NSDUH). We used a novel application of natural language processing, the kernel-weighted semantic distance (SemD), to automate content analysis. Our approach leverages the observation that discussions on Twitter about MUPO have linguistic characteristics that distinguish them from other discussions [26], which allowed us to automatically separate tweets based on linguistics characteristics.
The main finding of this study is that Twitter and NSDUH provide significantly correlated estimates of the geographic distribution of MUPO over a discrete time period. The strongest correlation occurred between data from Twitter and NSDUH data from those aged 18–25. The correlation increased from 2012 to 2013 and then decreased from 2013 to 2014, although these differences were not statistically significant. This work demonstrates that social media can be used to estimate fundamental epidemiologic quantities, in contrast to prior work that used social media to define a population or estimate quantities that might correlate with established epidemiologic metrics such as prevalence.
Data on the epidemiology of MUPO traditionally come from government surveys, such as the annual National Survey on Drug Usage and Health. Social media may provide a complementary source of data, especially on nonmedical substance usage in certain age groups (particularly adolescents, teens, and young adults). Users of social networks often publicly broadcast their location and information about their peers and behaviors. Further information about these users, such as age, can be inferred from patterns of communication and association with other users. There are challenges to extracting data from social media data, which are of comparably lower quality than government-sponsored survey data. Discussions of substance use on social media often use slang and highly referential language. Users may post misleading messages to portray a pattern of substance use that they associate with social status [27]. While it is difficult to verify the content of Internet posts with the same certainty as serum concentrations, social media, nevertheless, can provide data that, in the aggregate, can be used for population health studies.
Limitations
We used processed versions of the tweets that regularized spelling, ignored emoticons, and changed the part of speech of some of the words. This increases the number of tweets that we could analyze at the cost of possibly distorting or overlooking synonymy, sarcasm, irony, and hyperbole.
Our data are subject to sampling bias. The Twitter API provides a random 1% sample of all tweets at any given time. Although we are unaware of any published literature on this, anecdotal evidence from multiple groups suggests that successive samples from the Twitter API are not independent. Only 1–2% of the tweets encoded by the Twitter API contain explicit latitude and longitude coordinates. We used Python module Carmen to increase the number of tweets with geographic information. Carmen infers location based on metadata and the text of the tweet, which may add another layer of bias. Our calculation of the semantic distance also uses the text of the tweet. The accuracy of Carmen is already known to depend on the amount of metadata and length of text of a tweet. These limitations notwithstanding the correlation between Twitter and NSDUH did not statistically significantly vary over 3 years, suggesting that the correlation we found is stable.
This paper describes an agreement between social media and government surveys; however, it provides no insight into mechanisms underlying this agreement. Our conceptual hypothesis is that people discuss on social media what they intend to do in the physical world. This hypothesis has held for research involving cardiovascular mortality [27] and major depression [28, 29]. Our approach may be inaccurate if it does not sample the at-risk population evenly. In the physical world, new users of substances behave differently from chronic users; they use different vocabulary and associate with different parts of the population [30]. We assumed that new and chronic users communicate similarly on Twitter and that those communicating online about a substance are the ones using it in the physical world.
Further work is necessary to correlate the geographic variation noted in this paper with geographic variation in policies and laws on controlled substances, mental health and addiction services, and known risk and protective factors. As geolocation algorithms improve, it would be desirable to look at trends in usage at the more granular levels of a city or Congressional district. The compilation of a time-series of usage will help further establish our method and may allow novel insights.
Conclusions
We used Twitter data to estimate the geographic variation in discussions on MUPO. We found that our estimates agreed with national survey data, suggesting that social media can be a reliable additional source of epidemiological data regarding substance use. Furthermore, we have demonstrated that techniques from machine learning can be used to analyze social media to canvass larger segments of the general population and potentially yield timely insights for syndromic surveillance.
Electronic supplementary material
(DOCX 809 kb)
Compliance with Ethical Standards
Conflict of Interest
The authors declare that they have no conflicts of interest.
Sources of Funding
None
Footnotes
Electronic supplementary material
The online version of this article (doi:10.1007/s13181-017-0625-5) contains supplementary material, which is available to authorized users.
References
- 1.Abuse S. Results from the 2010 National Survey on Drug Use and Health: Summary Of National Findings 2011.
- 2.Manchikanti L, Singh A. Therapeutic opioids: a ten-year perspective on the complexities and complications of the escalating use, abuse, and nonmedical use of opioids. Pain physician. 2008;11(2 Suppl):S63–S88. [PubMed] [Google Scholar]
- 3.Hansen RN, Oster G, Edelsberg J, Woody GE, Sullivan SD. Economic costs of nonmedical use of prescription opioids. Clin J Pain. 2011;27(3):194–202. doi: 10.1097/AJP.0b013e3181ff04ca. [DOI] [PubMed] [Google Scholar]
- 4.Florence CS, Zhou C, Luo F, Xu L. The economic burden of prescription opioid overdose, abuse, and dependence in the United States, 2013. Med Care. 2016;54(10):901–906. doi: 10.1097/MLR.0000000000000625. [DOI] [PMC free article] [PubMed] [Google Scholar]
- 5.Chew C, Eysenbach G. Pandemics in the age of Twitter: content analysis of Tweets during the 2009 H1N1 outbreak. PLoS One. 2010;5(11):e14118. doi: 10.1371/journal.pone.0014118. [DOI] [PMC free article] [PubMed] [Google Scholar]
- 6.Signorini A, Segre AM, Polgreen PM. The use of Twitter to track levels of disease activity and public concern in the US during the influenza A H1N1 pandemic. PLoS One. 2011;6(5):e19467. doi: 10.1371/journal.pone.0019467. [DOI] [PMC free article] [PubMed] [Google Scholar]
- 7.Lenhart A, Purcell K, Smith A, Zickuhr K. Social media & mobile Internet use among teens and young adults. Millennials. Pew Internet & American life project. 2010.
- 8.Eysenbach G. Infodemiology and infoveillance: framework for an emerging set of public health informatics methods to analyze search, communication and publication behavior on the Internet. J Med Internet Res. 2009;11(1):e11. doi: 10.2196/jmir.1157. [DOI] [PMC free article] [PubMed] [Google Scholar]
- 9.Nascimento TD, DosSantos MF, Danciu T, DeBoer M, van Holsbeeck H, Lucas SR, Aiello C, Khatib L, Bender MA, Zubieta JK, DaSilva AF. Real-time sharing and expression of migraine headache suffering on Twitter: a cross-sectional infodemiology study. J Med Internet Res. 2014;16(4):e96. doi: 10.2196/jmir.3265. [DOI] [PMC free article] [PubMed] [Google Scholar]
- 10.Dredze M. How social media will change public health. IEEE Intell Syst. 2012;27(4):81–84. doi: 10.1109/MIS.2012.76. [DOI] [Google Scholar]
- 11.Cavazos-Rehg P, Krauss M, Grucza R, Bierut L. Characterizing the followers and tweets of a marijuana-focused Twitter handle. J Med Internet Res. 2014;16(6):e157. doi: 10.2196/jmir.3247. [DOI] [PMC free article] [PubMed] [Google Scholar]
- 12.Hanson CL, Burton SH, Giraud-Carrier C, West JH, Barnes MD, Hansen B. Tweaking and tweeting: exploring Twitter for nonmedical use of a psychostimulant drug (Adderall) among college students. J Med Internet Res. 2013;15(4):e62. doi: 10.2196/jmir.2503. [DOI] [PMC free article] [PubMed] [Google Scholar]
- 13.Chary M, Genes N, Manini AF. Using Twitter to measure underage alcohol usage. Clinical Toxicology. 2014;52(4):304. [Google Scholar]
- 14.Halpern JH, Pope HG., Jr Hallucinogens on the Internet: a vast new source of underground drug information. Am J Psychiatr. 2001;158(3):481–483. doi: 10.1176/appi.ajp.158.3.481. [DOI] [PubMed] [Google Scholar]
- 15.Jimenez-Feltström A, inventor; Telefonaktiebolaget LM Ericsson (Publ), assignee. Text language detection. United States patent US 7,035,801. 2006.
- 16.Bird S. NLTK: the natural language toolkit. In Proceedings of the COLING/ACL on Interactive presentation sessions 2006 Jul 17 (pp. 69-72). Assoc Comput Linguist.
- 17.Jiang JJ, Conrath DW. Semantic similarity based on corpus statistics and lexical taxonomy. arXiv preprint cmp-lg/9709008. 1997.
- 18.Miller GA. WordNet: a lexical database for English. Commun ACM. 1995;38(11):39–41. doi: 10.1145/219717.219748. [DOI] [Google Scholar]
- 19.Hartigan JA, Wong MA. Algorithm AS 136: A k-means clustering algorithm. Journal of the Royal Statistical Society. Series C (Applied Statistics) 1979;28(1):100–108. [Google Scholar]
- 20.Rousseeuw PJ. Silhouettes: a graphical aid to the interpretation and validation of cluster analysis. J Comput Appl Mat. 1987;20:53–65. doi: 10.1016/0377-0427(87)90125-7. [DOI] [Google Scholar]
- 21.Burton SH, Tanner KW, Giraud-Carrier CG, West JH, Barnes MD. “Right time, right place” health communication on Twitter: value and accuracy of location information. J Med Int Res. 2012;14(6):e156. doi: 10.2196/jmir.2121. [DOI] [PMC free article] [PubMed] [Google Scholar]
- 22.Graham M, Hale SA, Gaffney D. Where in the world are you? Geolocation and language identification in Twitter. Prof Geogr. 2014;66(4):568–578. doi: 10.1080/00330124.2014.907699. [DOI] [Google Scholar]
- 23.Dredze M, Paul MJ, Bergsma S, Tran H. Carmen: a twitter geolocation system with applications to public health. In AAAI workshop on expanding the boundaries of health informatics using AI (HIAI) 2013 Jun 29 (pp. 20–24).
- 24.Van Rossum G, Drake Jr FL. Python reference manual. Amsterdam: Centrum voor Wiskunde en Informatica; 1995.
- 25.Jolliffe I. Principal component analysis. Wiley, Ltd; 2002.
- 26.Chary M, Park EH, McKenzie A, Sun J, Manini AF, Genes N. Signs & symptoms of dextromethorphan exposure from YouTube. PLoS One. 2014;9(2):e82452. doi: 10.1371/journal.pone.0082452. [DOI] [PMC free article] [PubMed] [Google Scholar]
- 27.Caspi A, Gorsky P. Online deception: prevalence, motivation, and emotion. CyberPsychol & Behav. 2006;9(1):54–59. doi: 10.1089/cpb.2006.9.54. [DOI] [PubMed] [Google Scholar]
- 28.Eichstaedt JC, Schwartz HA, Kern ML, Park G, Labarthe DR, Merchant RM, Jha S, Agrawal M, Dziurzynski LA, Sap M, Weeg C. Psychological language on Twitter predicts county-level heart disease mortality. Psychol Sci. 2015;26(2):159–169. doi: 10.1177/0956797614557867. [DOI] [PMC free article] [PubMed] [Google Scholar]
- 29.Nambisan P, Luo Z, Kapoor A, Patrick TB, Cisler RA. Social media, big data, and public health informatics: ruminating behavior of depression revealed through twitter. In System Sciences (HICSS), 2015 48th Hawaii International Conference on 2015 Jan 5 (pp. 2906-2913). IEEE.
- 30.Mowery D, Smith HA, Cheney T, Bryan C, Conway M. Identifying depression-related tweets from twitter for public health monitoring. On J Public Health Inform. 2016;24:8(1). [Google Scholar]
Associated Data
This section collects any data citations, data availability statements, or supplementary materials included in this article.
Supplementary Materials
(DOCX 809 kb)


