

Abstract
Background
Autism spectrum disorders (ASDs) are complex, pervasive, and heterogeneous neurodevelopmental conditions with varying trajectories, significant male bias and largely unknown etiology. However, an understanding of the biological mechanisms driving pathophysiology is evolving. Immune system aberrations, as identified through cytokine profiles, are believed to have a role in ASD. Altered cytokine levels may facilitate identification of ASD subtypes as well as provide biological markers of response to effective treatments. Research exploring the relationship between cytokine profiles and ASD symptoms is, however, in its infancy. The objective of this study was to explore relationships between cytokine levels and the severity of ASD and other clinical traits.
Methods
Multiplex assay techniques were used to measure levels of 27 cytokines in plasma samples from a cohort of 144 children diagnosed with ASD.
Results
Overall, results showed a significant negative association between platelet-derived growth factor (PDGF)-BB, and the severity of ASD symptoms. Furthermore, a significant interaction with sex suggested a different immune profile for females compared to males. ASD symptom severity was negatively associated with levels of 4 cytokines, IL-1β, IL-8, MIP-1β, and VEGF, in females, but not in males.
Conclusions
Results of the present study suggest that an altered cytokine response or profile is associated with the severity of ASD-related symptoms, with sex a potential modifier of this relationship. Further research in larger populations which recognizes the importance of sex comparisons and longitudinal assessments are now required to extend and further describe the role of the immune system in ASD.
Electronic supplementary material
The online version of this article (10.1186/s13229-017-0176-2) contains supplementary material, which is available to authorized users.
Keywords: Autism spectrum disorder, Cytokine, Behavior, Pediatric, Severity
Background
Autism spectrum disorders (ASDs) are complex, pervasive, and heterogeneous neurodevelopmental disorders of primarily unknown etiology and pathogenesis. Recent epidemiological studies estimate prevalence to be as high as 1 in 68 [1]. Diagnosis is currently based on clinical observation of behavioral features, defined as persistent deficits in social communication and interaction, and restricted, repetitive patterns of behavior, interests or activities; severity classifications are based on required levels of support [2]. While ASD is considered a lifelong condition [3], developmental trajectories vary significantly [4] with a range of prognoses [5]. Sex is believed to have an important role in development, with significantly more males diagnosed with ASD (4:1) [6] and different characteristic phenotypes presenting for females [7]. Many genes have been proposed to converge on common pathways affecting neuronal and synaptic homeostasis [8]. Environmental factors may also play a role in etiology through, for example, the impact of maternal immune activation or antibodies on a developing brain or by impacting a susceptible physiology [9–11]. This complex etiology, manifesting as vast clinical heterogeneity, has been a catalyst for investigations aiming to characterize potential biological subtypes of ASD.
Immune system alterations related to immunogenetics, maternal immune activation, and a family history of autoimmune disorders, suggests a relationship between ASD and the immune system [12]. Accumulating evidence of alterations in central and peripheral immune system functioning supports the proposal that there is a subgroup of individuals with ASD who have some form of immune system dysregulation [11]. Previous work has highlighted significantly altered peripheral levels of primarily pro-inflammatory cytokines in ASD compared to healthy controls [13]. Levels of both pro-inflammatory and anti-inflammatory cytokines and chemokines have been associated with the severity of aberrant behavior and more impaired developmental and adaptive function [14–16]. However, numerous differences in immune function have been identified in ASD, suggesting that these aberrations may be due to reduced immune system regulation rather than a dominance of one type of inflammatory response signal [11].
Despite extensive immunological evidence suggesting immune system aberrations in ASD, further research is required to clarify the relationship between immune profiles and ASD symptoms [12]. Such investigations may further knowledge about potentially useful biomarkers for ASD and the severity of symptoms, and provide clues for potential causative relationships and factors that might characterize subgroups of ASD. The pathophysiological significance of commonly identified comorbidities in ASD, such as gastrointestinal dysfunction and sleep disorder, with respect to the identified immune system aberrations, is also unknown [17–19]. While understanding the influence of sex has been a recent research priority [20], partially because of the higher ratio of ASD diagnosis of males [21], to date, there has been limited investigation of potential sex differences in immunological profiles [22]. Sex-specific immunological aberrations have been described in a rodent model, with females exhibiting attenuation of induced behavioral and immunological alterations compared to males [23]. Therefore, there is a need to characterize the relationship between immune system dysfunction, specifically cytokine alterations, and severity of ASD symptoms, including disordered sleep and gastrointestinal dysfunction, between males and females.
The present study utilized a large, well-characterized repository of biological samples and multiplex assay techniques to investigate the relationship between cytokine levels and symptom severity of ASD. Cytokine profiles were investigated in relation to clinical traits, including variability in social functioning, sleep problems, and gastrointestinal dysfunction, along with the role of sex.
Methods
Participants
Participants (113 males, 31 females) were part of the Western Australian Autism Biological Registry (WAABR), located at the Telethon Kids Institute in Perth, Western Australia [24]. Ethics approval was granted by the Human Ethics Committee at Princess Margaret Hospital for Children in Perth, Western Australia. Informed consent was provided by the primary caregiver. Participants were recruited during the period January 2011 to March 2013 through newspaper advertisements and via flyers distributed among local service providers and clinicians. Children with a DSM-IV clinical diagnosis of autistic disorder, Asperger’s syndrome, or pervasive developmental disorder—not otherwise specified—were included in the study. Diagnosis in Western Australia mandates a consensus diagnosis following a multidisciplinary assessment by a pediatrician, clinical psychologist, and speech-language pathologist [25]. The Autism Diagnostic Observation Schedule-Generic (ADOS-G) was administered to each participant [26]. The ADOS-G is a semi-structured assessment using simple activities and questions to elicit and observe the communicative, social, and stereotyped behaviors relevant to the diagnosis of ASD. Research-accredited professionals administered the ADOS-G to all participants. Each participant’s ADOS-G raw scores and total score was converted to the updated ADOS-2 calibrated severity score [27–29], as this score is less influenced by child characteristics than raw totals. ADOS diagnostic classification was based on a range of severity scores, where 1 reflects minimal to no evidence of autism spectrum-related symptoms, and 10 represents a high severity of autism spectrum-related symptoms. Based on the level of autism-related symptoms and comparison scores, participants were categorized as mild/moderate or severe, as per established procedures [30]. Calibrated domain scores for social-communication and restricted and repetitive behavior were also derived [31]. A primary caregiver completed a questionnaire about family history, including details of previously diagnosed comorbidities and gastrointestinal problems (classified as present or absent), the Social Responsiveness Scale (SRS) [32], and the Children’s Sleep Habits Questionnaire (CSHQ) [33]. The SRS is a 65-item questionnaire which measures social behavior, language, and repetitive behavior/restricted interests. Higher total score indicates higher severity of social impairment of ASD. The CSHQ is a 33-item questionnaire assessing the frequency of common sleep problems in children with higher scores indicating more disordered sleep. All participants followed the same schedule of assessments, with specimen collection occurring immediately following the ADOS-G assessment.
Blood sample collection procedure
Peripheral blood (non-fasting) was collected into anticoagulant treated tubes (EDTA, 4 ml vacutainer, K2E, 7.2 mg, BD). The tube was inverted immediately after collection to mix the EDTA with the blood as per standard procedure. Samples were centrifuged for 10 min at 3500 rpm at room temperature in an Eppendorf 5810R centrifuge. The harvested plasma was stored at − 80 οC, and the analysis was conducted on the day of the first thawing of samples. The samples were defrosted on ice and a 100 μl aliquot was supplied for the multiplex assays.
Cytokine analysis
Cytokine analysis was conducted using a magnetic bead-based multiplex assay system, which facilitated the detection and quantification of multiple cytokines from a single sample of plasma. A human cytokine 27-plex assay (Bio-Plex Pro Human Cytokine 27-plex #M500KCAFOY) simultaneously quantified levels of 27 cytokines (eotaxin, fibroblast growth factor (FGF) basic, granulocyte colony-stimulating factor (G-CSF), granulocyte–macrophage colony-stimulating factor (GM-CSF), interferon (IFN)-γ, interleukin (IL)-1β, IL1 receptor antagonist (IL-1ra), IL-2, IL-4, IL-5, IL-6, IL-7, IL-8, IL-9, IL-10, IL-12p70, IL-13, IL-15, IL-17, interferon gamma-induced protein (IP)-10, monocyte chemotactic protein (MCP)-1, macrophage inflammatory protein (MIP)-1α, MIP-1β, platelet-derived growth factor (PDGF)-BB, regulated on activation normal T cell expressed and secreted (RANTES), tumor necrosis factor (TNF)-α and vascular endothelial growth factor (VEGF)). All standards, reagents, and samples were prepared according to the manufacturer’s instructions (Bio-Plex® Multiplex System, Bio-Plex Pro™ Human Cytokine, Chemokine and Growth Factor Assays; Bio-Rad Laboratories Pty., Ltd. Hercules, CA, USA). The plates were analyzed using a multiplexing diagnostic instrument (LUMINEX®200™; Luminex Corp.), and fluorescent data for each cytokine was extracted using the manufacturers software (xPONENT for LX200 3.1.971.0; Luminex Corp.). Blood samples for the 144 participants were analyzed blinded to participant’s severity of ASD and all other characteristics including sex. Samples were spread across two plates and two runs (one plate per run). One sample was excluded from cytokine estimations due to misclassification. Standards and blanks were analyzed in duplicate and two duplicate plasma samples were analyzed on each plate to allow an assessment of assay uniformity.
Cytokine level values calculated from participant plasma samples can be lower than the associated lowest cytokine standard or blank. Participant cytokine expression values lower than the associated blanks and standards are considered a result of different matrix effects in plasma and the diluent used in blanks and standards [34] or possibly due to the fact that the actual analytes used with the standards are constructed using recombinant proteins that may differ from natively expressed analytes found in the biological samples [35]. Therefore, a background correction procedure for estimating cytokine levels was used [36, 37]. The correction procedure assumes that any non-specific binding occurring in the blank and standards are nullified by matrix effects in the test samples. Output from the formula was a corrected subject median fluorescence value for each cytokine. Fluorescence values were used as, unlike concentrations, there are no missing values, a level of detection (LOD) does not need to be specified, and low signals can be analyzed which adds more statistical power for testing differences in analyte expression levels. See Additional file 2 for further information. The best matching standard was the standard that had the observed median fluorescence value closest to the median of the subjects for that cytokine. The fluorescence value for the associated best matched standard was used to estimate the expected concentration of that standard using back calculation [38]. Several models were tested to estimate the expected concentrations for the best matched standard for each cytokine (Additional file 1: Table S1). Using correlations between expected and estimated concentration for best matched standards, and associated correlations (R 2), estimates according to a third order polynomial fit to the log-log transformation of the expected concentrations and fluorescence values yields the best fit standards compared to unweighted 4 parameter logistic (4PL) and 5PL curve fits (Additional file 2: Figure S1). Consequently, this method was used to predict the participant cytokine levels.
As different plates contained different groups of participants, a normalization procedure was developed to address any potential differences in cytokine levels between the two runs. The log2 of fluorescence values were modeled for run and cytokine interaction, taking in to account the level of each cytokine on each plate. The residuals from the model hold the differences in cytokine levels due to any explanatory variable, which was not cofounded with run differences. Additional file 1: Figure S2 illustrates the effect of the run normalization procedure.
Statistical analysis
Descriptive statistics were calculated for participant characteristics. Missing values were imputed using the multiple imputation by chained equations (MICE) method (Additional file 1: Table S2) [39, 40]. A variable clustering procedure was used to identify homogeneous clusters of variables and eliminate variables conveying similar information [41]. Multinomial logistic regression was undertaken to assess that each plate was balanced with respect to cofactors, or participant characteristics, across runs [42]. All statistical tests were done using R version 3.2.3 (2015-12-10). Type 3 ANOVA tests were done using ANOVA from the car package [43]. Interaction tests were done using test interactions routine from the phia package [44]. Wilcoxon two sample and signed-rank tests were done using the R’s Wilcox test from the coin package [45]. Multiple test corrections were done via the Holm method [46]. Cytokine correlations were obtained using Spearman’s rank correlation. The network visualization of the Spearman’s rank correlation matrix between cytokine levels were obtained using R’s graphing package qgraph version 1.3.3 [47]. qgraph is a visualization tool and a tool for applying network analysis from data for estimating network structures, where the network can be weighted (correlations) or unweighted and undirected. Here, each node represents a cytokine and each edge the correlation between the connecting nodes. For example, qgraph can draw a correlation network, not just as circular network but where strongly correlated nodes are drawn near each other [48]. Generally, correlation networks are drawn fully connected, i.e., showing all non-zero edges between nodes, and when the number of nodes is large this can often make the network hard to interpret. One solution, using model selection to estimate the best graph structure, is to remove edges, set them to zero, with weak correlations using a user specified threshold. Depending on how this is done, the centrality of the network can also be affected. However, thresholding does not consider how removal of these edges changes relationships (correlations) within the network, or how well the network explains the data. An alternative approach and a well-established method for simultaneously estimating parameters and performing model selection on a correlation network, as done here, is to employ LASSO, using the R glasso package [49]. These network models were selected using penalized maximum likelihood solution in which the likelihood is penalized for the sum of absolute parameter estimates using LASSO [50], via qgraph, which can be used to estimate a network that minimizes the Extended Bayesian Information Criterium (EBIC) [51].
Results
Samples for this analysis were collected from 144 participants, aged between 2 and 18 (mean 8.2 SD ± 4.2). Sex distribution was 78% male and 22% female. Eighty-three percent of participants identified as Caucasian. Additional demographic and clinical characteristics of participants are presented in Table 1. The variable clustering procedure resulted in the inclusion of six variables in the reduced set: age, sex, gastrointestinal symptoms, severity of ASD, sleep score, and SRS total score (Table 1). Assessment of covariate balance with respect to the two different plates or runs identified a run difference only due to sex (p = 0.042) (Additional file 1: Table S3).
Table 1.
Participant clinical characteristics
| Total | Male | Female | ||
|---|---|---|---|---|
| N | 144 | 113 | 31 | |
| Age (years) | ||||
| Mean | 8.16 | 7.96 | 9.53 | |
| SD | 4.21 | 4.05 | 4.79 | |
| Range | 2.08–18.25 | 2.83–18 | 2.25–18.25 | |
| BMI (kg/m2) | ||||
| Mean | 18.34 | 16.74 | 21.12 | |
| SD | 4.63 | 2.05 | 7.09 | |
| Range | 12.26–46.96 | 13.50–21.74 | 13.45–46.96 | |
| Head circumference (cm) | ||||
| Mean | 53.86 | 53.67 | 54.20 | |
| SD | 3.01 | 2.21 | 3.46 | |
| Range | 46–62 | 49.5–59 | 46–61 | |
| ADOS module | ||||
| Module 1 | 35 | 28 | 7 | |
| Module 2 | 58 | 49 | 9 | |
| Module 3 | 42 | 31 | 11 | |
| Module 4 | 9 | 6 | 3 | |
| Severity (ADOS comparison score) | ||||
| Median | 6 | 6 | 6 | |
| Range | 1–10 | 1–10 | 1–9 | |
| Severity of symptoms | ||||
| Mild/moderate | 85 | 68 | 17 | |
| Severe | 59 | 45 | 14 | |
| SRS | ||||
| Mean | 88.18 | 86.43 | 97.27 | |
| SD | 15.71 | 11.09 | 19.11 | |
| Range | 44–126 | 64–106 | 44–126 | |
| Sleep scores | ||||
| Median | 12.5 | 53 | 56 | |
| Range | 1–31 | 46–78 | 46–72 | |
| GI symptoms | ||||
| Absent | 85 | 65 | 20 | |
| Present | 59 | 47 | 11 | |
Abbreviations: BMI body mass index, ADOS autism diagnostic observation schedule, SRS social responsiveness scale, GI gastrointestinal
Descriptive statistics for cytokine levels in plasma samples are shown in Table 2. Significance analysis of mixed effect modeling identified an interaction in cytokine levels with respect to two clinical covariates: age (p < 0.001) and the severity of ASD (p = 0.02; Table 3, Additional file 2: Table S4). There was no interaction between cytokine levels and remaining clinical variables (SRS, sleep, and gastrointestinal symptoms) or a significant main effect. The effect of sex was also investigated to determine if the interaction between cytokine expression and covariates were due to sex differences. Statistically significant effects in females were identified for interactions between cytokine levels and age (p = 0.03), severity of presentation (p < 0.001), and SRS score (p = 0.04), while in males there was a statistically significant effect between cytokine levels and age (p < 0.001; Table 3). Significance for the interaction effects with respect to age, severity, and SRS were then investigated for males and females. Reduced levels of IL-1β (p < 0.001), IL-8 (p < 0.001), MIP-1β (p = 0.006), PDGF-BB (p = 0.005), and VEGF (p = 0.03) were associated with increased severity of autism in females (Table 4). Reduced levels of PDGF-BB (p = 0.03) were associated with increased severity of autistic symptomatology in males (Table 4). With the exception of IL-15, cytokine levels appear to decrease with respect to increasing severity (Table 4). Higher levels of IL-8 (p = 0.03) were associated with higher scores on the SRS in females. Increased levels of IL-15 (p = 0.04) and reduced levels of IL-8 (p = 0.005) and MIP-1β (p = 0.009) were associated with increasing age in males, while reduced levels of IP-10 (p = 0.001) was associated with increasing age in females (Table 4).
Table 2.
Cytokine median fluorescence values and ranges
| Cytokine | Range | Median | IQR |
|---|---|---|---|
| Basic FGF | 37–150 | 71 | 60–85.5 |
| Eotaxin | 35–392 | 94 | 67.25–151.5 |
| G-CSF | 26–189 | 57.5 | 45.5–80.5 |
| GM-CSF | 60–1128 | 406 | 279.5–550.25 |
| IFN-γ | 17–164 | 43.5 | 33–61.75 |
| IL-10 | 31–333.5 | 77 | 61–96 |
| IL-12p70 | 32.5–346 | 66 | 48–89.75 |
| IL-13 | 25.5–598 | 81 | 60–133 |
| IL-15 | 25–427 | 97 | 72–130.25 |
| IL-17A | 40–222.5 | 90.5 | 76.5–105.25 |
| IL-1β | 19–541 | 57 | 39–96.25 |
| IL-1RA | 19–719 | 52 | 40–68.5 |
| IL-2 | 35–563.5 | 85 | 70–102 |
| IL-4 | 20–158 | 45.5 | 35–61.25 |
| IL-5 | 15–136.5 | 28 | 22–39 |
| IL-6 | 26–402.5 | 48 | 41–66.5 |
| IL-7 | 17–157 | 28.5 | 24–37 |
| IL-8 | 26–1716 | 97 | 62.25–224.5 |
| IL-9 | 74–1397 | 138 | 113.5–166.75 |
| IP-10 | 56–2275 | 371.5 | 200.25–659.5 |
| MCP-1 | 41.5–331.5 | 91 | 75.25–123 |
| MIP-1α | 33–193 | 75 | 59.75–93.5 |
| MIP-1β | 101.5–2070.5 | 449 | 275.5–698.25 |
| PDGF-BB | 221–7644.5 | 1382.5 | 715.25–2542.75 |
| RANTES | 3842–17,915 | 12,039 | 8658.5–14,675 |
| TNF-α | 19–185 | 32.5 | 26–42 |
| VEGF | 71.5–941.5 | 157 | 110–207.5 |
IQR (interquartile range). IQR is based on dividing a data set into quartiles Q1, Q2, and Q3 that divides a rank-ordered data set into four equal parts. IQR = Q3-Q1
Abbreviations: Basic FGF basic fibroblast growth factor, G-CSF granulocyte colony-stimulating factor, GM-CSF granulocyte macrophage colony-stimulating factor, IFN-γ interferon-γ, IL interleukin,IL.1RA IL-1 receptor antagonist, IP-10 interferon gamma-inducible protein 10, MCP-1 monocyte chemotactic protein-1, MIP-1α macrophage inflammatory protein-1α, MIP-1β macrophage inflammatory protein-1β, PDG platelet derived growth factor-BB, RANTES regulated on activation, normal T cell expressed and secreted, TNF-α tumor necrosis factor-α, VEGF vascular endothelial growth factor
Table 3.
Significance analysis of interaction effects in cytokine levels and clinical covariates
| Combined sex | Males | Females | |||||||
|---|---|---|---|---|---|---|---|---|---|
| Effect | Chisq | Df | Pr(>Chisq) | Chisq | Df | Pr(>Chisq) | Chisq | Df | Pr(>Chisq) |
| (Intercept) | 387.78 | 1 | < 0.001 | 239.73 | 1 | < 0.001 | 105.51 | 1 | < 0.001 |
| Severity | 3.28 | 1 | 0.07 | 1.48 | 1 | 0.22 | 0.88 | 1 | 0.35 |
| Age | 0.01 | 1 | 0.91 | 0.12 | 1 | 0.73 | 0.44 | 1 | 0.51 |
| SRS | 0.13 | 1 | 0.72 | 0.06 | 1 | 0.81 | 1.35 | 1 | 0.25 |
| Sleep | 0.08 | 1 | 0.78 | 0.23 | 1 | 0.63 | 0.38 | 1 | 0.54 |
| GI | 0.53 | 1 | 0.47 | 0.96 | 1 | 0.33 | 0.25 | 1 | 0.62 |
| Analyte | 1079.27 | 26 | < 0.001 | 787.12 | 26 | < 0.001 | 247.60 | 26 | < 0.001 |
| Severity:analyte | 43.64 | 26 | 0.02 | 16.42 | 26 | 0.93 | 71.10 | 26 | < 0.001 |
| Age:analyte | 75.23 | 26 | < 0.001 | 60.36 | 26 | < 0.001 | 41.61 | 26 | 0.03 |
| SRS:analyte | 10.96 | 26 | 1.00 | 19.09 | 26 | 0.83 | 40.28 | 26 | 0.04 |
| Sleep:analyte | 17.09 | 26 | 0.91 | 12.47 | 26 | 0.99 | 28.20 | 26 | 0.35 |
| GI:analyte | 9.65 | 26 | 1.00 | 13.11 | 26 | 0.98 | 23.97 | 26 | 0.58 |
Analysis of deviance tables (type III Wald chi-square tests) for the statistical model: mY~(severity + age + sex + SRS + sleep + GI)*Analyte + (1|ID). Where mY represents the normalized log2 of the fluorescence responses with respect to run (Additional file 1: Figure S2)
Table 4.
Adjusted slope for Age, Severity and SRS
| Age | Severity | SRS | ||||||||||
|---|---|---|---|---|---|---|---|---|---|---|---|---|
| Male | Female | Male | Female | Male | Female | |||||||
| Analyte | Slope | Pr(>Chisq) | Slope | Pr(>Chisq) | Slope | Pr(>Chisq) | Slope | Pr(>Chisq) | Slope | Pr(>Chisq) | Slope | Pr(>Chisq) |
| Basic FGF | − 0.01 | 0.89 | 0.00 | 0.98 | − 0.04 | 0.39 | − 0.06 | 0.37 | 0.00 | 0.97 | 0.00 | 0.97 |
| Eotaxin | − 0.03 | 0.16 | − 0.02 | 0.77 | − 0.06 | 0.13 | − 0.11 | 0.07 | 0.00 | 0.97 | −0.01 | 0.85 |
| G-CSF | 0.02 | 0.48 | 0.04 | 0.55 | −0.03 | 0.48 | − 0.03 | 0.68 | 0.01 | 0.96 | 0.00 | 0.97 |
| GM-CSF | − 0.01 | 0.85 | 0.02 | 0.85 | −0.01 | 0.89 | − 0.01 | 0.87 | 0.01 | 0.96 | 0.00 | 0.98 |
| IFN-γ | − 0.02 | 0.77 | 0.00 | 0.98 | − 0.04 | 0.34 | − 0.07 | 0.35 | 0.00 | 0.97 | − 0.01 | 0.97 |
| IL-10 | − 0.03 | 0.16 | − 0.02 | 0.85 | − 0.01 | 0.89 | − 0.08 | 0.22 | − 0.01 | 0.90 | − 0.01 | 0.97 |
| IL-12p70 | −0.04 | 0.07 | 0.00 | 0.98 | − 0.02 | 0.68 | − 0.12 | 0.05 | −0.01 | 0.88 | 0.00 | 0.97 |
| IL-13 | 0.01 | 0.77 | − 0.01 | 0.89 | − 0.01 | 0.75 | − 0.05 | 0.44 | 0.00 | 0.97 | − 0.01 | 0.70 |
| IL-15 | 0.04 | 0.04* | 0.04 | 0.48 | 0.00 | 0.96 | 0.04 | 0.54 | 0.00 | 0.97 | 0.00 | 0.97 |
| IL-17A | − 0.02 | 0.77 | 0.00 | 0.99 | − 0.03 | 0.48 | − 0.04 | 0.54 | 0.00 | 0.97 | 0.00 | 0.97 |
| IL-1β | − 0.02 | 0.72 | 0.02 | 0.85 | −0.06 | 0.15 | − 0.20 | < 0.001* | −0.01 | 0.88 | 0.01 | 0.85 |
| IL-1RA | − 0.01 | 0.85 | 0.02 | 0.77 | − 0.04 | 0.35 | − 0.08 | 0.22 | 0.00 | 0.97 | 0.00 | 0.97 |
| IL-2 | 0.00 | 0.98 | 0.01 | 0.87 | 0.00 | 1.00 | −0.04 | 0.57 | 0.00 | 0.97 | 0.00 | 0.97 |
| IL-4 | 0.00 | 0.98 | 0.01 | 0.87 | −0.04 | 0.37 | −0.07 | 0.31 | 0.00 | 0.97 | 0.00 | 0.97 |
| IL-5 | − 0.02 | 0.77 | 0.00 | 0.98 | − 0.05 | 0.22 | − 0.06 | 0.39 | 0.00 | 0.97 | − 0.01 | 0.85 |
| IL-6 | − 0.01 | 0.84 | 0.02 | 0.85 | − 0.04 | 0.39 | − 0.06 | 0.39 | 0.00 | 0.97 | 0.00 | 0.97 |
| IL-7 | 0.00 | 0.95 | 0.01 | 0.98 | − 0.04 | 0.34 | − 0.06 | 0.35 | 0.00 | 0.97 | 0.00 | 0.97 |
| IL-8 | − 0.06 | 0.01* | 0.02 | 0.77 | − 0.05 | 0.22 | − 0.29 | < 0.001* | 0.00 | 0.97 | 0.02 | 0.03* |
| IL-9 | − 0.01 | 0.85 | 0.00 | 0.98 | − 0.01 | 0.74 | 0.00 | 1.00 | − 0.01 | 0.90 | 0.00 | 0.97 |
| IP-10 | − 0.04 | 0.09 | − 0.10 | 0.001* | − 0.05 | 0.22 | − 0.02 | 0.74 | − 0.01 | 0.80 | − 0.02 | 0.21 |
| MCP-1 | 0.01 | 0.91 | 0.02 | 0.84 | − 0.03 | 0.48 | − 0.05 | 0.48 | 0.00 | 0.97 | 0.00 | 0.97 |
| MIP-1α | − 0.01 | 0.84 | − 0.01 | 0.89 | − 0.03 | 0.48 | − 0.03 | 0.60 | 0.00 | 0.97 | 0.00 | 0.97 |
| MIP-1β | − 0.05 | 0.01* | − 0.03 | 0.63 | − 0.01 | 0.75 | − 0.16 | 0.01* | − 0.01 | 0.85 | 0.01 | 0.97 |
| PDGF-BB | − 0.04 | 0.08 | − 0.02 | 0.85 | − 0.08 | 0.03* | − 0.16 | 0.01* | −0.01 | 0.80 | 0.01 | 0.85 |
| RANTES | − 0.01 | 0.88 | 0.01 | 0.87 | − 0.02 | 0.54 | − 0.09 | 0.20 | 0.00 | 0.97 | 0.01 | 0.85 |
| TNF-α | −0.02 | 0.72 | 0.00 | 0.99 | − 0.05 | 0.22 | − 0.05 | 0.44 | 0.00 | 0.97 | 0.00 | 0.97 |
| VEGF | − 0.04 | 0.09 | 0.01 | 0.98 | − 0.03 | 0.48 | − 0.13 | 0.03* | 0.00 | 0.97 | 0.00 | 0.97 |
Chisq tests: p value adjustment method: false discovery rate
Abbreviations: Basic.FGF basic fibroblast growth factor, G.CSF granulocyte colony-stimulating factor, GM granulocyte macrophage colony-stimulating factor, IFN. γ interferon-γ, IL interleukin, IL.1β IL-1 beta, IL.1RA, IL-1 receptor antagonist, IP interferon gamma-inducible protein 10, MCP.1 monocyte chemotactic protein-1, MIP.1α macrophage inflammatory protein-1α, MIP.1β macrophage inflammatory protein-1β, PDGF.BB Platelet derived growth factor-BB, RANTES regulated on activation, normal T cell expressed and secreted, TNF. α tumor necrosis factor-α, VEGF vascular endothelial growth factor. * indicates significant difference at P < 0.05 or better
Correlations between the levels of each of the 27 cytokines were analyzed (Additional file 1: Figures S3 and S4), with Spearman’s (ρ) correlations above 0.80 highlighted (Additional file 1: Tables S5-S7). A network visualization of the Spearman’s rank correlation matrix between cytokine expression values was created and also optimized for networks separated for sex (Fig. 1, Additional file 1: Figure S5). In the optimal graph networks, visual inspection suggests different network topologies for males and females.
Fig. 1.
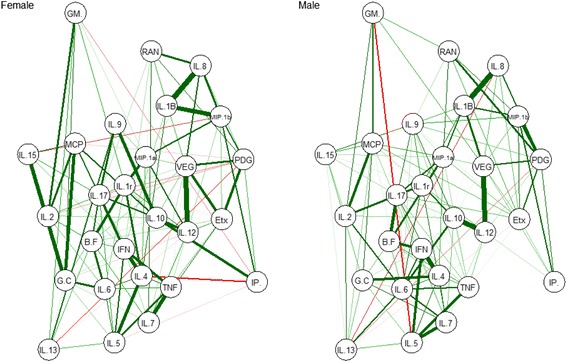
Optimal network graphs representing cytokine correlations separated for sex. Each node represents a cytokine, and each edge represents a Spearman’s correlation between two cytokines. Green edges indicate positive correlations and red edges represent negative correlations. The width of the edge corresponds to the absolute value of the correlation: the higher the correlation, the thicker and more saturated is the edge. Node abbreviations: B.F basic fibroblast growth factor, Etx eotaxin, G.C granulocyte colony-stimulating factor, GM granulocyte macrophage colony-stimulating factor, IFN interferon-gamma, IL interleukin, IL.1B 1 beta, IL.1r IL-1 receptor antagonist, IL.12 IL-12p70, IL.17 IL-17A, IP interferon gamma-inducible protein 10, MCP monocyte chemotactic protein-1, MIP.1a macrophage inflammatory protein-1 alpha, MIP.1b macrophage inflammatory protein-1 beta, PDG platelet-derived growth factor-BB, RAN regulated on activation, normal T cell expressed and secreted, TNF tumor necrosis factor-alpha, VEG vascular endothelial growth factor
Discussion
To our knowledge, this study consists of the largest cohort of male and female ASD children to date investigating the relationship between clinical traits of ASD and cytokine levels. Overall, results show evidence of a significant association between decreased cytokine levels and increasing severity of ASD-related symptoms. In particular, decreased levels of the growth factor PDGF-BB were associated with increased severity of ASD-related symptoms. Results also suggested cytokine expression was moderated by the sex of participants. Exploratory analysis showed that decreased levels of an additional four cytokines (IL-1β, IL-8, MIP-1β, and VEGF) were associated with increased severity of presentation in females only. Additionally, increased levels of IL-8 were associated with greater caregiver reported social difficulties. An interaction effect for age was identified across both males and females, although there were different cytokines interacting with age in males and females. Increasing age in males was associated with higher levels of IL-15, and reduced levels of IL-8 and MIP-1β, while increasing age in females was associated with lower levels of IP-10. There were no associations between the other quantitative clinical traits, sleep behavior or gastrointestinal symptoms, and cytokine levels.
Previous studies have reported associations between levels of various cytokines and aberrant behaviors. For example, higher expression of cytokines, including IL-1β, IL-6, IL-8, and IL-12p40 were associated with more impaired stereotyped patterns of behavior [15] while increased levels of the chemokines MCP-1, RANTES, and eotaxin were associated with worsening behavioral symptoms and cognitive and adaptive ability [14]. Further, lower concentration levels of transforming growth factor beta1 (TGFβ1), a regulatory cytokine, has previously been associated with worsening behavior symptoms and lower adaptive behaviors [52]. These findings are in line with a heightened inflammatory state associated with the severity of autism-related symptoms, a cytokine profile similar to that previously identified in participants with ASD compared to healthy controls [13]. In the present study, higher levels of IL-8, which is involved in the recruitment of predominantly neutrophils to settings of tissue inflammation, were associated with higher severity of social impairments in females only. Our remaining findings revealed primarily decreased levels of significant cytokines associated with increased severity of autism-related symptoms, suggesting an altered cytokine profile may be associated with severity of autism-related symptoms. Unlike the possibility of a negative correlation of levels of PDGF-BB with severity of ASD in males and females identified in this study, a positive association between serum levels of PDGF-BB and worsening stereotyped patterns of behavior has previously been identified in a smaller male only cohort [53]. PDGF-BB has been found to be upregulated in healthy children between ages 7 to 17 compared to younger children and adults [54]. PDGF-BB has a complex profile, with PDGF-BB signaling implicated in development and a range of diseases through numerous roles and pathways [55]. Overall, with the exception of IL-15, a pro-inflammatory cytokine considered to be a central factor in the pathogenesis of celiac disease [56], cytokine levels appeared to decrease with respect to increasing symptom severity. However, for most of these cytokines, these differences did not reach significance at the individual cytokine level.
The association of reduced levels of IL-1β, IL-8, MIP-1β, and VEGF, with higher severity levels of ASD in females suggests sex differences in cytokine expression in children with ASD. This was also supported by the exploratory optimal network visualization graphs of cytokine correlations for males and females. Results from recent DNA analysis suggests that females could be more resilient to genetic insults due to carrying more extreme neurodevelopmental-related genetic mutations than males with the same symptoms [57]. Further investigation, particularly with larger female cohorts of ASD that use repeated testing over time, are now required to further support a potential sex-specific biology underlying different cytokine profiles between males and females with ASD. Our results also suggest that age appears to play an important moderating role in these effects; in males, an overall decline in cytokine levels was associated with increasing age. However, this effect was more mixed in females with only about half of the cytokine levels declining with older age. The physiological changes occurring during the onset of puberty and beyond may contribute to the variations of cytokine levels with age and sex. Age-related changes in cytokine expression in healthy children have been described elsewhere [54, 58, 59], although there is limited age-matched reference data of cytokine expression that can assist with more specific interpretation of these findings.
The results of the present study suggest that an altered cytokine response could be associated with severity of presentation, particularly in females. These results do not corroborate with some previous work that has identified associations between increased levels of pro-inflammatory cytokines and behavioral impairments in ASD, and are also not consistent with peripheral immune system abnormalities in ASD manifesting only as a pro-inflammatory bias [60]. The elucidation of possible neural circuitry mechanisms that are impacted by an aberrant peripheral immune system resulting in downstream changes in behavior are imperative. Evidence from investigations involving a rodent model deficient in adaptive immunity suggest that social deficits may result from impaired circuitry homeostasis derived from dysfunctional immunity [61], supporting the importance of this type of research in ASDs. The heterogeneity in ASD substantially increases the complexity associated with the identification of either markers of a pathological state that manifest in a subgroup of ASD or biomarkers of response to treatment that are specific and sensitive enough to be consistent measures of change.
The objective of this study was to utilize a well characterized cohort to establish if there is a relationship between cytokine levels and symptom severity of ASD and other clinical traits, including variability in social functioning, sleep problems, and gastrointestinal dysfunction. The levels of cytokines were analyzed using fluorescent data. There is a need for consensus in the literature about the use of absolute or fluorescent levels, and the treatment of concentrations obtained below the sensitivity LOD when presenting cytokine data. The use of absolute values has been more common in past autism research [14, 15]; however, the use of fluorescent levels is also an acceptable method [36]. While the concurrent analysis of a control group would have highlighted any cytokine differences between the ASD cohort and healthy controls, these differences have previously been well established [13] and would not facilitate the identification of potential relationships between the immune system aberrations and severity in ASD. The elucidation of these latter relationships have greater potential to contribute to knowledge about the relationship between symptoms and immune function in autism. Control groups typically vary widely on many characteristics beyond autism symptoms and their use in understanding the immune circuitry underpinning autism profiles may be debated. This cohort reflects the ratio of approximately four affected males to one affected female in the general population; however, larger cohorts of females are required to replicate and extend the sex-related findings. Furthermore, the duplication of samples across plates would have clarified the run difference that was linked to sex. The assessment of the severity of ASD-related symptoms undertaken using the ADOS was conducted by one assessor, strengthening the reliability of diagnoses and evaluations of severity. Additionally, ADOS assessments were conducted on the day of blood draw, therefore cytokine expression levels were relevant to that time point. While the ADOS-2 calibrated severity metric was approximated using a large sample [27], it is not representative of a population distribution of ADOS scores. Diagnostic and assessment measures, such as the ADOS, used in the ASD population are primarily behaviorally defined. There is a growing body of evidence implicating comorbid psychopathology and medical conditions in ASD [62–64], highlighting the importance of comprehensive characterization of participants, particularly with respect to the assessment and reporting of all medical and mental health comorbidities. It is possible that there were participants with an undiagnosed comorbidity, allergies or concurrent illness at the time of blood draw that may elevate risk of immune system dysfunction and peripheral upregulation or downregulation of cytokines. Additionally, describing the onset of symptoms is important as previous research has suggested that regression may be associated with elevated cytokine expression [15].
Conclusions
The present study highlights the importance of an interdisciplinary approach to address the complexity of an autism presentation [65], particularly with respect to the pathological significance of immune system abnormalities. Longitudinal investigations in large cohorts with comprehensive, clinically relevant comprehensive biological data relating to medical comorbidities found in ASD, such as sleep disorders, and gastrointestinal and immune dysfunction, and controlling for variables that continually interact with the immune system, such as age, pubertal status, infections, and allergies, are required in order to thoroughly characterize the mechanisms of action behind these types of results. Further work is required to extend these findings to determine whether cytokines can be employed as either a sensitive marker of a pathological state-related to a subgroup in ASD or as a biomarker of response to treatment.
Additional files
Supplementary Information. (DOCX 3801 kb)
Quality and level of detection. (DOCX 728 kb)
Acknowledgements
The authors gratefully acknowledge the families who have contributed to the WAABR. We thank PathWest Laboratory Medicine WA for facilitating collection and access to blood samples, Irma Larma and the Centre for Microscopy, Characterization and Analysis, The University of Western Australia for facilitating multiplex analysis of plasma samples, and Dr. Kirsty Short for her comments on the manuscript. This research was partially supported by a NHMRC project grants (1043664; 1125449) and a Sydney University near-miss grant to Guastella. Author Guastella is funded by a NHMRC Career Development Fellowship (APP1061922). Author Whitehouse is supported by a Senior Research Fellowship (#1077966) from the National Health and Medical Research Council. Author Alvares is funded by the Cooperative Research Centre for Living with Autism (Autism CRC), established and supported under the Australian Government’s Cooperative Research Centres Program.
Funding
This research was partially supported by a NHMRC project grant (1043664) to Guastella and Whitehouse. The funding body had no role in the design of the study and collection, analysis and interpretation of data or in writing of the manuscript.
Availability of data and materials
The datasets used and/or analyzed during the current study are available from the corresponding author on reasonable request.
Abbreviations
- ADOS
Autism diagnostic observation schedule
- ADOS-G
ADOS-Generic
- ASD
Autism spectrum disorder
- BMI
Body mass index
- CSHQ
Children’s Sleep Habits Questionnaire
- DSM
Diagnostic and Statistical Manual of Mental Disorders
- EBIC
Extended Bayesian Information Criterium
- FGF
Fibroblast growth factor
- G-CSF
Granulocyte colony-stimulating factor
- GI
Gastrointestinal
- GM-CSF
Granulocyte–macrophage colony-stimulating factor
- IFN
Interferon
- IL
Interleukin
- IL-1ra
IL1 receptor antagonist
- IP
Interferon gamma induced protein
- IQR
Interquartile range
- LOD
Level of detection
- MCP
Monocyte chemotactic protein
- MICE
Multiple imputation by chained equations
- MIP
Macrophage inflammatory protein
- PDGF
Platelet-derived growth factor
- PL
Parameter logistic
- RANTES
Regulated on activation normal T cell expressed and secreted
- SRS
Social Responsiveness Scale
- TNF
Tumor necrosis factor
- VEGF
Vascular endothelial growth factor
Authors’ contributions
AM contributed to study conception and design, conducted the experiment, assisted with the statistical design, collected, analyzed, and interpreted the data, prepared and critically revised the manuscript, and was responsible for final content. EB assisted with the statistical design, data analysis and interpretation and the preparation of the manuscript. GA collected and interpreted the data, revised the manuscript for intellectual content, and was responsible for final content. NG reviewed data analysis procedures, interpreted data, and revised the manuscript for intellectual content. IBH interpreted data and revised the manuscript for intellectual content. AH collected data and revised the manuscript for intellectual content. JH, JB, DR, and JW established the data collection protocols, interpreted the data and critically appraised the manuscript. AJOW established the data collection protocols, collected and interpreted data, and revised the manuscript for intellectual content. AJG contributed to the study conception and design, interpreted the data and critically revised the manuscript for intellectual content. All authors read and approved the final manuscript.
Ethics approval and consent to participate
Ethics approval was granted by the Human Ethics Committee at Princess Margaret Hospital for Children in Perth, Western Australia, and informed consent was provided by the primary caregiver prior to participation.
Consent for publication
Not applicable.
Competing interests
Author IBH is a Commissioner in Australia’s new National Mental Health Commission from 2012. He is the Co-Director, Health and Policy at the Brain and Mind Centre which operates two early-intervention youth services under contract to headspace. IBH has led a range of community-based and pharmaceutical industry-supported depression awareness and education and training programs. He has led projects for health professionals and the community supported by governmental, community agency, and pharmaceutical industry partners (Wyeth, Eli Lily, Servier, Pfizer, AstraZeneca) for the identification and management of depression and anxiety. He has received honoraria for presentations of his own work at educational seminars supported by a number of non-government organizations and the pharmaceutical industry (including Servier, Pfizer, AstraZeneca, and Eli Lilly). He is a member of the Medical Advisory Panel for Medibank Private and also a Board Member of Psychosis Australia Trust. He leads an investigator-initiated study of the effects of agomelatine on circadian parameters (supported in part by Servier) and has participated in a multicenter clinical trial of the effects of agomelatine on sleep architecture in depression and a Servier-supported study of major depression and sleep disturbance in primary care settings.
The remaining authors declare they have no competing interests.
Publisher’s Note
Springer Nature remains neutral with regard to jurisdictional claims in published maps and institutional affiliations.
Footnotes
Electronic supplementary material
The online version of this article (10.1186/s13229-017-0176-2) contains supplementary material, which is available to authorized users.
Contributor Information
Anne Masi, Email: amas3888@usyd.edu.au.
Edmond J. Breen, Email: EBreen@proteome.org.au
Gail A. Alvares, Email: Gail.Alvares@telethonkids.org.au
Nicholas Glozier, Email: nick.glozier@sydney.edu.au.
Ian B. Hickie, Email: ian.hickie@sydney.edu.au
Anna Hunt, Email: Anna.Hunt@telethonkids.org.au.
Jennie Hui, Email: jennie.hui@uwa.edu.au.
John Beilby, Email: John.Beilby@health.wa.gov.au.
David Ravine, Email: david.ravine@uwa.edu.au.
John Wray, Email: John.Wray@health.wa.gov.au.
Andrew J. O. Whitehouse, Email: Andrew.Whitehouse@telethonkids.org.au
Adam J. Guastella, Phone: +61 2 351 0539, Email: adam.guastella@sydney.edu.au
References
- 1.CDC Prevalence of autism spectrum disorder among children aged 8 years—autism and developmental disabilities monitoring network, 11 sites, United States, 2010. Morbidity and Mortality Weekly Report: Surveillance Summaries. 2014;63:1–14. [PubMed] [Google Scholar]
- 2.American Psychiatric Association . Diagnostic and statistical manual of mental disorders. 5. Washington, DC: American Psychiatric Press; 2013. [Google Scholar]
- 3.Howlin P, Goode S, Hutton J, Rutter M. Adult outcome for children with autism. J Child Psychol Psychiatry. 2004;45:212–229. doi: 10.1111/j.1469-7610.2004.00215.x. [DOI] [PubMed] [Google Scholar]
- 4.Szatmari P, Georgiades S, Duku E, et al. Developmental trajectories of symptom severity and adaptive functioning in an inception cohort of preschool children with autism spectrum disorder. JAMA Psychiatry. 2015;72:276–283. doi: 10.1001/jamapsychiatry.2014.2463. [DOI] [PubMed] [Google Scholar]
- 5.Fein D, Barton M, Eigsti IM, Kelley E, Naigles L, Schultz RT, Stevens M, Helt M, Orinstein A, Rosenthal M. Optimal outcome in individuals with a history of autism. J Child Psychol Psychiatry. 2013;54:195–205. doi: 10.1111/jcpp.12037. [DOI] [PMC free article] [PubMed] [Google Scholar]
- 6.Werling DM, Geschwind DH. Sex differences in autism spectrum disorders. Curr Opin Neurol. 2013;26:146–153. doi: 10.1097/WCO.0b013e32835ee548. [DOI] [PMC free article] [PubMed] [Google Scholar]
- 7.Kirkovski M, Enticott PG, Fitzgerald PB. A review of the role of female gender in autism spectrum disorders. J Autism Dev Disord. 2013;43:2584–2603. doi: 10.1007/s10803-013-1811-1. [DOI] [PubMed] [Google Scholar]
- 8.Huguet G, Ey E, Bourgeron T. The genetic landscapes of autism spectrum disorders. Annu Rev Genomics Hum Genet. 2013;14:191–213. doi: 10.1146/annurev-genom-091212-153431. [DOI] [PubMed] [Google Scholar]
- 9.Herbert MR. Contributions of the environment and environmentally vulnerable physiology to autism spectrum disorders. Curr Opin Neurol. 2010;23:103–110. doi: 10.1097/WCO.0b013e328336a01f. [DOI] [PubMed] [Google Scholar]
- 10.Croen LA, Braunschweig D, Haapanen L, Yoshida CK, Fireman B, Grether JK, Kharrazi M, Hansen RL, Ashwood P, Van de Water J. Maternal mid-pregnancy autoantibodies to fetal brain protein: the early markers for autism study. Biol Psychiatry 2008; 64:583-588. [DOI] [PMC free article] [PubMed]
- 11.Mead J, Ashwood P. Evidence supporting an altered immune response in ASD. Immunol Lett. 2015;163:49–55. doi: 10.1016/j.imlet.2014.11.006. [DOI] [PubMed] [Google Scholar]
- 12.Gesundheit B, Rosenzweig JP, Naor D, Lerer B, Zachor DA, Procházka V, Melamed M, Kristt DA, Steinberg A, Shulman C, et al. Immunological and autoimmune considerations of autism Spectrum disorders. J Autoimmun. 2013;44:1–7. doi: 10.1016/j.jaut.2013.05.005. [DOI] [PubMed] [Google Scholar]
- 13.Masi A, Quintana DS, Glozier N, Lloyd AR, Hickie IB, Guastella AJ. Cytokine aberrations in autism spectrum disorder: a systematic review and meta-analysis. Mol Psychiatry. 2015;20:440–446. doi: 10.1038/mp.2014.59. [DOI] [PubMed] [Google Scholar]
- 14.Ashwood P, Krakowiak P, Hertz-Picciotto I, Hansen R, Pessah IN, Van de Water J. Associations of impaired behaviors with elevated plasma chemokines in autism spectrum disorders. J Neuroimmunol. 2011;232:196–199. doi: 10.1016/j.jneuroim.2010.10.025. [DOI] [PMC free article] [PubMed] [Google Scholar]
- 15.Ashwood P, Krakowiak P, Hertz-Picciotto I, Hansen R, Pessah I, Van de Water J. Elevated plasma cytokines in autism spectrum disorders provide evidence of immune dysfunction and are associated with impaired behavioral outcome. Brain Behav Immun. 2011;25:40–45. doi: 10.1016/j.bbi.2010.08.003. [DOI] [PMC free article] [PubMed] [Google Scholar]
- 16.Napolioni V, Ober-Reynolds B, Szelinger S, Corneveaux JJ, Pawlowski T, Ober-Reynolds S, Kirwan J, Persico AM, Melmed RD, Craig DW, et al. Plasma cytokine profiling in sibling pairs discordant for autism spectrum disorder. J Neuroinflammation. 2013;10:38. doi: 10.1186/1742-2094-10-38. [DOI] [PMC free article] [PubMed] [Google Scholar]
- 17.Veatch OJ, Maxwell-Horn AC, Malow BA. Sleep in autism Spectrum disorders. Curr Sleep Med Rep. 2015;1:131–140. doi: 10.1007/s40675-015-0012-1. [DOI] [PMC free article] [PubMed] [Google Scholar]
- 18.McElhanon BO, McCracken C, Karpen S, Sharp WG. Gastrointestinal symptoms in autism spectrum disorder: a meta-analysis. Pediatrics. 2014;133:872–883. doi: 10.1542/peds.2013-3995. [DOI] [PubMed] [Google Scholar]
- 19.Mannion A, Leader G, Healy O. An investigation of comorbid psychological disorders, sleep problems, gastrointestinal symptoms and epilepsy in children and adolescents with autism Spectrum disorder. Res Autism Spectr Disord. 2013;7:35–42. doi: 10.1016/j.rasd.2012.05.002. [DOI] [Google Scholar]
- 20.Halladay AK, Bishop S, Constantino JN, Daniels AM, Koenig K, Palmer K, Messinger D, Pelphrey K, Sanders SJ, Singer AT, et al. Sex and gender differences in autism spectrum disorder: summarizing evidence gaps and identifying emerging areas of priority. Mol Autism. 2015;6:1–5. doi: 10.1186/s13229-015-0019-y. [DOI] [PMC free article] [PubMed] [Google Scholar]
- 21.Fombonne E. Epidemiology of pervasive developmental disorders. Pediatr Res. 2009;65:591–598. doi: 10.1203/PDR.0b013e31819e7203. [DOI] [PubMed] [Google Scholar]
- 22.Manzardo AM, Henkhaus R, Dhillon S, Butler MG. Plasma cytokine levels in children with autistic disorder and unrelated siblings. Int J Dev Neurosci. 2012;30:121–127. doi: 10.1016/j.ijdevneu.2011.12.003. [DOI] [PMC free article] [PubMed] [Google Scholar]
- 23.Schneider T, Roman A, Basta-Kaim A, Kubera M, Budziszewska B, Schneider K, Przewlocki R. Gender-specific behavioral and immunological alterations in an animal model of autism induced by prenatal exposure to valproic acid. Psychoneuroendocrinology. 2008;33:728–740. doi: 10.1016/j.psyneuen.2008.02.011. [DOI] [PubMed] [Google Scholar]
- 24.Taylor LJ, Maybery MT, Wray J, Ravine D, Hunt A, Whitehouse AJO. Are there differences in the behavioural phenotypes of autism Spectrum disorder probands from simplex and multiplex families? Res Autism Spectr Disord. 2015;11:56–62. doi: 10.1016/j.rasd.2014.12.003. [DOI] [Google Scholar]
- 25.Lord C, Petkova E, Hus V, Gan W, Lu F, Martin D, Ousley O, Guy L, Bernier R, et al. A multisite study of the clinical diagnosis of different autism spectrum disorders. Arch Gen Psychiatry. 2012;69:306–313. doi: 10.1001/archgenpsychiatry.2011.148. [DOI] [PMC free article] [PubMed] [Google Scholar]
- 26.Lord C, Risi S, Lambrecht L, Cook EH, Jr, Leventhal BL, DiLavore PC, Pickles A, Rutter M. The autism diagnostic observation schedule-generic: a standard measure of social and communication deficits associated with the spectrum of autism. J Autism Dev Disord. 2000;30:205–223. doi: 10.1023/A:1005592401947. [DOI] [PubMed] [Google Scholar]
- 27.Gotham K, Pickles A, Lord C. Standardizing ADOS scores for a measure of severity in autism spectrum disorders. J Autism Dev Disord. 2009;39:693–705. doi: 10.1007/s10803-008-0674-3. [DOI] [PMC free article] [PubMed] [Google Scholar]
- 28.Hus V, Lord C. The autism diagnostic observation schedule, module 4: revised algorithm and standardized severity scores. J Autism Dev Disord. 2014;44:1996–2012. doi: 10.1007/s10803-014-2080-3. [DOI] [PMC free article] [PubMed] [Google Scholar]
- 29.Shumway S, Farmer C, Thurm A, Joseph L, Black D, Golden C. The ADOS calibrated severity score: relationship to phenotypic variables and stability over time. Autism Res. 2012;5:267–276. doi: 10.1002/aur.1238. [DOI] [PMC free article] [PubMed] [Google Scholar]
- 30.Lord C, Rutter M, Di Lavore P, Risi S, Gotham K, Bishop S. Autism diagnostic observation schedule, second edition (ADOS-2) Los Angeles: Western Psychological Services; 2012. [Google Scholar]
- 31.Hus V, Gotham K, Lord C. Standardizing ADOS domain scores: separating severity of social affect and restricted and repetitive behaviors. J Autism Dev Disord. 2014;44:2400–2412. doi: 10.1007/s10803-012-1719-1. [DOI] [PMC free article] [PubMed] [Google Scholar]
- 32.Constantino J, Davis S, Todd R, Schindler M, Gross M, Brophy S, Metzger L, Shoushtari C, Splinter R, Reich W. Validation of a brief quantitative measure of autistic traits: comparison of the social responsiveness scale with the autism diagnostic interview-revised. J Autism Dev Disord. 2003;33:427–433. doi: 10.1023/A:1025014929212. [DOI] [PubMed] [Google Scholar]
- 33.Owens JA, Spirito A, McGuinn M. The Children’s sleep habits questionnaire (CSHQ): psychometric properties of a survey instrument for school-aged children. Sleep. 2000;23:1043–1052. doi: 10.1093/sleep/23.8.1d. [DOI] [PubMed] [Google Scholar]
- 34.Rosenberg-Hasson Y, Hansmann L, Liedtke M, Herschmann I, Maecker HT. Effects of serum and plasma matrices on multiplex immunoassays. Immunol Res. 2014;58:224–233. doi: 10.1007/s12026-014-8491-6. [DOI] [PMC free article] [PubMed] [Google Scholar]
- 35.Wadhwa M, Mire-Sluis A, Thorpe R. Standardization and calibration of cytokine immunoassays. Revue de l'ACOMEN. 1999;5
- 36.Breen EJ, Polaskova V, Khan A. Bead-based multiplex immuno-assays for cytokines, chemokines, growth factors and other analytes: median fluorescence intensities versus their derived absolute concentration values for statistical analysis. Cytokine. 2015;71:188–198. doi: 10.1016/j.cyto.2014.10.030. [DOI] [PubMed] [Google Scholar]
- 37.Breen EJ, Tan W, Khan A. The statistical value of raw fluorescence signal in Luminex xMAP based multiplex immunoassays. Sci Rep. 2016;6:26996. doi: 10.1038/srep26996. [DOI] [PMC free article] [PubMed] [Google Scholar]
- 38.Davis D, Zhang A, Torrence J, Emily D. Selection of standards for bio-Plex cytokine assays. In: Tech note 2900: bio-Rad 2900.
- 39.Azur MJ, Stuart EA, Frangakis C, Leaf PJ. Multiple imputation by chained equations: what is it and how does it work? Int J Methods Psychiatr Res. 2011;20:40–49. doi: 10.1002/mpr.329. [DOI] [PMC free article] [PubMed] [Google Scholar]
- 40.van Buuren S, Groothuis-Oudshoorn K. Mice: multivariate imputation by chained equations in R. Journal of statistical software. 2011; 45.
- 41.Chavent M, Kuentz-Simonet V, Liquet B, Saracco J. ClustOfVar: an R package for the clustering of variables. J Stat Softw. 2012;50:1–16. doi: 10.18637/jss.v050.i13. [DOI] [Google Scholar]
- 42.Venables WN, Ripley BD. Modern applied statistics with S. New York: Springer; 2002. [Google Scholar]
- 43.Fox J, Weisberg S. An {R} companion to applied regression. 2. Thousand Oaks: Sage; 2011. [Google Scholar]
- 44.phia: Post-Hoc Interaction Analysis. R package. http://CRAN.R-project.org/package=phia.
- 45.Hothorn T, Hornik K, van de Wiel MA, Achim Z. Implementing a class of permutation tests: the coin package. J Stat Softw. 2008;28:1–23. doi: 10.18637/jss.v028.i08. [DOI] [Google Scholar]
- 46.Holm S. A simple sequentially Rejective multiple test procedure. Scand J Stat. 1979;6:65–70. [Google Scholar]
- 47.Epskamp S, Cramer AOJ, Waldorp LJ, Schmittmann VD, Borsboom D. Qgraph: network visualizations of relationships in psychometric data. J Stat Softw. 2012;48:1–18. doi: 10.18637/jss.v048.i04. [DOI] [Google Scholar]
- 48.Fruchterman T, Reingold E. Graph drawing by force-directed placement. Software: Practice and Experience. 1991;21:1129–1164. [Google Scholar]
- 49.Meinshausen N, Bühlmann P. High-dimensional graphs and variable selection with the lasso. Ann Stat. 2006:1436–62.
- 50.Friedman J, Hastie T, Tibshirani R. Sparse inverse covariance estimation with the graphical lasso. Biostatistics. 2008;9:432–441. doi: 10.1093/biostatistics/kxm045. [DOI] [PMC free article] [PubMed] [Google Scholar]
- 51.van Borkulo CD, Borsboom D, Epskamp S, Blanken TF, Boschloo L, Schoevers RA, Waldorp LJ. A new method for constructing networks from binary data. Sci Rep 2014; 4:5918. [DOI] [PMC free article] [PubMed]
- 52.Ashwood P, Enstrom A, Krakowiak P, Hertz-Picciotto I, Hansen RL, Croen LA, Ozonoff S, Pessah IN, Van de Water J. Decreased transforming growth factor beta1 in autism: a potential link between immune dysregulation and impairment in clinical behavioral outcomes. J Neuroimmunol. 2008;204:149–153. doi: 10.1016/j.jneuroim.2008.07.006. [DOI] [PMC free article] [PubMed] [Google Scholar]
- 53.Kajizuka M, Miyachi T, Matsuzaki H, Iwata K, Shinmura C, Suzuki K, Suda S, Tsuchiya KJ, Matsumoto K, Iwata Y, et al. Serum levels of platelet-derived growth factor BB homodimers are increased in male children with autism. Prog Neuro-Psychopharmacol Biol Psychiatry. 2010;34:154–158. doi: 10.1016/j.pnpbp.2009.10.017. [DOI] [PubMed] [Google Scholar]
- 54.Kleiner G, Marcuzzi A, Zanin V, Monasta L, Zauli G. Cytokine levels in the serum of healthy subjects. Mediat Inflamm. 2013;2013:6. doi: 10.1155/2013/434010. [DOI] [PMC free article] [PubMed] [Google Scholar]
- 55.Andrae J, Gallini R, Betsholtz C. Role of platelet-derived growth factors in physiology and medicine. Genes Dev. 2008;22:1276–1312. doi: 10.1101/gad.1653708. [DOI] [PMC free article] [PubMed] [Google Scholar]
- 56.Benahmed M, Meresse B, Arnulf B, Barbe U, Mention JJ, Verkarre V, Allez M, Cellier C, Hermine O. Cerf–Bensussan N. Inhibition of TGF-β signaling by IL-15: a new role for IL-15 in the loss of immune homeostasis in celiac disease. Gastroenterology. 2007;132:994–1008. doi: 10.1053/j.gastro.2006.12.025. [DOI] [PubMed] [Google Scholar]
- 57.Jacquemont S, Coe BP, Hersch M, Duyzend MH, Krumm N, Bergmann S, Beckmann JS, Rosenfeld JA, Eichler EE. A higher mutational burden in females supports a “female protective model” in neurodevelopmental disorders. Am J Hum Genet. 2014;94:415–425. doi: 10.1016/j.ajhg.2014.02.001. [DOI] [PMC free article] [PubMed] [Google Scholar]
- 58.Hartel C, Adam N, Strunk T, Temming P, Muller-Steinhardt M, Schultz C. Cytokine responses correlate differentially with age in infancy and early childhood. Clin Exp Immunol. 2005;142:446–453. doi: 10.1111/j.1365-2249.2005.02928.x. [DOI] [PMC free article] [PubMed] [Google Scholar]
- 59.Chang W-S, Kim E-J, Lim Y-M, Yoon D, Son J-Y, Park J-W, Hong S-J, Cho S-H, Lee J-S. Age-related changes in immunological factors and their relevance in allergic disease development during childhood. Allergy Asthma Immunol Res. 2016;8:338–345. doi: 10.4168/aair.2016.8.4.338. [DOI] [PMC free article] [PubMed] [Google Scholar]
- 60.Rose D, Ashwood P. Potential cytokine biomarkers in autism spectrum disorders. Biomark Med. 2014;8:1171–1181. doi: 10.2217/bmm.14.39. [DOI] [PubMed] [Google Scholar]
- 61.Filiano AJ, Xu Y, Tustison NJ, Marsh RL, Baker W, Smirnov I, Overall CC, Gadani SP, Turner SD, Weng Z, et al. Unexpected role of interferon-γ in regulating neuronal connectivity and social behaviour. Nature. 2016;535:425–429. doi: 10.1038/nature18626. [DOI] [PMC free article] [PubMed] [Google Scholar]
- 62.Brereton AV, Tonge BJ, Einfeld SL. Psychopathology in children and adolescents with autism compared to young people with intellectual disability. J Autism Dev Disord. 2006;36:863–870. doi: 10.1007/s10803-006-0125-y. [DOI] [PubMed] [Google Scholar]
- 63.Bauman ML. Medical comorbidities in autism: challenges to diagnosis and treatment. Neurotherapeutics. 7:320–7. [DOI] [PMC free article] [PubMed]
- 64.Matson JL, Nebel-Schwalm MS. Comorbid psychopathology with autism spectrum disorder in children: an overview. Res Dev Disabil. 2007;28:341–352. doi: 10.1016/j.ridd.2005.12.004. [DOI] [PubMed] [Google Scholar]
- 65.Aldinger KA, Lane CJ, Veenstra-VanderWeele J, Levitt P. Patterns of risk for multiple co-occurring medical conditions replicate across distinct cohorts of children with autism Spectrum disorder. Autism Res. 2015;8:771–781. doi: 10.1002/aur.1492. [DOI] [PMC free article] [PubMed] [Google Scholar]
Associated Data
This section collects any data citations, data availability statements, or supplementary materials included in this article.
Supplementary Materials
Supplementary Information. (DOCX 3801 kb)
Quality and level of detection. (DOCX 728 kb)
Data Availability Statement
The datasets used and/or analyzed during the current study are available from the corresponding author on reasonable request.