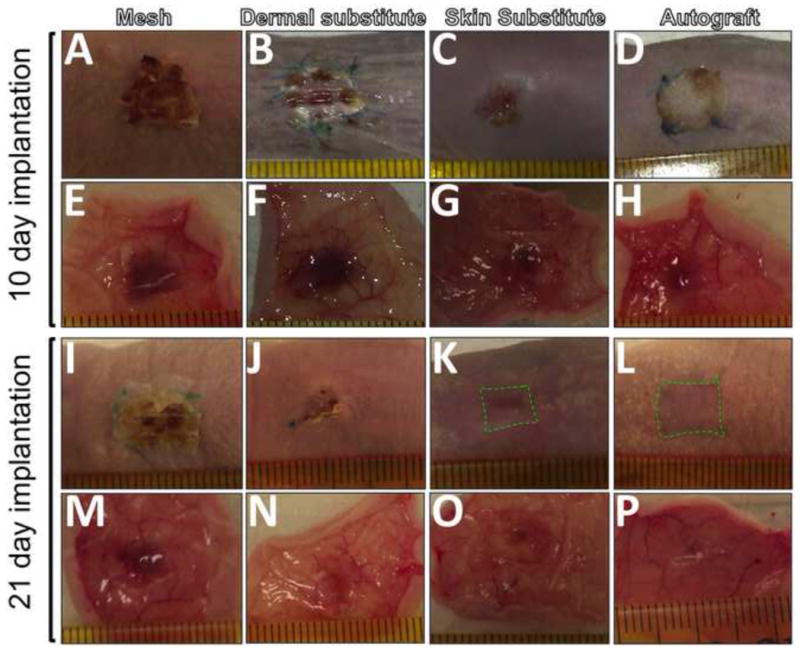
Figure 7.

Macroscopic overview of the full-thickness wounds treated with various grafts for 10 (A-H) and 21 days (I-P). Images were taken from outside (A-D, I-L) or inside (EH, M-P) of the treated wounds. The contraction edge was outlined in green broken line.
