

Abstract
Background
The effects of high dose folic acid (FA) supplementation in healthy individuals on blood folate concentrations and immune response are unknown.
Objective
The aim of the study was to evaluate the effects of daily consumption of a tablet containing 5 mg of FA on serum folate; number and cytotoxicity of natural killer (NK) cells; mRNA expression of dihydrofolate reductase (DHFR), methylenetetrahydrofolate reductase (MTHFR), interferon-γ (IFNG), tumor necrosis factor-α (TNFA) and interleukin-8 (IL8) genes; and concentrations of serum inflammatory markers.
Methods
This prospective clinical trial was conducted in 30 healthy Brazilian adults, (15 women), aged 27.7 y (95% CI: 26.4, 29.1 y), with a body mass index (in kg/m2) of 23.1 (95% CI: 22.0, 24.3). Blood was collected at baseline and after 45 and 90 d of intervention. Serum folate concentrations were measured by microbiologic assay and HPLC-tandem mass spectrometry [folate forms, including unmetabolized folic acid (UMFA)]. We used real-time polymerase chain reaction to assess mononuclear leukocyte mRNA expression and flow cytometry to measure the number and cytotoxicity of NK cells.
Results
Serum folate concentration increased by ~5-fold after the intervention (P < 0.001), and UMFA concentrations increased by 11.9- and 5.9-fold at 45 and 90 d, respectively, when compared with baseline (P < 0.001). UMFA concentrations increased (> 1.12 nmol/L) in 29 (96.6%) participants at day 45 and in 26 (86.7%) participants at day 90. We observed significant reduction in the number (P < 0.001) and cytotoxicity (P = 0.003) of NK cells after 45 and 90 d. Compared with baseline, DHFR mRNA expression was higher at 90 d (P = 0.006) and IL8 and TNFA mRNA expressions were higher at 45 and 90 d (P = 0.001 for both).
Conclusion
This noncontrolled intervention showed that healthy adults responded to a high dose FA supplement with increased UMFA concentrations, changes in cytokine mRNA expression, and reduced number and cytotoxicity of NK cells. This trial was registered at www.ensaiosclinicos.gov.br as RBR-2pr7zp.
Keywords: folic acid supplementation, unmetabolized folic acid, NK cell cytotoxicity, mRNA expression, serum folate, 5-methyl-THF
INTRODUCTION
Folate plays an important role in one-carbon transfer reactions, participating in DNA, RNA, and protein methylation reactions; nucleic acid synthesis; and gene expression regulation (1, 2). Folate requirements are increased during pathological conditions, such as cancer and hemolytic anemias, but also during physiological conditions, such as certain age groups, pregnancy, and lactation (3–5).
To avoid folate deficiency, Brazilian patients with chronic hemolytic anemia are usually given folic acid (FA) supplements at 5 mg/d during virtually their entire lives. Furthermore, the Brazilian government recommends that women who want to conceive or are pregnant take 5 mg FA/d (6), which is higher than the 0.4–0.6 mg/d recommended in other countries with FA fortification programs, such as the United States. In fact, the 5-mg FA supplement is the main formulation available in Brazil. This vitamin dose is 5 times that of the Tolerable Upper Intake Levels for healthy individuals (7). The effects of high-dose FA supplementation on blood folate concentrations and inflammatory markers, and on the number and cytotoxicity of NK cells, are not known.
Different from the naturally occurring food folate, FA is a synthetic, oxidized form of folate that is found in fortified foods and supplements. FA must be reduced first to dihydrofolate and then to tetrahydrofolate (THF) by dihydrofolate reductase (DHFR) before it can be incorporated into the active cellular folate pool (8). Higher amounts of FA intake exceed the enzyme’s capacity to reduce the vitamin, resulting in the appearance of unmetabolized FA (UMFA) in plasma (9, 10). Thus, circulating UMFA implies, hypothetically, that the body’s capacity to convert FA to metabolically active folate has been exceeded (11).
Currently, there is concern about the possibility of potential adverse effects of FA when used in high amounts over extended periods of time. The 2015 report from the National Toxicology Program on safe use of high intakes of FA provides a current review and discussion, with special focus on four categories of potential adverse health effects: cancer, cognition in conjunction with vitamin B-12 deficiency, hypersensitivity-related outcomes, and thyroid and diabetes-related disorders (12). However, these findings still need to be reproduced in a more rigorous way, if they are detected in specific populations.
In a select population of obese, postmenopausal, white women, Troen et al. (13) found an association between plasma UMFA concentrations and reduced NK cell cytotoxicity, whereas an in vitro study carried out by Hirsch et al. (14) did not find such an association. NK cells comprise 5–25% of peripheral blood lymphocytes (15), and provide an important effector arm of the innate immune system, mediating spontaneous “natural” cytotoxicity toward certain tumor and virus-infected cells. Furthermore, NK cells are also a major source of some cytokines, such as IFN-γ and TNF-α (16, 17). However, at present, it is unclear whether increased or decreased NK activity has any beneficial or adverse health effects.
The effects of daily high dosages of FA on blood folate concentrations are well described (18, 19), but the effects on immune function in healthy individuals are less well known. Thus, the objective of this study was to evaluate the effect of a high-dose FA supplement (5 mg/d over 90 d) in common use in Brazil and other countries on blood concentrations of folate and inflammatory markers, number and cytotoxicity of NK cells, and mRNA expression of 5 genes in a small convenience sample of healthy Brazilian individuals.
MATERIALS AND METHODS
Participants and study design
The current study was a clinical trial registered in the Brazilian registry of clinical trials (ReBEC; http://www.ensaiosclinicos.gov.br: RBR-2pr7zp). Thirty healthy men and women (15 of each sex) were recruited from the pool of students or staff of the University of Sao Paulo, Sao Paulo, Brazil. These participants were invited by pamphlets and their participation was voluntary. The Institutional Ethics Committee approved this study (CNS 466/12, CAEE 04389512.2.000.0067) and a written informed consent was obtained from all participants before their inclusion in the study. The analysis of blinded specimens by the CDC Nutritional Biomarkers Laboratory (serum folate forms) did not constitute engagement in human subject research. Other blood measurements were performed in laboratories at the University of Sao Paulo, Brazil.
Participants were subjected to an intervention study with daily consumption of one tablet containing 5 mg FA for 90 d. The vitamin used in the intervention was the same brand (Afopic; Teuto) and lot number for all participants. Adherence to the study was confirmed with tablet counting and regular phone reminders, as well as when the next box of 5-mg FA was provided. The exclusion criteria were as follows: age <18 y, chronic alcoholism, acute or chronic diseases, pregnancy, use of medications (immunosuppressive, multivitamins, FA and vitamin B-12 supplements), or individuals who donated blood within the past 6 mo.
Peripheral venous blood samples (40 mL) were obtained at baseline from each participant after an overnight fast (≥8 h) by using the Vacutainer system (Becton Dickinson). Dried vacuum tubes were used to obtain serum; tubes containing K2EDTA were used to perform complete blood and reticulocytes count, DNA extraction and to obtain plasma; and tubes containing sodium heparin were used for the separation of mononuclear leucocytes, extraction of RNA and to obtain plasma. The same procedures were performed at day 45 (T45) and at day 90 (T90), with overnight fast (≥8h) venous blood collection for each participant, by using similar tubes and volume, ensuring that the last use of 5-mg FA tablet was 24h before blood sampling. To ensure that blood collection was performed >24h after the last FA tablet was taken, we contacted the participants before T45 and T90, and requested that they take the FA tablet before 09:00 on day 44 and day 89. We also requested to the participants to take that FA tablet after blood collection at T45. No participants reported any side effects related to the vitamin use.
Serum vitamin concentrations and plasma total homocysteine
Serum folate was determined by a microbiologic assay with the use of Lactobacillus casei (chloramphenicol-resistant strain NCIB 10463), and FA (F7876 Sigma Aldrich folic acid 98%) was used as calibrator (20). The limit of detection was 0.03 nmol/L.
Concentrations of serum folate forms [UMFA, tetrahydrofolate (THF), 5-methyl-THF, 5-formyl-THF, 5,10-methenyl-THF, and MeFox (an oxidation product of 5-methyl-THF)] were analyzed by HPLC-tandem MS (HPLC-MS/MS) (21). The limit of detection to UMFA, 5-methyl-THF, THF, 5-formyl-THF, 5,10-methenyl-THF, and MeFox were 0.14, 0.13, 0.25, 0.20, 0.20, and 0.10 nmol/L, respectively. Serum total folate was calculated as the sum of these folate forms excluding MeFox.
Serum vitamin B-12 was determined by microbiologic assay with the use of colistin sulfate-resistant strain of Lactobacillus leishmannii (22,23). The limit of detection was 36.9 pmol/L. Plasma total homocysteine (tHcy) was measured by using a chemiluminescent immunoassay on the IMMULITE 2000 analyzer (Siemens Healthcare). The limit of detection was 2 μmol/L.
Determination of Complete Blood Count and reticulocytes
A complete blood count and reticulocyte counts were determined in EDTA whole-blood samples on an electronic analyzer Pentra 120 (Horiba).
Concentrations of serum high-sensitivity C-reactive protein and serum activity of lactate dehydrogenase
High-sensitivity C-reactive protein (hs-CRP) was determined by an immunoturbidimetric assay using the Roche-CRPL kit on the Cobas 8000 analyzer (Roche Diagnostics). Lactate dehydrogenase (LDH) activity was determined by an enzymatic assay using the Vitros 250 analyzer (Ortho Clinical Diagnostics).
Concentrations of serum cytokines
The cytokines IL-6, IL-8, IL-10, IFN-γ and TNF-α were determined by a multiplex immunoassay, the high-sensitivity panel T Cell Magnetic Bead Milliplex Map (EMD Millipore Corporation) on the Bio-PLex 200 analyzer (Bio-Rad Laboratories, Inc.), following the manufacturer’s protocols.
Determination of number and cytotoxicity of NK cells
Sample preparation (effector and target cells) and NK cell identification, as well as determining the number of NK cells, were performed on the day of blood collection as previous described (24). Briefly, target cells (human chronic myelogenous leukemia cell line K562 in the log phase) were previously labelled by adding Dioctadecyloxacarbocyanine perchlorate (DiO) and adjusted to a concentration of 106 cells/mL in phosphate buffer. Effector (mononuclear cells) and target cells were added in tubes to create four different effector-to-target ratios of 25:1, 12.5:1, 6.25:1 and 3.125:1 (each proportion in duplicate) and incubated for 2h at 37° C in a 5% CO2 incubator, with addition of 0.15 mM propidium iodide (PI). The NK cytotoxicity assay was than performed by using FACS Canto II (BD Biosciences) equipment. A total of 20,000 events were acquired. Cells marked with both DiO and PI were considered dead target cells, whereas those positive only for DiO represented surviving target cells. Controls comprised target cells only plus PI and effector cells only plus PI and were used to determine spontaneous lysis and nonviable effector cells, respectively.
In this assay, the lytic unit was defined as the number of effector cells (NK) required to lyse 15% of target cells. Cytotoxic capacity of NK cells was defined as the ratio of the “number of NK cells in 1 mL of whole blood” per lytic unit.
DHFR 19-bp deletion polymorphism analysis
DNA was obtained from total blood with the use of QIAMP Blood DNA Mini Kit (Qiagen). Genotyping for DHFR 19-bp deletion (rs70991108) was performed by PCR according to the previously described methods (25).
Isolation of total RNA, cDNA synthesis and mRNA expression
Peripheral blood mononuclear cell total RNA was extracted by using Trizol® reagent (Invitrogen), following the manufacturer’s instructions. The concentration of total RNA extracted was determined by spectrophotometry at 260 nm with the use of Nanodrop ND-1000 (Thermo Scientific), and integrity was evaluated by 1% agarose gel electrophoresis stained with GelRed. The cDNA was synthesized from 500 ng of RNA by using the High-Capacity RNA-to-cDNA kit (Invitrogen Life Technologies) in a final volume of 20 μL according to the manufacturer’s instructions.
mRNA expression of DHFR, methylenetetrahydrofolate reductase (MTHFR), interferon-γ (IFNG), tumor necrosis factor-α (TNFA) and IL8 genes were performed by real-time PCR with the use of TaqMan assays (Hs00758822_s1, Hs00195560_m1, Hs00989291_m1, Hs01113624_g1, Hs01553824_g1; Applied Biosystems). Six genes [β2-microglobulin (B2M), GAPDH, hydroxymethylbilane sinthase (HMBS), hypoxantine phosphoribolsyltransferase 1 (HPRT1), actin β (ACTB), and ubiquitin C (UBC) were tested by using geNorm software (26) in order to evaluate the most stable genes under experimental conditions, and ACTB and HPRT1 was chosen as the reference genes (TaqMan assays Hs01060665_g1 and Hs02800695_m1, respectively). The mRNA expression results were normalized by ACTB and HPRT1 housekeeping mRNA expression mean and calculated by 2−ΔCT as described by Livak and Schmittgen (27). All reactions were executed in duplicate, and each reaction plate was analyzed in the presence of a negative control to assess possible reagent contamination.
BMI
Body weight was measured with each participant wearing only light clothing and no shoes, to the nearest 0.1 kg by using a digital weight scale (Kratos). Height was measured to the nearest 0.1 cm by using a portable stadiometer (Alturexata). BMI was calculated by dividing weight (kg) divided by height- squared (in meters). Participants were classified as underweight [BMI (kg/m2) <18.5], normal weight (BMI: 18.5–24.9), overweight (BMI 25.0-29.9), or obese (BMI ≥30.0) (28).
Cut-off points
Serum folate concentrations <7.0 and >45 nmol/L were considered to represent folate deficiency and high concentration, respectively (29). High serum UMFA was defined as >1.12 nmol/L, according to the 95th percentile in the distribution of values obtained from 1730 individuals (aged 20–39 y) by Pfeiffer et al. (30) in an NHANES study.
Plasma tHcy concentrations >13.9 μmol/L were considered to be high (31). Serum vitamin B-12 concentrations <148 pmol/L were considered to represent vitamin B1-2 deficiency (32). Anemia was defined as a hemoglobin level <120 g/L in women and <130 g/L in men (33).
Dietary intake assessment
Two 24-h dietary recalls were obtained in each period of the study, the first one on the day of blood collection and the second one a few days after blood collection. A randomization schedule for 24-h dietary recall collections was created to allow dietary intake representativeness for every day of the week, including weekend days. Data were entered into the Nutrition Data System for Research software version 2014, developed by the Nutrition Coordinating Center, University of Minnesota. This software uses the USDA food-composition table as its main database, from which 3 estimates are calculated: the folate naturally present in foods, the dietary FA added to fortified foods, and the total dietary folate expressed as dietary folate equivalents (DFEs). The synthetic FA, and consequently DFE, values were corrected to account for differences in the mandatory fortification amounts between Brazil (150 μg FA/100 g flour) and the United States (140 μg FA/100 g flour). The Multiple Source Method (version 1.0.1, v2008–2011; Department of Epidemiology of the German Institute of Human Nutrition Potsdam-Rehbrücke) was used to correct the effect of within-individual variability on data in order to estimate usual dietary intake distributions (deattenuated data) (34).
Statistical analyses
Statistical analyses were carried out by using SPSS version 22.0 (IBM), GraphPad Prism version 5.04 (GraphPad Software, Inc.) and Minitab version 17 software. The chi-square test, the likelihood ratio, or Fisher’s exact tests were used to analyze the frequencies of categorical variables. One-factor repeated-measure ANOVA was used to compare numeric variables at baseline and after the daily intervention with 5 mg FA/d. When we found a significant difference by using ANOVA, Tukey test was performed. When data were not distributed, Box-cox transformation was performed for normalization [all forms of folate, vitamin B-12, tHcy, hemoglobin, white blood cells, reticulocytes, LDH, hs-CRP, serum cytokines, expression of mRNA of 4 genes (DHFR, IFNG, IL8 and TNFA), and number and cytotoxicity capacity of NK cells], before using 1-factor repeated-measure ANOVA. Furthermore, transformed variables were used for the Pearson correlation. Unpaired t test was used to compare FA forms and vitamin B-12 and tHcy concentrations according to sexes at each blood collection time. Means and 95% confidence interval of back-transformed values are presented in Tables 1–4 and Figures 1 and 2.
TABLE 1.
Blood concentrations of vitamins and total homocysteine in 30 healthy individuals at baseline and after the intervention with 5 mg FA/d1
| Baseline | Intervention with 5 mg FA/d
|
P | ||
|---|---|---|---|---|
| 45 d | 90 d | |||
| Serum folate, 2 nmol/L | 17.1 (15.1–19.5)a | 81.7 (71.9–92,9)b | 84.5 (74.4–96.2)b | <0.001 |
| Serum total folate, 3 nmol/L | 22.6 (20.2–25.4)a | 97.1 (86.6–108.9)b | 100.1 (89.2–112.2)b | <0.001 |
| Serum UMFA,3 nmol/L | 0.57 (0.51–0.64)a | 3.86 (2.94–5.28)b | 2.21 (1.79–2.79)b | <0.001 |
| Serum 5-methyl-THF,3 nmol/L | 22.5 (18.9–26.5)a | 75.8 (68.1–83.9)b | 83.8 (76.8–91.0)b | <0.001 |
| Serum THF,3 nmol/L | 0.40 (0.32–0.49)a | 0.94 (0.69–1.22)b | 1.19 (1.02–1.32)b | <0.001 |
| Serum MeFox,3 nmol/L | 0.70 (0.57–0.85)a | 1.67 (1.36–2.04)b | 1.65 (1.42–1.92)b | <0.001 |
| High serum folate, (>45.0 nmol/L), n (%) | ||||
| Microbiologic assay | 1 (3.3)a | 28 (93.3)b | 28 (93.3)b | <0.0014 |
| HPLC/MS-MS | 2 (6.6)a | 30 (100)b | 30 (100)b | <0.0014 |
| High serum UMFA,3 (> 1.12 nmol/L) | 2 (6.6)a | 29 (96.6)b | 26 (86.7)b | <0.0015 |
| Serum vitamin B12,2 pmol/L | 376 (334–421) | 364 (327–403) | 387 (342–434) | 0.332 |
| Plasma total homocysteine,6 μmol/L | 8.4 (7.6–9.3) | 8.1 (7.4–8.9) | 8.0 (7.2–8.8) | 0.394 |
Values are means and 95% CIs of back-transformed values unless otherwise indicated. Serum 5,10-methenyl-THF and 5-formyl-THF were below the limit of detection (0.2 nmol/L). Numeric variables were transformed by Box-Cox, and the data are presented after reconversion.
One-factor repeated-measures ANOVA was used; when significant, Tukey’s test was performed. Labeled means in a row without a common superscript letter differ, P < 0.05. FA, folic acid; HPLC-MS/MS, HPLC–tandem MS; MeFox, oxidation product of 5-methyl-THF; THF, tetrahydrofolate; UMFA, unmetabolized folic acid.
Derived by using a microbiological assay.
Derived by using HPLC-MS/MS.
Derived by using likelihood ratios.
Derived by using chi-square.
Derived by using chemiluminescence.
TABLE 4.
Linear regression models for cytotoxicity capacity of NK cells (dependent variable)1
| Independent variables | Unstandardized Coefficients | Partial R2 | P | ||
|---|---|---|---|---|---|
| β | SE | ||||
| Univariate Models | |||||
| 1 | Intervention with 5 mg FA/d | −0.399 | 0.141 | – | 0.006 |
| 2 | Serum total folate2 | −0.006 | 0.002 | – | 0.001 |
| 3 | Serum Folate3 | −0.007 | 0.002 | – | 0.002 |
| 4 | Serum UMFA | −0.005 | 0.002 | – | 0.040 |
| 5 | Serum 5-methyl-THF | −0.012 | 0.004 | – | 0.001 |
| 6 | Serum THF | −0.544 | 0.208 | – | 0.011 |
| 7 | Serum Mefox | −0.032 | 0.115 | – | 0.782 |
| 8 | Serum vitamin B-12 | −0.001 | 0.001 | – | 0.583 |
| 9 | Plasma total homocysteine | 0.093 | 0.053 | – | 0.082 |
| 10 | LDH | −0.001 | 0.002 | – | 0.572 |
| 11 | hs-CRP | −0.376 | 0.310 | – | 0.230 |
| 12 | Serum IL-6 | 0.677 | 0.174 | – | <0.001 |
| 13 | Serum IL-8 | 0.026 | 0.048 | – | 0.592 |
| 14 | Serum IL-10 | 0.095 | 0.049 | – | 0.057 |
| 15 | Serum IFN-γ | 0.060 | 0.021 | – | 0.006 |
| 16 | Serum TNF-α | −0.154 | 0.052 | – | 0.004 |
| 17 | DHFR del19bp | 0.102 | 0.176 | – | 0.565 |
| 18 | Expression of mRNA of DHFR | −2.738 | 6.245 | – | 0.662 |
| 19 | Expression of mRNA of IFNG | −13.728 | 14.796 | – | 0.356 |
| 20 | Expression of mRNA IL8 | 0.008 | 0.043 | – | 0.847 |
| 21 | Expression of mRNA of TNFA | −0.234 | 0.372 | – | 0.530 |
| 22 | BMI | 0.051 | 0.039 | – | 0.194 |
| Multivariate models | |||||
| 23 | Serum 5-methyl-THF | −0.011 | 0.003 | 0.092 | 0.001 |
| Serum IL-6 | 0.759 | 0.224 | 0.083 | 0.001 | |
| Serum IFN-γ | 0.053 | 0.025 | 0.032 | 0.039 | |
| Serum TNF-α | −0.198 | 0.046 | 0.137 | <0.001 | |
The dependent variable was the log of cytotoxic capacity of NK cells. DHFR, dihydrofolate reductase; FA, folic acid; hs-CRP, highsensitivity C-reactive protein; IFNG, interferon-γ; LDH, lactate dehydrogenase; MeFox, oxidation product of 5-methyl-THF; THF, tetrahydrofolate; TNFA, tumor necrosis factor-α; UMFA, unmetabolized folic acid.
Derived by using HPLC–tandem MS.
Derived by using a microbiological assay.
Multivariate linear regression (model 23): The independent variables included were those with P < 0.05 in univariate model. The variables that showed strong correlations with 5-methyl-THF were excluded from the model (intervention, serum folate, and serum total folate).
Critical value of Bonferroni correction: P = 0.0125.
FIGURE 1.
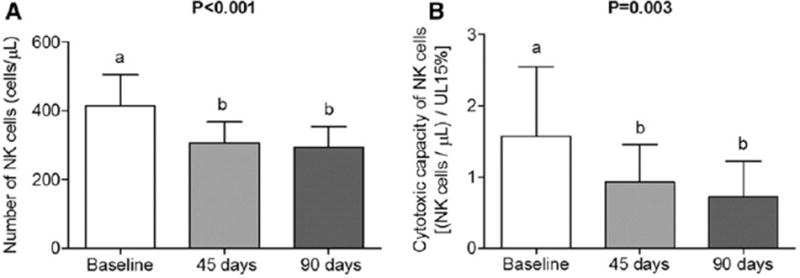
Number (A) and cytotoxic capacity (B) of NK cells in healthy individuals at baseline and at 45 and 90 d postintervention with 5 mg FA/d; n = 29 and n = 27, respectively. Values are means and 95% CIs of reconverted data by using Box-Cox transformation. One-factor repeated-measures ANOVA was used; when significant, Tukey’s test was performed. Bars with different lowercase letters indicate significant differences, P < 0.05. Statistical power of ANOVA for number (A) and cytotoxicity capacity (B) of NK cells: 0.859 and 0.961, respectively. FA, folic acid; UL 15%, number of effector cells needed to lyse 15% of target cells.
FIGURE 2.
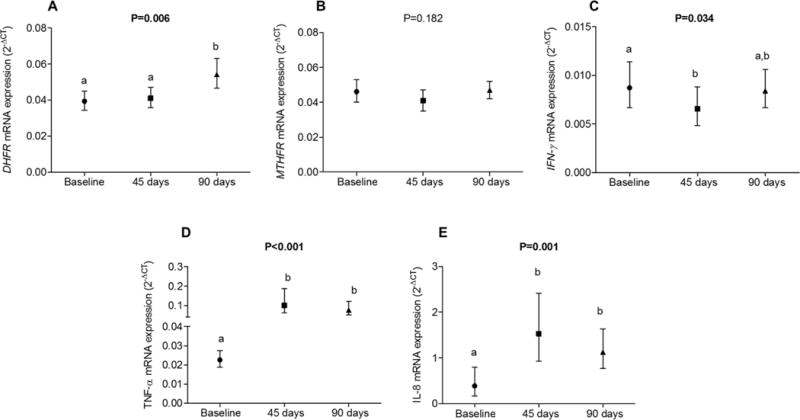
Expression of DHFR (A), MTHFR (B), IFNG (C), TNFA (D), and IL8 (E) mRNA in 29 healthy individuals at baseline and at 45 and 90 d postintervention with 5 mg FA/d. Values are means and 95% CIs and were transformed by Box-Cox and are presented after reconversion. One-factor ANOVA with repeated measures was used; when significant, Tukey’s test was performed. Columns with different lowercase letters indicate significant differences, P < 0.05. DHFR, dihydrofolate reductase; FA, folic acid; IFNG, interferon γ; MTHFR, methylenetetrahydrofolate reductase; TNFA, tumor necrosis factor α.
Twenty-two univariate linear regression models were conducted for each dependent variable: log numbers of NK cells and log cytotoxic capacity of NK cells. One multiple linear regression model was performed for each dependent variable cited above. Only variables that had significant P values in univariate linear regression were included as independent variable in multiple linear regression mode. There were strong Pearson correlations between intervention with 5 mg FA/d, serum folate, serum total folate, THF, UMFA and 5-methyl-THF. Because of this, only 5-methyl-THF was included together with other variables in multiple linear regression models. The Bonferroni correction is shown in the legends for Tables 3 and 4. The level of significance was set at P <0.05.
TABLE 3.
Linear regression models for number of NK cells (dependent variable)1
| Independent variables | Unstandardized coefficients | Partial R2 | P | ||
|---|---|---|---|---|---|
| β | SE | ||||
| Univariate Models | |||||
| 1 | Intervention with 5mg FA/d | −0.178 | 0.053 | – | 0.001 |
| 2 | Serum total folate2 | −0.002 | 0.001 | – | 0.013 |
| 3 | Serum Folate3 | −0.003 | 0.001 | – | 0.006 |
| 4 | Serum UMFA | −0.001 | 0.001 | – | 0.320 |
| 5 | Serum 5-methyl-THF | −0.005 | 0.001 | <0.001 | |
| 6 | Serum THF | −0.158 | 0.083 | – | 0.062 |
| 7 | Serum Mefox | −0.011 | 0.044 | – | 0.802 |
| 8 | Serum vitamin B-12 | −0.001 | 0.001 | – | 0.032 |
| 9 | Plasma total homocysteine | 0.019 | 0.021 | – | 0.379 |
| 10 | LDH | 0.000 | 0.001 | – | 0.712 |
| 11 | hs-CRP | 0.028 | 0.120 | – | 0.818 |
| 12 | Serum IL-6 | 0.217 | 0.069 | – | 0.002 |
| 13 | Serum IL-8 | 0.002 | 0.018 | – | 0.930 |
| 14 | Serum IL-10 | 0.010 | 0.019 | – | 0.616 |
| 15 | Serum IFN-γ | 0.023 | 0.008 | – | 0.006 |
| 16 | Serum TNF-α | −0.058 | 0.020 | – | 0.005 |
| 17 | DHFR del19 bp | 0.123 | 0.066 | – | 0.068 |
| 18 | Expression of mRNA of DHFR | −0.436 | 2.426 | – | 0.858 |
| 19 | Expression of mRNA of IFNG | −9.827 | 5.675 | – | 0.087 |
| 20 | Expression of mRNA IL8 | −0.004 | 0.017 | – | 0.804 |
| 21 | Expression of mRNA of TNFA | −0.171 | 0.143 | – | 0.237 |
| 22 | BMI | 0.018 | 0.017 | – | 0.291 |
| Multivariate models | |||||
| 234 | Serum 5-methyl-THF | −0.005 | 0.001 | 0.165 | <0.001 |
| Serum vitamin B-12 | −0.001 | 0.000 | 0.028 | 0.134 | |
| Serum IL-6 | 0.151 | 0.092 | 0.033 | 0.104 | |
| Serum IFN-γ | 0.029 | 0.010 | 0.092 | 0.006 | |
| Serum TNF-α | −0.065 | 0.019 | 0.131 | 0.001 | |
The dependent variable was the log of number of NK cells. DHFR, dihydrofolate reductase; FA, folic acid; hs-CRP, high-sensitivity C-reactive protein; IFNG, interferon γ; LDH, lactate dehydrogenase; MeFox, oxidation product of 5-methyl-THF; THF, tetrahydrofolate; TNFA, tumor necrosis factor α; UMFA, unmetabolized folic acid.
Derived by using HPLC–tandem MS.
Derived by using a microbiological assay.
Multivariate linear regression (model 23): The independent variables included were those with P < 0.05 in univariate model. The variables that showed strong correlations with 5-methyl-THF were excluded from the model (intervention, serum folate, and serum total folate). Critical value of Bonferroni correction: P = 0.010.
RESULTS
The geometric mean age for the study participants was 27.7 y (95% CI: 26.4, 29.1 y), and all of participants reported being nonsmokers. The geometric mean BMI was 23.1 kg/m2 (95% CI: 22.0, 24.3). Only 1 woman and 6 men (23%) were overweight, whereas 1 man (3.3%) was classified as obese. No participant was underweight.
Natural folate intake was higher at baseline than at T45 and T90 (P <0.001), and FA intake from fortified foods was similar when comparing baseline with T45 and T90 (P >0.05). However, total food folate intake, expressed as DFEs, did not differ significantly between the study periods (P =0.103).
Serum total folate concentrations of samples measured by microbiologic assay correlated significantly with concentrations measured by HPLC-MS/MS (Pearson correlation: r= 0.987, P <0.001, n=90). On average, serum folate concentrations obtained by HPLC-MS/MS were higher than those obtained by microbiologic assay (32% at baseline and 19% at T45 and T90), as showed in Table 1.
Serum folate (both assays), UMFA, 5-methyl-THF, THF, and MeFox concentrations increased significantly after 45 and 90 d of the FA intervention compared with baseline (Table 1). At baseline, UMFA contributed 2.6% to the concentration of serum total folate (HPLC-MS/MS), however, after the intervention, the UMFA contribution increased to 7.3% and 3.5% at T45 and T90, respectively. The contribution of 5-methyl-THF to serum total folate (HPLC-MS/MS) decreased from 95.1% at baseline to 76.6% and 82.7% at T45 and T90, respectively (Table 1). The 2 minor folate forms, serum 5-formyl-THF and 5,10-methenyl-THF, were below the limit of detection at baseline and during post-intervention in most participants.
Serum folate (both microbiologic and HPLC-MS/MS methods) and 5-methyl-THF concentrations were lower in men than in women at baseline, T45 and T90 (P < 0.050). No difference was found between men and women for UMFA, MeFox and vitamin B-12 concentrations (P > 0.050). tHcy concentrations were higher in men at all blood collection times (P < 0.050).
Concentrations of serum folate >45 nmol/L were observed in 28 (93.3%) and 30 (100%) participants during the intervention period (both at T45 and T90) with the microbiologic and HPLC-MS/MS assay, respectively. UMFA concentrations increased (>1.12 nmol/L) in 29 (96.6%) participants at T45 and in 26 (86.7%) participants at T90 (Table 1). Moreover, at the end of the intervention study, 15 (50.0%) participants had UMFA concentrations between 1.12 and 1.83 nmol/L, 6 (20%) had concentrations between 2.10 and 8.68 nmol/L, and 5 (16.6%) had concentrations between 49.5 and 278 nmol/L.
Folate deficiency (serum folate <7 nmolL) was found in 4 (13.3%) participants at baseline, but not after the intervention period, on the bases of data from the microbiologic assay. On the bases of HPLC-MS/MS, none of the participants presented with folate deficiency at either time point.
We found no differences across time points for vitamin B-12 or tHcy concentrations (Table 1). No serum vitamin B-12 deficiency was found. Although only one participant (3.3%) had values above the tHcy cutoff at baseline (15.4 μmol/L); after 45 and 90 d of intervention tHcy concentrations were reduced to 14.0 and 12.2 μmol/L, respectively.
We observed no significant differences between baseline and the intervention for white blood cells and reticulocytes or concentrations of hemoglobin and serum cytokines (Table 2). LDH activity was higher at T90, whereas hs-CRP concentrations showed reduced values at T45 when compared with baseline values (Table 2).
TABLE 2.
Hematologic and biochemical variables in 30 healthy individuals at baseline and after the intervention with 5 mg FA/d1
| Baseline | Intervention with 5 mg FA/d
|
P | ||
|---|---|---|---|---|
| 45 d | 90 d | |||
| Hemoglobin, g/L | 141 (136–146) | 141 (136–145) | 143 (139–147) | 0.282 |
| Anemia, n (%) | 2 (6.7) | 0 | 0 | |
| WBCs × 109/L | 6.15 (5.51–6.79) | 5.86 (5.13–6.58) | 6.03 (5.19–6.89) | 0.203 |
| Reticulocyes × 109/L | 41.3 (37.8–45.4) | 36.8 (34.0–40.0) | 39.0 (35.9–42.7) | 0.344 |
| LDH, U/L | 374 (352–396)a | 385 (360–411)a.b | 407 (386–430)b | 0.014 |
| hs-CRP, mg/dL | 0.27 (0.23–0.25)a | 0.24 (0.21–0.23)b | 0.29 (0.25–0.27)a.b | 0.006 |
| IL-6, pg/mL | 0.67 (0.49–0.87) | 0.80 (0.57–1.06) | 0.70 (0.50–0.94) | 0.558 |
| IL-8, pg/mL | 3.82 (2.96–4.83) | 4.31 (3.44–5.36) | 3.97 (3.28–4.77) | 0.609 |
| IL-10, pg/mL | 3.35 (2.56–4.32) | 3.03 (2.40–3.79) | 3.17 (2.37–4.19) | 0.797 |
| IFN-γ, pg/mL | 4.49 (3.12–6.12) | 5.57 (3.80–7.69) | 5.51 (3.93–7.35) | 0.237 |
| TNF-α, pg/mL | 3.17 (2.63–3.83) | 3.23 (2.64–3.96) | 3.45 (2.70–4.40) | 0.170 |
Values are means and 95% CIs of back-transformed values unless otherwise indicated. Numeric variables were transformed by Box-Cox, and the data are presented after reconversion. One-factor repeated-measures ANOVA was used; when significant, Tukey’s test was performed. Labeled means in a row without a common superscript letter differ, P < 0.05. FA, folic acid; hs-CRP, high-sensitivity C-reactive protein; LDH, lactate dehydrogenase; WBC, white blood cell.
Intervention with FA for 45 and 90 d significantly reduced the absolute NK cell count and the cytotoxicity capacity of these cells (Figure 1). The statistical powers of these tests were 0.859 and 0.961, respectively.
We observed higher DHFR mRNA expression at T90 than at baseline and T45. We also observed higher TNFA and IL8 mRNA expression at T45 and T90 than at baseline. On the other hand, IFNG mRNA expressions was lower at T45 than at baseline, whereas no significant differences were observed for MTHFR mRNA expressions with FA intervention (Figure 2).
With regard to the 19-bp deletion on DHFR polymorphism, 6 participants were homozygoous for the 19-bp deletion, 16 participants were heterozygous, and 6 had the wild-type genotype. DHFR mRNA expression was similar among the 3 genotypes for the DHFR 19-bp deletion.
After Bonferroni correction in multivariate linear regression models, only serum 5-methyl-THF and TNF-α were inversely associated, whereas serum IFN-γ was positively associated with the log of NK cell number (Table 3). Furthermore, serum 5-methyl-THF and TNF-α were inversely associated, whereas serum IL-6 was positively associated with the log of cytotoxicity capacity of NK cells (Table 4).
DISCUSSION
This noncontrolled intervention study showed how a small group of young, healthy adults responded to a 3-mo high-dose FA supplement regimen, namely with increased concentrations of serum UMFA and reduced number and cytotoxicity of NK cells. Our study adds to the small number of studies previously reported on this topic (13, 14).
We used 2 methods to measure serum folate, and the results of the 2 methods showed strong correlations. However, folate concentrations by HPLC/MS-MS were 30% higher at baseline and 19% higher at 45 and 90 d than were folate concentrations by microbiological assay. This difference is larger than the 610% difference between the 2 assays reported previously by Fazili et al. (35) who used Lactobacillus rhamnosus as the micro-organism for their microbiological assay. We used the L. casei strain as published by O’Broin and Kelleher (20) (chloramphenicol-resistant strain NCIB 10463). Both micro-organisms should grow in the presence of multiple forms of folate, detecting all biologically active folate species equally, while excluding those without vitamin activity (36). However, the microbiological assay has not yet been standardized, and different results have been reported from different laboratories (37).
As expected, the intervention with 5 mg FA/d, even for just a short time (45 d), produced a several fold increase in serum folate concentrations. The 5-methyl-THF form was the main contributor to serum folate concentrations, increasing at the same rate as serum folate after the intervention. Detectable concentrations of serum UMFA were present in all of the participants at baseline (geometric mean: 0.59 nmol/L; 95% CI: 0.52, 0.68 nmol/L). In a previous cross-sectional study, carried out in 144 healthy Brazilian non–supplement users exposed to mandatory wheat and maize flour fortification with FA, it was observed that dietary FA was associated with UMFA concentrations (geometric mean: 0.55 nmol/L; 95% CI: 0.50, 0.61 nmol/L) (38).
The UMFA concentrations in this study were similar to those found in the cross-sectional 2007–2008 NHANES (geometric mean: 0.64 nmol/L; 95% CI: 0.51, 0.87 nmol/L) performed in the US population ~ 10 y after the introduction of mandatory food fortification (39). Not surprisingly, after the intervention with 5 mg FA/d, the majority of participants in our study showed increased UMFA concentrations, with some >50 nmol/L. Notably, total food folate and dietary FA intakes in our study were similar at baseline, T45, and T90, which confirms that the increase in UMFA at T45 and T90 was the result of the daily use of a supplement tablet with 5 mg FA.
Men showed lower serum folate and 5-methyl-THF concentrations and higher tHcy concentrations than did women at baseline and after the intervention. By using data from the NHANES, Pfeiffer et al. (39) also reported lower serum folate concentrations in men than in women [geometric mean (95% CI): 41.5 nmol/L (39.8, 43.2 nmol/L) and 45.4 nmol/L (43.7, 47.2 nmol/L), respectively], but the observed concentrations were lower in our small study [12.2 nmol/L (9.2, 16.0 nmol/L) and 24.1 nmol/L (18.7, 31.1 nmol/L) for men and women, respectively].
Whether circulating UMFA at low or high concentrations has any health effects in general, or particularly in patients who use high doses of FA for therapeutic purposes over extended periods of time, is unknown. Animal models have shown that a high-FA diet can result in reduced NK cell cytotoxicity in aged mice (40). Likewise, mice that were supplemented with high amounts of FA before being infected with malaria (Plasmodium berghei) exhibited lower numbers of specific T and NK cell subpopulations than did mice that were infected but that were fed a normal diet (41). We observed a reduced number of NK cells and decreased cytotoxicity in healthy young participants who consumed 5 mg FA/d for 45 and 90 d. Our data corroborate previous findings by Troen et al. (13) that a high FA intake from supplementation was associated with reduced cytotoxicity of NK cells in vivo in obese postmenopausal women who consumed the greatest amount of folate from their diet. However, in the present study, BMI was not associated with cytotoxicity of NK cells. The assessment of NK cell activity could be an important measure of innate immune function of these cells in some diseases (24), especially in cancer, where several studies have shown an inverse relation between NK activity and the risk of cancer (42–45).
The mechanism by which high concentrations of FA may impair the activity of NK cells remains unclear, and this may only occur in vivo, because in vitro NK cell activity was not modified by concentrations of FA and 5-methyl-THF in cell culture medium (14). We hypothesize that folate receptor 4 (FR4), present in regulatory T (Treg) cells, may be involved in this mechanism. FR4, a subtype of folate receptor, is highly expressed on the surface of Treg cells as a specific marker, distinguishing them from other native or activated T cells (46–48). In turn, Treg cells were shown to be able to profoundly inhibit NK cell functions in animal models, suggesting that Treg cells may play a major role in NK cell regulation (49, 50). However, more studies are needed to confirm this regulation and to deepen our understanding on how this mechanism works.
NK cells are main producers of inflammatory cytokines, such as IFN-γ and TNF-α, in many physiologic and pathologic conditions. They also produce a variety of immunosuppressive cytokines (e.g., IL-10), as well as growth factors (51, 52). An increase in TNF- α was observed in mice infected with malaria when they were fed a diet rich in FA but not when they were fed a normal diet (41). We did not find significant differences in serum concentrations of IL-6, IL-8, IL-10, IFN-γ, and TNF- α comparing pre- and postintervention periods, possibly because of the short time that participants were exposed to the high-dose FA supplement. However, in multiple linear regression, serum 5-methyl-THF and serum TNF- α were inversely associated, whereas serum IFN-γ was positively associated, with NK cell number. Interestingly, serum 5-methyl-THF and serum TNF-α were also inversely associated, whereas serum IL-6 was positively associated, with the cytotoxic capacity of NK cells. Furthermore, the significant increases we observed in TNFA and IL8 mRNA expression after FA supplementation further indicate a connection between higher FA concentrations and innate immunity. A longer intervention period may possibly lead to alterations in cytokine concentrations because of the increased mRNA expression we observed.
The considerable increase observed in UMFA concentrations seems to stimulate, at least at the transcription level, the production of DHFR, as observed in increased DHFR mRNA expression after 90 d of 5-mg FA/d supplementation. However, after the reduction in FA to an active form of folate, MTHFR mRNA expression was not affected. In contrast to Xu et al. (53), we did not observe any association between the presence of genotypes for 19-bp deletion in DHFR and DHFR mRNA expression.
With regard to the absence of modifications observed in vitamin B-12 and tHcy concentrations after the intervention period, it is important to highlight that both vitamin B-12 and tHcy concentrations were normal in most of our participants. Thus, it is to be expected that especially tHcy concentrations would not be further lowered by additional folate intake. One participant who showed increased tHcy concentrations at baseline showed normal concentrations after 90 d of intervention with FA. Neither vitamin B-12 nor tHcy showed any association with NK cell variables or with serum concentrations of cytokines. The slight increase in LDH activity after 90 d (P = 0.014) and a slight reduction in hs-CRP concentrations after 45 d of FA use (P = 0.006) indicate reduced inflammation and tissue damage; however, the health relevance of these modest changes is not known.
Limitations of our study include the relatively small number of individuals, the high interindividual variability in the cytotoxicity test, and the limited intervention period. Although this study represents a small convenience sample, it is important because the participants are healthy young adults. Because of the rather short intervention period, our study should be considered an exploratory laboratory study that shows how humans respond to high dosages of FA, rather than equating our findings with health outcomes. Findings could be different for patients with severe hereditary anemia, who take high FA doses for prolonged periods, sometimes during their entire life, to compensate for the higher erythropoiesis rate that results in an increased folate requirement (54, 55). Other studies with a larger number of participants are needed to confirm our findings, especially in patients who use high-FA doses for a prolonged period.
Acknowledgments
The authors responsibilities were as follows—CP and EMG-S: designed the research and had primary responsibility for the final content; CP, JFB, MRL, EDC, CZP, and PMdSA: conducted the research; CP, GWG, CMP, ZF, MSF, and EMG-S: analyzed the data; CMP and ZF: conducted the analysis of UMFA; CP, CMP, ZF, RG, and EMG-S: wrote the manuscript; and all authors: read and approved the final manuscript.
Sources of financial supports: this study was financially supported by Fundação de Amparo à Pesquisa do Estado de São Paulo (FAPESP 2012/12912-1) and Conselho Nacional de Desenvolvimento Científico e Tecnológico (CNPq 4826412012-6 and 401586/2014-6), Brazil. JFB, EC, MSF and EMGS had fellowships of CNPq, and MRL had a fellowship of CAPES. CZP had fellowships of FAPESP.
List of abbreviations
- BMI
body mass index
- c-DNA
complementary deoxyribonucleic acid
- DFE
dietary folate equivalents
- DHF
dihydrofolate
- DHFR
dihydrofolate reductase
- DNA
deoxyribonucleic acid
- FA
folic acid
- Hs-CRP
high-sensitivity C-reactive protein
- IFN
interferon
- IL
interleukin
- LDH
lactate dehydrogenase
- MeFox
oxidation product of 5-methyl-tetrahydrofolate
- mRNA
messenger ribonucleic acid
- MTHFR
methylenetetrahydrofolate reductase
- NK
natural killer
- RNA
ribonucleic acid
- tHcy
total homocysteine
- THF
tetrahydrofolate
- UMFA
unmetabolized folic acid
Footnotes
The findings and conclusions in this report are those of the author(s) and do not necessarily represent the official position of the Centers for Disease Control and Prevention.
Potential conflicts of interest: The authors have no conflicts of interest to declare.
References
- 1.Eichholzer M, Tönz O, Zimmermann R. Folic acid: a public-health challenge. Lancet. 2006;367:1352–61. doi: 10.1016/S0140-6736(06)68582-6. [DOI] [PubMed] [Google Scholar]
- 2.Ulrich CM, Potter JD. Folate supplementation: too much of a good thing? Cancer Epidemiol Biomarkers Prev. 2006;15:189–93. doi: 10.1158/1055-9965.EPI-152CO. [DOI] [PubMed] [Google Scholar]
- 3.World Health Organization. Guideline: Optimal Serum and Red Blood Cell Folate Concentrations in Women of Reproductive Age for Prevention of Neural Tube Defects. Geneva: WHO; 2015. [PubMed] [Google Scholar]
- 4.Wani NA, Hamid A, Kaur J. Folate status in various pathophysiological conditions. IUBMB Life. 2008;60:834–42. doi: 10.1002/iub.133. [DOI] [PubMed] [Google Scholar]
- 5.Bailey LB, Stover PJ, McNulty H, Fenech MF, Gregory JF, Mills JL, Pfeiffer CM, Fazili Z, Zhang M, Ueland PM, et al. Biomarkers of Nutrition for Development-Folate Review. J Nutr. 2015;145:1636S–80S. doi: 10.3945/jn.114.206599. [DOI] [PMC free article] [PubMed] [Google Scholar]
- 6.Brazil Prenatal and puerperal Humanized and qualified care Technical manual Department of Strategic Programmatic Actions. Brasília: Ministry of Health from Brazil; 2006. Portuguese. [Google Scholar]
- 7.Institute of Medicine. Folate, Dietary Reference Intakes for Thiamin, Riboflavin, Niacin, Vitamin B6, Folate, Vitamin B12, Pantothenic Acid, Biotin, and Choline. Washington, DC: National Academy Press; 1998. pp. 196–305. [PubMed] [Google Scholar]
- 8.Smith AD, Kim YI, Refsum H. Is folic acid good for everyone? Am J Clin Nutr. 2008;87:517–33. doi: 10.1093/ajcn/87.3.517. [DOI] [PubMed] [Google Scholar]
- 9.Kelly P, McPartlin J, Goggins M, Weir DG, Scott JM. Unmetabolized folic acid in serum: acute studies in subjects consuming fortified food and supplements. Am J Clin Nutr. 1997;65:1790–5. doi: 10.1093/ajcn/65.6.1790. [DOI] [PubMed] [Google Scholar]
- 10.Sweeney MR, McPartlin J, Weir DG, Daly L, Scott JM. Postprandial serum folic acid response to multiple doses of folic acid in fortified bread. Br J Nutr. 2006;95:145–51. doi: 10.1079/bjn20051618. [DOI] [PubMed] [Google Scholar]
- 11.Morris MS, Jacques PF, Rosenberg IH, Selhub J. Circulating unmetabolized folic acid and 5-methyltetrahydrofolate in relation to anemia, macrocytosis, and cognitive test performance in American seniors. Am J Clin Nutr. 2010;91:1733–44. doi: 10.3945/ajcn.2009.28671. [DOI] [PubMed] [Google Scholar]
- 12.Boyles AL, Yetley EA, Thayer KA, Coates PM. Safe use of high intakes of folic acid: research challenges and paths forward. Nutr Rev. 2016;74:469–74. doi: 10.1093/nutrit/nuw015. [DOI] [PMC free article] [PubMed] [Google Scholar]
- 13.Troen AM, Mitchell B, Sorensen B, Wener MH, Johnston A, Wood B, Selhub J, McTiernan A, Yasui Y, Oral E, et al. Unmetabolized folic acid in plasma is associated with reduced natural killer cell cytotoxicity among postmenopausal women. J Nutr. 2006;136:189–94. doi: 10.1093/jn/136.1.189. [DOI] [PubMed] [Google Scholar]
- 14.Hirsch S, Miranda D, Muñoz E, Montoya M, Ronco AM, de la Maza MP, Bunout D. Natural killer cell cytotoxicity is not regulated by folic acid in vitro. Nutrition. 2013;29:772–6. doi: 10.1016/j.nut.2012.10.006. [DOI] [PubMed] [Google Scholar]
- 15.Pittari G, Filippini P, Gentilcore G, Grivel JC, Rutella S. Revving up Natural Killer Cells and Cytokine-Induced Killer Cells Against Hematological Malignancies. Front Immunol. 2015;6:230. doi: 10.3389/fimmu.2015.00230. [DOI] [PMC free article] [PubMed] [Google Scholar]
- 16.Vivier E, Tomasello E, Baratin M, Walzer T, Ugolini S. Functions of natural killer cells. Nat Immunol. 2008;9:503–10. doi: 10.1038/ni1582. [DOI] [PubMed] [Google Scholar]
- 17.Fauriat C, Long EO, Ljunggren HG, Bryceson YT. Regulation of human NK-cell cytokine and chemokine production by target cell recognition. Blood. 2010;115:2167–76. doi: 10.1182/blood-2009-08-238469. [DOI] [PMC free article] [PubMed] [Google Scholar]
- 18.Araki R, Maruyama C, Igarashi S, Yoshida M, Maruyama T, Satoh T, Yoshida M, Umegaki K. Effects of short-term folic acid and/or riboflavin supplementation on serum folate and plasma total homocysteine concentrations in young Japanese male subjects. Eur J Clin Nutr. 2006;60:573–9. doi: 10.1038/sj.ejcn.1602351. [DOI] [PubMed] [Google Scholar]
- 19.Van Oort FV, Melse-Boonstra A, Brouwer IA, Clarke R, West CE, Katan MB, Verhoef P. Folic acid and reduction of plasma homocysteine concentrations in older adults: a dose-response study. Am J Clin Nutr. 2003;77:1318–23. doi: 10.1093/ajcn/77.5.1318. [DOI] [PubMed] [Google Scholar]
- 20.O’Broin S, Kelleher B. Microbiological assay on microtitre plates of folate in serum and red cells. J Clin Pathol. 1992;45:344–7. doi: 10.1136/jcp.45.4.344. [DOI] [PMC free article] [PubMed] [Google Scholar]
- 21.Fazili Z, Whitehead RD, Paladugula N, Pfeiffer CM. A high-throughput LC-MS/MS method suitable for population biomonitoring measures five serum folate vitamers and one oxidation product. Anal Bioanal Chem. 2013;405:4549–60. doi: 10.1007/s00216-013-6854-9. [DOI] [PMC free article] [PubMed] [Google Scholar]
- 22.Kelleher BP, Walshe KG, Scott JM, O’Broin SD. Microbiological assay for vitamin B12 with use of a colistin-sulfate-resistant organism. Clin Chem. 1987;33:52–4. [PubMed] [Google Scholar]
- 23.Kelleher BP, Broin SD. Microbiological assay for vitamin B12 performed in 96-well microtitre plates. J Clin Pathol. 1991;44:592–5. doi: 10.1136/jcp.44.7.592. [DOI] [PMC free article] [PubMed] [Google Scholar]
- 24.Valiathan R, Lewis JE, Melillo AB, Leonard S, Ali KH, Asthana D. Evaluation of a flow cytometry-based assay for natural killer cell activity in clinical settings. Scand J Immunol. 2012;75:455–62. doi: 10.1111/j.1365-3083.2011.02667.x. [DOI] [PubMed] [Google Scholar]
- 25.Dutta S, Shaw J, Chatterjee A, Sarkar K, Usha R, Sinha S, Mukhopadhyay K. Importance of gene variants and co-factors of folate metabolic pathway in the etiology of idiopathic intellectual disability. Nutr Neurosci. 2011;14:202–9. doi: 10.1179/1476830511Y.0000000016. [DOI] [PubMed] [Google Scholar]
- 26.Vandesompele J, De Preter K, Pattyn F, Poppe B, Van Roy N, De Paepe A, Speleman F. Accurate normalization of real-time quantitative RT-PCR data by geometric averaging of multiple internal control genes. Genome Biol. 2002;3 doi: 10.1186/gb-2002-3-7-research0034. Research0034. [DOI] [PMC free article] [PubMed] [Google Scholar]
- 27.Livak KJ, Schmittgen TD. Analysis of relative gene expression data using real-time quantitative PCR and the 2(-Delta Delta C(T)) Method. Methods. 2001;25:402–8. doi: 10.1006/meth.2001.1262. [DOI] [PubMed] [Google Scholar]
- 28.World Health Organization. Report of a WHO Expert Committee. Geneva: WHO; 1995. Physical status: the use and interpretation of anthropometry. (WHO Technical Report Series 854). [PubMed] [Google Scholar]
- 29.World Health Organization. Vitamin and Mineral Nutrition Information System. Geneva: WHO; 2012. Serum and red blood cell folate concentrations for assessing folate status in populations. [Google Scholar]
- 30.Pfeiffer CM, Sternberg MR, Fazili Z, Lacher DA, Zhang M, Johnson CL, Hamner HC, Bailey RL, Rader JI, Yamini S, et al. Folate status and concentrations of serum folate forms in the US population: National Health and Nutrition Examination Survey 2011-2. Br J Nutr. 2015;113:1965–77. doi: 10.1017/S0007114515001142. [DOI] [PMC free article] [PubMed] [Google Scholar]
- 31.Guerra-Shinohara EM, Morita OE, Pagliusi RA, Blaia-d’Avila VL, Allen RH, Stabler SP. Elevated serum S-adenosylhomocysteine in cobalamin-deficient megaloblastic anemia. Metabolism. 2007;56:339–47. doi: 10.1016/j.metabol.2006.10.009. [DOI] [PMC free article] [PubMed] [Google Scholar]
- 32.Gibson RS. Principles of nutritional assessment. New York: University Press; 1990. p. 621. [Google Scholar]
- 33.World Health Organization. Report of a WHO scientific group. Geneva: World Health Organ Tech Rep Ser; 1968. Nutritional anaemias; pp. 5–37p. [PubMed] [Google Scholar]
- 34.Harttig U, Haubrock J, Knüppel S, Boeing H, Consortium E The MSM program: web-based statistics package for estimating usual dietary intake using the Multiple Source Method. Eur J Clin Nutr. 2011;65(Suppl 1):S87–91. doi: 10.1038/ejcn.2011.92. [DOI] [PubMed] [Google Scholar]
- 35.Fazili Z, Pfeiffer CM, Zhang M. Comparison of serum folate species analyzed by LC-MS/MS with total folate measured by microbiologic assay and Bio-Rad radioassay. Clin Chem. 2007;53:781–4. doi: 10.1373/clinchem.2006.078451. [DOI] [PubMed] [Google Scholar]
- 36.Yetley EA, Pfeiffer CM, Phinney KW, Bailey RL, Blackmore S, Bock JL, Brody LC, Carmel R, Curtin LR, Durazo-Arvizo RA, et al. Biomarkers of vitamin B-12 status in NHANES: a roundtable summary. Am J Clin Nutr. 2011;94:313S–21S. doi: 10.3945/ajcn.111.013243. [DOI] [PMC free article] [PubMed] [Google Scholar]
- 37.Pfeiffer CM, Zhang M, Lacher DA, Molloy AM, Tamura T, Yetley EA, Picciano MF, Johnson CL. Comparison of serum and red blood cell folate microbiologic assays for national population surveys. J Nutr. 2011;141:1402–9. doi: 10.3945/jn.111.141515. [DOI] [PMC free article] [PubMed] [Google Scholar]
- 38.Palchetti CZ, Paniz C, Carli E, Marchioni DM, Colli C, Steluti J, Pfeiffer CM, Fazili Z, Guerra-Shinohara EM. Association between serum unmetabolized folic acid concentrations and folic acid from fortified foods. J Am Coll Nutr. doi: 10.1080/07315724.2017.1333929. In press. [DOI] [PMC free article] [PubMed] [Google Scholar]
- 39.Pfeiffer CM, Sternberg MR, Fazili Z, Yetley EA, Lacher DA, Bailey RL, Johnson CL. Unmetabolized folic acid is detected in nearly all serum samples from US children, adolescents, and adults. J Nutr. 2015;145:520–31. doi: 10.3945/jn.114.201210. [DOI] [PMC free article] [PubMed] [Google Scholar]
- 40.Sawaengsri H, Wang J, Reginaldo C, Steluti J, Wu D, Meydani SN, Selhub J, Paul L. High folic acid intake reduces natural killer cell cytotoxicity in aged mice. J Nutr Biochem. 2016;30:102–7. doi: 10.1016/j.jnutbio.2015.12.006. [DOI] [PubMed] [Google Scholar]
- 41.Meadows DN, Bahous RH, Best AF, Rozen R. High Dietary Folate in Mice Alters Immune Response and Reduces Survival after Malarial Infection. PLoS One. 2015;10:e0143738. doi: 10.1371/journal.pone.0143738. [DOI] [PMC free article] [PubMed] [Google Scholar]
- 42.Imai K, Matsuyama S, Miyake S, Suga K, Nakachi K. Natural cytotoxic activity of peripheral-blood lymphocytes and cancer incidence: an 11-year follow-up study of a general population. Lancet. 2000;356:1795–9. doi: 10.1016/S0140-6736(00)03231-1. [DOI] [PubMed] [Google Scholar]
- 43.Furue H, Matsuo K, Kumimoto H, Hiraki A, Suzuki T, Yatabe Y, Komori K, Kanemitsu Y, Hirai T, Kato T, et al. Decreased risk of colorectal cancer with the high natural killer cell activity NKG2D genotype in Japanese. Carcinogenesis. 2008;29:316–20. doi: 10.1093/carcin/bgm260. [DOI] [PubMed] [Google Scholar]
- 44.Levy EM, Roberti MP, Mordoh J. Natural killer cells in human cancer: from biological functions to clinical applications. J Biomed Biotechnol. 2011;2011 doi: 10.1155/2011/676198. 676198. [DOI] [PMC free article] [PubMed] [Google Scholar]
- 45.Hou H, Mao L, Wang J, Liu W, Lu Y, Yu J, Zhou Y, Wang F, Sun Z. Establishing the reference intervals of NK cell functions in healthy adults. Hum Immunol. 2016;77:637–42. doi: 10.1016/j.humimm.2016.05.022. [DOI] [PubMed] [Google Scholar]
- 46.Yamaguchi T, Hirota K, Nagahama K, Ohkawa K, Takahashi T, Nomura T, Sakaguchi S. Control of immune responses by antigen-specific regulatory T cells expressing the folate receptor. Immunity. 2007;27:145–59. doi: 10.1016/j.immuni.2007.04.017. [DOI] [PubMed] [Google Scholar]
- 47.Kunisawa J, Hashimoto E, Ishikawa I, Kiyono H. A pivotal role of vitamin B9 in the maintenance of regulatory T cells in vitro and in vivo. PLoS One. 2012;7:e32094. doi: 10.1371/journal.pone.0032094. [DOI] [PMC free article] [PubMed] [Google Scholar]
- 48.Tian Y, Wu G, Xing JC, Tang J, Zhang Y, Huang ZM, Jia ZC, Zhao R, Tian ZQ, Wang SF, et al. A novel splice variant of folate receptor 4 predominantly expressed in regulatory T cells. BMC Immunol. 2012;13:30. doi: 10.1186/1471-2172-13-30. [DOI] [PMC free article] [PubMed] [Google Scholar]
- 49.Zimmer J, Andrès E, Hentges F. NK cells and Treg cells: a fascinating dance cheek to cheek. Eur J Immunol. 2008;38:2942–5. doi: 10.1002/eji.200838813. [DOI] [PubMed] [Google Scholar]
- 50.Lee SK, Kim JY, Jang BW, Hur SE, Na BJ, Lee M, Fukui A, Gilman-Sachs A, Kwak-Kim J. Foxp3high and Foxp3low Treg cells differentially correlate with T helper 1 and natural killer cells in peripheral blood. Human Immunology. 2011;72:621–6. doi: 10.1016/j.humimm.2011.03.013. [DOI] [PubMed] [Google Scholar]
- 51.Martín-Fontecha A, Thomsen LL, Brett S, Gerard C, Lipp M, Lanzavecchia A, Sallusto F. Induced recruitment of NK cells to lymph nodes provides IFN-gamma for T(H)1 priming. Nat Immunol. 2004;5:1260–5. doi: 10.1038/ni1138. [DOI] [PubMed] [Google Scholar]
- 52.Vivier E, Raulet DH, Moretta A, Caligiuri MA, Zitvogel L, Lanier LL, Yokoyama WM, Ugolini S. Innate or adaptive immunity? The example of natural killer cells. Science. 2011;331:44–9. doi: 10.1126/science.1198687. [DOI] [PMC free article] [PubMed] [Google Scholar]
- 53.Xu X, Gammon MD, Wetmur JG, Rao M, Gaudet MM, Teitelbaum SL, Britton JA, Neugut AI, Santella RM, Chen J. A functional 19-base pair deletion polymorphism of dihydrofolate reductase (DHFR) and risk of breast cancer in multivitamin users. Am J Clin Nutr. 2007;85:1098–102. doi: 10.1093/ajcn/85.4.1098. [DOI] [PubMed] [Google Scholar]
- 54.Bolton-Maggs PH, Stevens RF, Dodd NJ, Lamont G, Tittensor P, King MJ, Haematology GHTFotBCfSi Guidelines for the diagnosis and management of hereditary spherocytosis. Br J Haematol. 2004;126:455–74. doi: 10.1111/j.1365-2141.2004.05052.x. [DOI] [PubMed] [Google Scholar]
- 55.Perrotta S, Gallagher PG, Mohandas N. Hereditary spherocytosis. Lancet. 2008;372:1411–26. doi: 10.1016/S0140-6736(08)61588-3. [DOI] [PubMed] [Google Scholar]