

Abstract
Background
In the United States, the seasonality of respiratory syncytial virus (RSV) has traditionally been defined on the basis of weeks during which antigen-based tests detect RSV in >10% of specimens (hereafter, the “10% threshold”). Because molecular testing has become more widely used, we explored the extent of polymerase chain reaction (PCR)–based RSV testing and its impact on determining the seasonality of RSV.
Methods
We assessed antigen- and PCR-based RSV reports submitted to the National Respiratory and Enteric Virus Surveillance System during July 2005–June 2015. To characterize RSV seasons by using PCR-based reports, we assessed the traditional 10% threshold; subsequently, we developed 3 methods based on either PCR-based detections or the percentage of positive test results.
Results
The annual number of PCR-based reports increased 200-fold during 2005–2015, while the annual number of antigen-based reports declined. The weekly percentage of specimens positive for RSV by PCR was less than that for antigen-detection tests; accordingly, the 10% threshold excluded detections by PCR and so was imprecise for characterizing RSV seasons. Among our PCR-specific approaches, the most sensitive and consistent method captured 96%–98% of annual detections within a season, compared with 82%–94% captured using the traditional method.
Conclusions
PCR-based reports are increasingly relevant for RSV surveillance and determining the seasonality of RSV. These PCR-specific methods provide a more comprehensive understanding of RSV trends, particularly in settings where testing and reporting are most active. Diagnostic practices will vary by locality and should be understood before choosing which method to apply.
Keywords: RSV surveillance, RSV season, season threshold, antigen diagnostic tests, molecular diagnostic tests
Respiratory syncytial virus (RSV) is a major cause of lower respiratory tract infection in young children worldwide [1]. In the United States, RSV is responsible for >50 000 hospitalizations and 2 million outpatient visits annually among children aged <5 years [2]. Among US adults aged ≥65 years, RSV is associated with an estimated 177 000 annual hospitalizations and 14 000 deaths [3]. There is currently no approved RSV vaccine, but immunoprophylaxis is available for high-risk infants [4].
The Centers for Disease Control and Prevention (CDC) has traditionally described national RSV circulation by using antigen-based RSV tests, with frequencies of positive results reported to the National Respiratory and Enteric Virus Surveillance System (NREVSS) [5]. Similar to the definition used previously to describe the influenza season [6], the annual season of RSV was defined for epidemiologic purposes on the basis of weeks during which antigen-based tests detect RSV in >10% of specimens (hereafter, the “10% threshold”) [7, 8]. By use of this method, the national RSV season is typically from fall through spring, but season onset varies between US regions [8, 9] and between smaller locales [10, 11]. During the past decade, many clinical laboratories have adopted molecular diagnostic assays to detect RSV (and other respiratory viruses) [12] because of improved sensitivity (and often specificity) as compared to antigen-detection tests or virus isolation [13]; RSV diagnostic assays continue to evolve [14]. Given these changes, we assessed each RSV test type for which data were reported to NREVSS and evaluated RSV circulation on the basis of molecular- and antigen-based diagnostic methods.
Methods
Data Collection
NREVSS is a national passive surveillance network that collects weekly aggregate test results for RSV and other viruses from clinical, public health, and reference laboratories [5]. Reports are categorized on the basis of the following 3 diagnostic methods: virus isolation by culture, antigen-based methods, or polymerase chain reaction (PCR)–based methods (which includes all reported molecular-based diagnostic platforms). NREVSS surveillance year begins on the first week with at least 4 days in July (typically epidemiologic week 27) and ends the following year on the last week with at least 4 days in June (typically epidemiologic week 26). To limit our analysis to laboratories that consistently reported data, we included those that reported results for an average of ≥10 RSV tests per week annually for at least 30 weeks of NREVSS year [8], during July 2005–June 2015; we applied these criteria to data from the 3 diagnostic methods separately. For each week in a given surveillance year, we also assessed the number of consistent reporters that had submitted RSV data to NREVSS; this was done to ensure that a sufficient proportion of annual consistent reporters were contributing throughout the year.
To assess recent laboratory-specific practices for detection of RSV and other respiratory viruses, we interviewed laboratory staff by telephone from a convenience sample of NREVSS reporters across the country. We used a standard questionnaire that included questions about diagnostic testing methods, testing practices, and laboratory changes during the previous 5 surveillance years (2009–2014).
Data Analysis
To assess reporting trends across the United States, we compared reports from NREVSS laboratories that consistently reported data on each diagnostic method, by year and by geographical distribution. To explore the characteristics of RSV seasons with PCR-based reports, we assessed the weekly number of RSV tests performed, the number of tests detecting RSV, and the corresponding percentage of tests positive for RSV during July 2009–June 2015; prior to July 2009, PCR-based reports were considered too few for reliable analysis of RSV seasons. To characterize the RSV season with PCR data, we first assessed the traditional 10% threshold [7, 8]. We subsequently explored a variety of different approaches, which varied in complexity, to identify notable and sustained increases in either RSV detections or the percentage of tests detecting RSV. We assessed various data-smoothing techniques, including the use of moving averages or polynomial regression, and we explored approaches that could be applied to data retrospectively or in near real time. Finally, we developed 3 new methods for characterizing season with PCR data, based on (1) the increase (or slope) in the number of RSV detections, by week; (2) the number of RSV detections relative to the preseason baseline, by week; and (3) the percentage of tests detecting RSV, by week.
With each approach, we determined season characteristics nationally and by census region, including season onset (or start), duration, peak, offset (or end), and percentage of annual detections that occur within the season (ie, from onset to offset). We compared these measures to those derived from the traditional method, which uses data from antigen-detection tests, and we assessed relative strengths and weaknesses of each approach. The virus isolation data were not used to assess season characteristics.
Descriptive and quantitative analyses were conducted using Microsoft Access 2010, Microsoft Excel 2010, SAS 9.3, and R statistical computing software (version 3.3.1).
Results
During July 2005–June 2015, the number of laboratories reporting to NREVSS varied, peaking in 2008–2009 at 724 (Figure 1A); not all laboratories met our definition for consistent reporting. Across the 10 surveillance years, the number of laboratories consistently reporting PCR-based RSV results steadily increased from 2 to 82, while laboratories consistently reporting antigen or viral culture results declined (Figure 1A). During surveillance year 2014–2015 (July 2014 to June 2015), more PCR-based RSV tests than antigen–based RSV tests were performed and submitted to NREVSS from consistent reporters (Figure 1B); the number of PCR-based reports of RSV detection was also higher than for antigen-based reports (Figure 1C). Additionally, laboratories that consistently reported PCR results during 2014–2015 were distributed across more states (n = 37) than those consistently reporting results of either antigen-detection tests (n = 32) or virus isolation (n = 21; Supplementary Figure 1). For each week of a given surveillance year (including the summer months), more than half of the laboratories consistently reporting PCR findings contributed to NREVSS.
Figure 1.
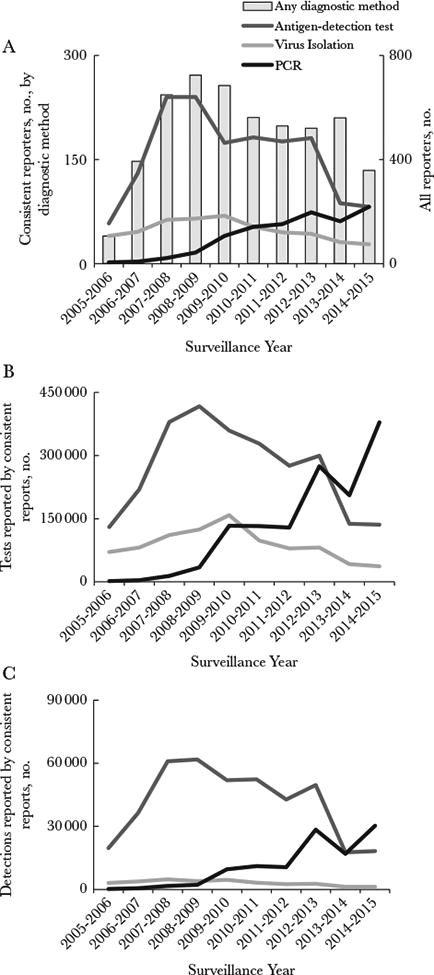
Reporting of respiratory syncytial virus (RSV) diagnostic data by National Respiratory and Enteric Virus Surveillance System (NREVSS) laboratories during July 2005–June 2015. A, Numbers of all reporting laboratories (bars) and those consistently reporting data for each diagnostic method (lines). B and C, RSV tests from consistent reporters (B) and RSV detections from consistent reporters (C), by surveillance year and diagnostic method. NREVSS laboratories that consistently reported data are defined here as those that reported data for an average of ≥10 RSV tests per week annually for at least 30 weeks of NREVSS-defined year. PCR, polymerase chain reaction.
To further assess recent testing practices for RSV and respiratory pathogens, we interviewed a convenience sample of laboratories reporting findings to NREVSS reported during January–August 2014. Survey participants included 108 clinical laboratories from 48 states; all tested for RSV, and 96% (104) tested for RSV throughout the year. Testing practices varied by site; only 31% of sites (33 of 108) reported use of a standard protocol in selecting testing methods for respiratory samples, whereas 45% (49 of 108) followed a physician order, and 20% (22 of 108) reported temporarily changing practices outside the RSV season. Corroborating our NREVSS findings, 87% of interview respondents (94 of 108) had changed their respiratory sample testing practices in the previous 5 years; 62% (59 of 94) reported increased use of molecular testing, 14% (13 of 94) reported discontinued or decreased use of virus isolation methods, and 9% (8 of 94) reported discontinued or decreased use of antigen-detection tests.
Given this increase in PCR-based reporting, we analyzed attributes affecting the definition of an RSV season. We assessed weekly RSV tests, detections, and percentages of tests positive for RSV among PCR- and antigen-based reports during July 2009–June 2015 (Figure 2 [national] and Supplementary Figure 2 [regional]). The weekly percentage of tests positive for RSV was notably lower for PCR-based reports than for antigen-based reports (Figure 2C), and so the PCR and antigen data were not combined for further analyses. When applied to the PCR-based data, the 10% threshold yielded season onsets between weeks 47–52 and offsets between weeks 10–12 of the following calendar year (Figure 2C). This equated to season durations of 13–18 weeks, which captured only 72%–82% of annual detections by PCR within season. By comparison, the antigen-based data yielded season durations of 19–31 weeks, and captured 82%– 94% of annual detections by antigen-detection tests within seasons. Because the 10% threshold excluded applicable detections by PCR, it was deemed inappropriate for use with PCR-based reports. New approaches for characterizing RSV seasons by means of PCR-based reports were therefore explored.
Figure 2.
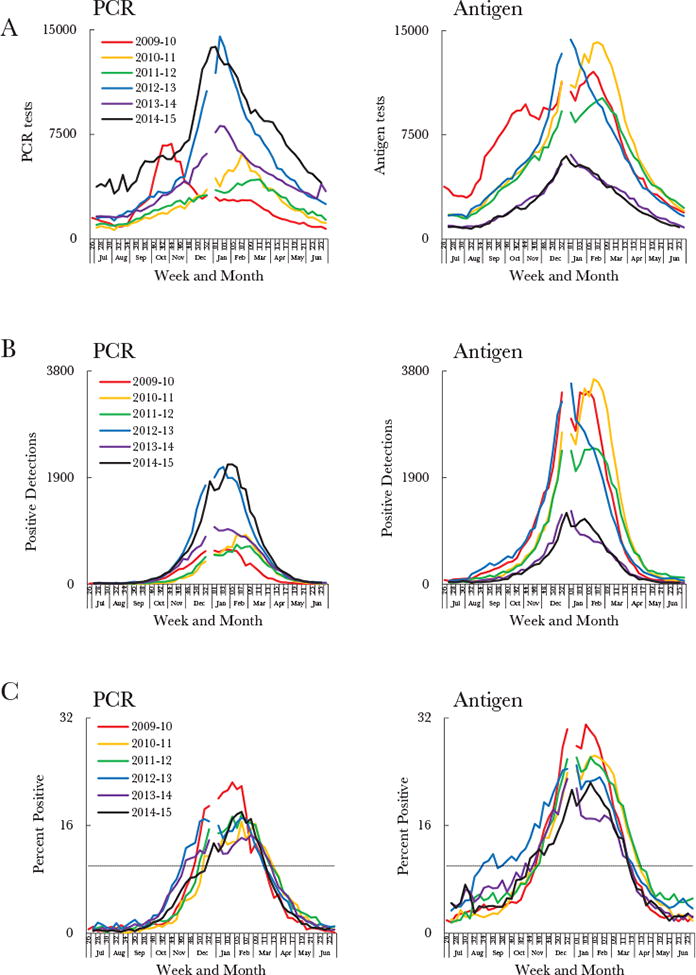
Comparison of respiratory syncytial virus (RSV) data from polymerase chain reaction (PCR) and antigen-detection tests, based on weekly numbers of RSV tests (A) and detections (B) and the weekly percentage of tests positive for RSV (C) across 6 surveillance years during July 2009–June 2015, by diagnostic method. The dashed line in panel C represents the 10% threshold. All data are limited to National Respiratory and Enteric Virus Surveillance System (NREVSS) laboratories that consistently reported data, defined here as those that reported data for an average of ≥10 RSV tests per week annually for at least 30 weeks of NREVSS-defined year. Surveillance started at week 27 for all years except 2009–2010, during which it started at week 26. Calendar years ended at week 52 for all years except 2014, which ended at week 53; there is therefore a gap in some of the data curves.
Further investigation of reported data on testing and detection revealed that variations in PCR testing might inconsistently influence the percentage of tests positive for RSV. During October–November 2009, the number of RSV PCR tests peaked dramatically, more so than antigen-detection tests (Figure 3). This anomaly was likely reflective of multipathogen PCR use during the influenza A(H1N1) pandemic [15, 16]. At the same time, RSV detections were starting to rise, but because the increase in detections was marginal compared to the increase in tests, the increase in percentage of tests positive for RSV was delayed. Because tests intended for detection of other respiratory pathogens might influence the denominator for the percentage of tests positive for RSV across a surveillance year, we assessed the usefulness of RSV detections alone for defining seasons. National (Figure 2B) and regional (Supplementary Figure 2B) detections by PCR increased across the 6 years and exhibited consistent trends each year.
Figure 3.
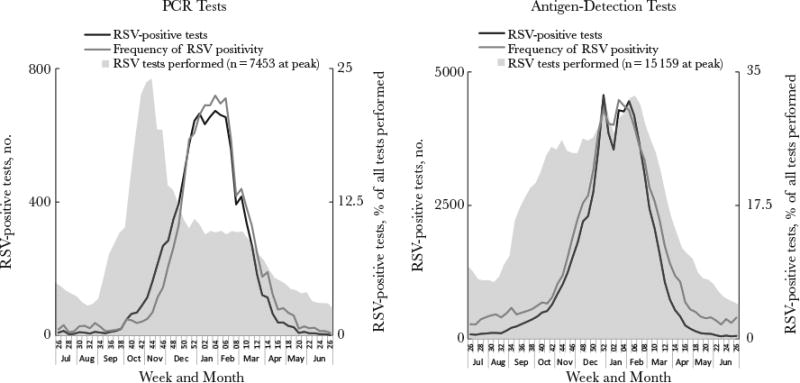
Comparison of respiratory syncytial virus (RSV) tests, detections, and percentage of tests positive for RSV during July 2009–June 2010, by diagnostic method. RSV tests are represented on a different scale to either of the axes depicted; the peak numbers of RSV tests are instead shown on the figures. Data are limited to National Respiratory and Enteric Virus Surveillance System (NREVSS) laboratories that consistently reported data, defined here as those that reported data for an average of ≥10 RSV tests per week annually for at least 30 weeks of NREVSS-defined year. The 2009–2010 surveillance year started at week 26 in 2009 and ended in week 26 in 2010. The 2009 calendar year ended at week 52.
Based on RSV detections, we developed the retrospective slope 10 (RS10) method to reflect weekly changes in detections as precisely and consistently as possible (Table 1). We used a centered 5-week moving average of weekly RSV detections to smooth weekly variation. We then normalized these data (ie, put them on an equal scale) to a season peak of 1000 detections to allow comparisons between seasons and regions (Figure 4A [national] and Supplementary Figure 3 [regional]). We defined the season onset as the second of 2 consecutive weeks when the slope (ie, the simple increase in the normalized 5-week moving average between subsequent weeks) exceeded 10 normalized detections per week, provided that the slope exceeded 10 from that week forward. During July 2009–June 2015, the RS10 method yielded national season onsets between weeks 38 and 45, which corresponded to a sustained rise in normalized detections (Figure 4A).
Table 1. Features, Strengths, and Limitations of 4 Methods for Determining Respiratory Syncytial Virus (RSV) Seasons, Using Testing Data From the National Respiratory and Enteric Virus Surveillance System (NREVSS).
| Feature | Retrospective Slope 10 | 10-Fold Baseline | 3% Threshold | 10% Threshold (Traditional) |
|---|---|---|---|---|
| Test type | PCR | PCR | PCR | Antigen based |
| Data | Weekly no. of RSV detections | Weekly no. of RSV detections | Weekly percentage of tests positive for RSV | Weekly percentage of tests positive for RSV |
| Data function | Centered 5-week moving average normalized to a peak of 1000 detections | 4-week moving average, using detections in 2 preceding weeks, current week, and following week | None | None |
| Onset | Second of 2 consecutive weeks when simple increase in normalized 5-week moving average of RSV detections between subsequent weeks (ie, slope) was >10, provided that slope remained at least 10 from that week forwardThe normalized 5-week moving average of RSV detections at onset equals α | First of 2 consecutive weeks when 4-week moving average of RSV detections is >10 times the 4-week moving average at week 29 | First of 2 consecutive weeks when percentage of tests positive for RSV is >3% | First of 2 consecutive weeks when percentage of tests positive for RSV is >10% |
| Offset | Last week that normalized 5-week moving average of RSV detections exceeds α | Last week that 4-week moving average of RSV detections is >10 times the 4-week moving average at week 29 | Last week that percentage of tests positive for RSV is >3% | Last week that percentage of tests positive for RSV is >10% |
| Strengths | Testing practices have less influence on season because testing denominator is excludedPercentage captured in season is consistent between yearsOnset consistently reflects a notable infection point in RSV detectionsRegion-specific approach because measure is relative to normalized regional peakData are normalized at peak of season, when most laboratories are reporting to NREVSS | Applied in near real timeTesting practices have less influence on season because testing denominator is excludedRegion-specific approach because measure is relative to regional baseline | Applied in near real time Simple to useA possible approach in locales where RSV testing or reporting are not performed throughout the year; this is because (1) number of weekly tests performed are incorporated and (2) weekly percentage of tests positive for RSV is not relative to that for other weeks | Applied in near real time Simple to use |
| Limitations | Not applied in real timeYear-round RSV testing and reporting is required (including summer months) because (1) testing denominator has been excluded and (2) data are presented relative to other weeks | Year-round RSV testing and reporting is required (including summer months) because (1) testing denominator has been excluded and (2) data are presented relative to other weeksPercentage of detections captured within season is less consistent between years and regions than for RS 10Data are relative to a time of year when RSV detections are low and fewer laboratories are reporting | Use of denominator means that testing practices can influence season; the following should be considered: (1) changing practices over time, (2) different practices between regions, and (3) intention of test (antigen-detection tests are more typically RSV specific, but antigen panels are available)Percentage of detections captured within season is less consistent between years and regions than for RS 10A single-value threshold might not be as precise for all seasons and regions, especially as testing practices vary | Use of denominator means that testing practices can influence season. The following should be considered: (1) changing practices over time, (2) different practices between regions, and (3) intention of test (antigen-detection tests are more typically RSV-specific, but antigen panels are available)Percentage of detections captured within season is inconsistent between years and regionsA single-value threshold might not be as precise for all seasons and regions, especially as testing practices vary |
Abbreviation: PCR, polymerase chain reaction.
Figure 4.
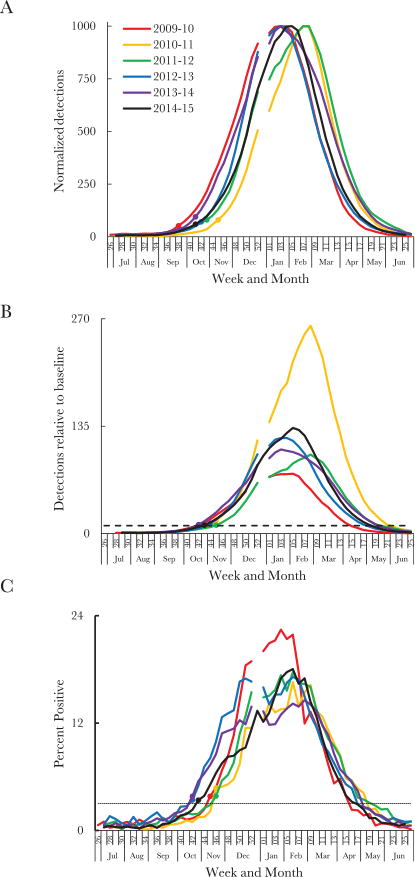
Methods for defining respiratory syncytial virus (RSV) season, using RSV detections reported on the basis of polymerase chain reaction (PCR) diagnostic assays. A, Generation of onset week, using the retrospective slope 10 (RS10) method. The normalized centered 5-week moving average of weekly RSV detections by PCR during July–June are shown for each surveil-lance year. The onset week for each season is depicted by a solid circle of the same color. B, Generation of onset week, using the 10-fold baseline (10FB) method. The 4-week moving average of weekly RSV detections by PCR, relative to the 4-week moving average at week 29, are shown for each surveillance year during July–June. The horizontal line represents the 10-fold increase in detections relative to week 29. The onset week for each season is a solid circle of the same color. C, Generation of onset week, using the 3% threshold method. The weekly percentage of tests positive for RSV is shown for each surveillance year during July–June. The horizontal line represents the 3% threshold. The onset week for each season is a solid circle of the same color. All data are limited to National Respiratory and Enteric Virus Surveillance System (NREVSS) laboratories that consistently reported data, defined here as those that reported data for an average of ≥10 RSV tests per week annually for at least 30 weeks of NREVSS-defined year. Surveillance started at week 27 for all years except 2009–2010, during which it started at week 26. Calendar years ended at week 52 for all years except 2014, which ended at week 53; there is therefore a gap in some of the data curves.
To provide a near real-time approximation to the retrospective national and regional onset estimates yielded by the RS10 method, we developed the 10-fold baseline (10FB) method, which compares RSV detections in a given week to those at the preseason baseline (Table 1). To smooth weekly variation, we chose a 4-week moving average of RSV detections in the 2 previous weeks, the current week, and 1 week ahead; this 4-week moving average was chosen over a 5-week moving average to reduce (from 2 weeks to 1 week) the time lag for identifying a real-time season onset. The 4-week moving average at each week was then presented as a fold increase from the preseason baseline (Figure 4B [national] and Supplementary Figure 4 [regional]). For the national and regional analyses, we defined the preseason baseline as the 4-week moving average at week 29 because (1) it centered weeks 26–33, which typically had the lowest detections in the surveillance year, both nationally and regionally (Supplementary Figure 5); (2) a consistent number of laboratories reported to NREVSS in week 29 (Supplementary Table 1); and (3) a consistent number of detections were reported in week 29 (Supplementary Table 1). We defined season onset as the first of 2 consecutive weeks when the 4-week moving average of detections was >10 times the detections at week 29; the 10-fold measure was both simple and applicable across census regions. Based on the 10FB method, national season onsets during July 2009–June 2015 were between weeks 42 and 45.
Finally, we developed a method that defined season onset as the first of 2 consecutive weeks when the weekly percentage of tests positive for RSV was >3% (hereafter, the “3% threshold”; Figure 4C [national] and Supplementary Figure 6 [regional]). We chose this threshold because the national and regional percentage of tests positive for RSV throughout the summer months was typically <3%; once the 3% threshold was exceeded, the percentage of tests yielding RSV continued to increase rapidly. This third method provided a simple approach that accounted for the number of tests performed. Based on the 3% threshold, national season onsets during July 2009–June 2015 were between weeks 42 and 46.
We compared methods by evaluating how closely the onset weeks reflected changes in raw (unadjusted) RSV detections (Figure 5A). For each surveillance year, the national onset determined by the RS10 method identified a consistent part of the curve that corresponded with a notable and sustained rise in raw (unadjusted) weekly RSV detections. The RS10 method also appeared to reflect changes in national RSV detections more sensitively than any other method. For each method, we also evaluated the consistency across surveillance years of season characteristics, such as season duration and the proportion of annual detections captured (Table 2). The RS10 method most consistently captured a similar percentage of the annual detections within seasons across the 6 surveillance years; this was the case both nationally (Table 2) and within most census regions (Supplementary Tables 2–5). The 10FB and 3% threshold methods provided reasonable real-time approximations to the retrospective estimates yielded by the RS10 method.
Figure 5.
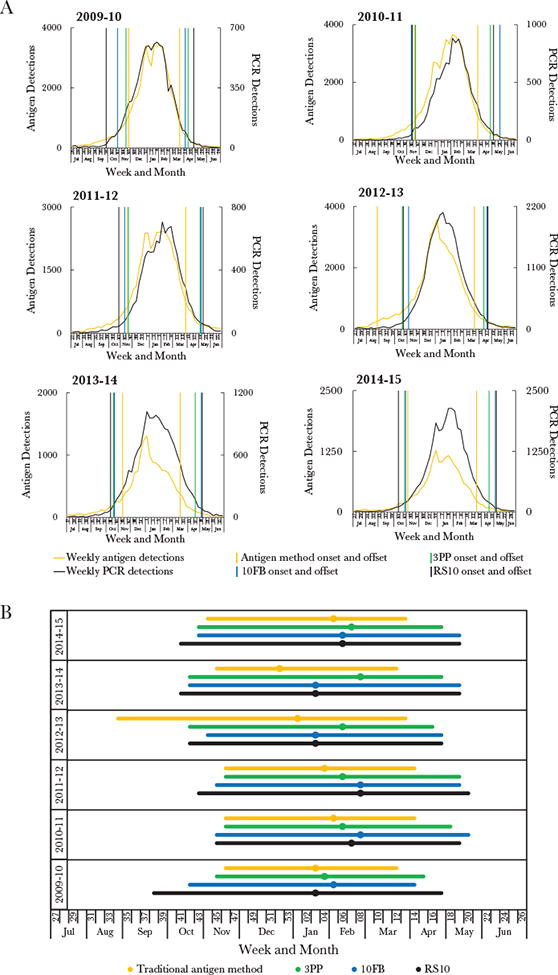
Comparison of respiratory syncytial virus (RSV) seasons, generated by 4 different methods. A, National estimates for season onset and offset generated by the 4 methods overlaid on the weekly raw (unadjusted) RSV detections. Each graph represents a different surveillance year, as labeled. Weekly detection of RSV by both polymerase chain reaction (PCR; black data curve) and antigen-detection (yellow data curve) tests are depicted. Season onset and offset are shown for (1) the 10% threshold method (ie, the traditional antigen-based method; vertical yellow lines), (2) the 3% threshold method (vertical green lines), (3) the 10-fold baseline (10FB) method (vertical blue lines), and (4) the retrospective slope 10 (RS10) method (vertical black lines). B, Comparison of season characteristics for the 4 methods during July 2009–June 2015. Depicted are season onset, peak (circles), and offset for 4 methods: (1) the 10% threshold method (yellow bar and circle), (2) the 3% threshold method (green bar and circle), (3) the 10FB method (blue bar and circle), and (4) the RS10 method (black bar and circle). All data are limited to National Respiratory and Enteric Virus Surveillance System (NREVSS) laboratories that consistently reported data, defined here as those that reported data for an average of ≥10 RSV tests per week annually for at least 30 weeks of NREVSS-defined year. Surveillance started at week 27 for all years except 2009–2010, during which it started at week 26. Calendar years ended at week 52 for all years except 2014, which ended at week 53.
Table 2. National Characteristics of Seasons of Respiratory Syncytial Virus (RSV), by Method, Using Data From Laboratories Consistently Reporting Results to the National Respiratory and Enteric Virus Surveillance System, July 2009–June 2015.
| Surveillance Year | Consistent Reporters, No. | Onset Week | Peak Week | Offset Week | Duration, Weeks | Percentage Captured Within Seasona |
|---|---|---|---|---|---|---|
| Retrospective slope 10 method | ||||||
| 2009–2010 | 40 | 38 | 3 | 17 | 32 | 98.1 |
| 2010–2011 | 53 | 45 | 7 | 19 | 26 | 97.2 |
| 2011–2012 | 57 | 43 | 8 | 20 | 30 | 96.2 |
| 2012–2013 | 74 | 42 | 3 | 17 | 27 | 96.6 |
| 2013–2014 | 61 | 41 | 3 | 19 | 30 | 97.0 |
| 2014–2015 | 82 | 41 | 6 | 19 | 31 | 97.6 |
| Overall | ||||||
| Median (range) | 59.0 (40–82) | 41.5 (38–45) | 4.5 (3–8) | 19.0 (17–20) | … | … |
| Mean ± SD | … | … | … | … | 29.3 ± 2.1 | 97.1 ± 0.6 |
| 10-fold baseline method | ||||||
| 2009–2010 | 40 | 42 | 5 | 14 | 25 | 94.7 |
| 2010–2011 | 53 | 45 | 8 | 20 | 27 | 97.6 |
| 2011–2012 | 57 | 45 | 8 | 19 | 26 | 94.6 |
| 2012–2013 | 74 | 44 | 3 | 16 | 24 | 95.6 |
| 2014–2015 | 82 | 43 | 6 | 19 | 28 | 96.8 |
| Overall | ||||||
| Median (range) | 59.0 (40–82) | 43.5 (42–45) | 5.5 (3–8) | 19.0 (14–20) | … | … |
| Mean ± SD | … | … | … | … | 26.5 ± 1.7 | 96.0 ± 1.1 |
| 3% threshold method | ||||||
| 2009–2010 | 40 | 45 | 4 | 15 | 23 | 91.5 |
| 2010–2011 | 53 | 46 | 6 | 18 | 24 | 96.4 |
| 2011–2012 | 57 | 46 | 6 | 19 | 25 | 93.9 |
| 2012–2013 | 74 | 42 | 6 | 16 | 26 | 96.1 |
| 2013–2014 | 61 | 42 | 8 | 17 | 27 | 95.5 |
| 2014–2015 | 82 | 43 | 7 | 17 | 27 | 95.7 |
| Overall | ||||||
| Median (range) | 59.0 (40–82) | 44.0 (42–46) | 6.0 (4–8) | 17.0 (15–19) | … | … |
| Mean ± SD | … | … | … | … | 25.3 ± 1.5 | 94.8 ± 1.7 |
| Traditional antigen-based method | ||||||
| 2009–2010 | 174 | 46 | 3 | 12 | 19 | 84.7 |
| 2010–2011 | 182 | 46 | 5 | 14 | 20 | 89.2 |
| 2011–2012 | 176 | 46 | 4 | 14 | 20 | 85.2 |
| 2012–2013 | 181 | 34 | 1 | 13 | 31 | 93.7 |
| 2013–2014 | 87 | 45 | 52 | 12 | 19 | 82.2 |
| 2014–2015 | 82 | 44 | 5 | 13 | 22 | 87.7 |
| Overall | ||||||
| Median (range) | 175.0 (82–182) | 45.5 (34–46) | 3.5 (52–5) | 13.0 (12–14) | … | … |
| Mean ± SD | … | … | … | … | 21.8 ± 4.2 | 87.1 ± 3.7 |
Based on raw (unadjusted) RSV detections.
Overall, the 3 PCR methods typically defined the national season onset earlier in the year than did the 10% threshold method (ie, the traditional antigen-detection method), and the RSV season was typically longer; except in 2012–2013, when the season onset as determined by the 10% threshold method was considerably earlier (Figure 5 and Table 2). Based on the RS10 method, national RSV seasons started a median of 3 weeks earlier and ended 5.5 weeks later than when traditionally defined. Nationally, this new approach captured 96%–98% of annual RSV detections within season, compared with 82%–94% captured using the 10% threshold method.
Discussion
RSV diagnostic testing practices are changing, driven by the increasing use of molecular diagnostic assays. We document the increasing use of PCR diagnostic assays for RSV detection across the United States over the past decade, accompanied by a simultaneous decrease in use of antigen-detection assays and virus isolation by culture. The impact of such changes on RSV surveillance and determining the seasonality of RSV, however, had not been previously addressed. Our study uses recent national RSV surveillance data to compare methods to more precisely determine season onset and duration and to better define the role of PCR diagnostic tests in these determinations.
While increased use of PCR is reported across the United States, many laboratories still report antigen-detection methods for RSV; this is likely because rapid antigen-detection tests are inexpensive, fast, and easy to use [12, 17, 18]. To determine RSV season onset and duration, however, PCR-based reports must be evaluated differently than antigen-based reports. Historically, the CDC has determined RSV seasonality by using the frequency of antigen-based tests positive for RSV[8–11, 19]. Because the overall percentage of tests positive for RSV was consistently lower with PCR-based reports than with antigen-based reports, the 2 test types could not be meaningfully combined, and the traditional 10% threshold was inappropriate for PCR-based reports. The lower PCR baselines may reflect increased clinical use of multipathogen PCR panels; by contrast, antigen-based assays more often reflect tests targeting RSV only. Given these findings, we developed new approaches to interpret the PCR data, based on reports submitted nationally and by census region. As RSV diagnostic methods continue to evolve, we anticipate refining our seasonality approaches as needed to facilitate a more complete understanding of RSV circulation.
For jurisdictions receiving PCR test results from consistent reporters throughout the year (including the summer), season onset and duration can be determined retrospectively by using a normalized 5-week moving average of RSV detections. With this method (RS10), we were able to consistently capture 96%– 98% of annual detections nationally within a season (between onset and offset). Because of this consistency and because this approach best identified sustained increases in RSV detections to define season onset, in the future the CDC will use this method to characterize an RSV season retrospectively. When a real-time estimate is needed, however, RSV season could be determined using a threshold that represents an increase relative to a predefined preseason baseline. Our 10FB method for national and regional data used a 10-fold increase in RSV detections relative to the 4-week moving average at week 29 and captured 95%–98% of national annual detections within season. With data from smaller jurisdictions, a locally tailored baseline should be considered. Consistent testing is required for both RS10 and 10FB because the testing denominator is not incorporated into the season determination and because the weekly data are presented relative to other weeks. These methods may therefore not be generalizable to all state or local jurisdictions. Local testing practices and surveillance should be understood before using these methods.
Our third PCR-specific approach—the 3% threshold—incorporates the RSV tests performed to determine the weekly percentage of tests positive for RSV, as was used traditionally for antigen-based reports; no further data functions are required. This simple approach might allow for a reasonable estimation of RSV season in public health jurisdictions where RSV testing is not performed or reported throughout the year. While the 3% thresholds reflected national and regional data well, the threshold for interpreting data from smaller jurisdictions may vary by location. An important limitation in this approach, however, is the inclusion of tests not intended for RSV; multipathogen PCR panels used when other respiratory viruses are circulating could, using this approach, influence identification of the RSV season inconsistently. Local testing practices should therefore be assessed. As with the other methods, contribution from consistent reporters strengthens season estimates.
Regardless of the specific approach chosen, PCR methods yielded earlier season onsets and longer seasons than traditionally described. Because consistent PCR-based reporting has become more representative nationally than antigen-based reporting, these longer season determinations likely represent RSV circulation more precisely. Additionally, RSV PCR tests are more sensitive (and sometimes more specific) than rapid antigen-detection tests among children and especially adults [13], meaning that PCR can be used across all ages; antigen-detection tests are typically limited to infants and children. This is especially relevant in light of candidate vaccines targeting older adults [20–23] and pregnant women [20–22, 24–26], because RSV circulation among adults is not well described and likely underestimated [27].
Over 60 new candidate RSV vaccines and monoclonal antibodies are currently in various stages of clinical trials [20, 25, 28–30]. Future effectiveness studies will benefit from a more precise estimate of prevaccine RSV circulation, made possible by PCR testing. Additionally, the timing of future RSV vaccine delivery in certain populations might also be influenced by seasonality, as with the seasonal influenza vaccine [31]. PCR-based estimates of the RSV season could also contribute to decision making regarding immunoprophylaxis use, although such considerations would also need to account for RSV disease, RSV hospitalizations, and cost-effectiveness.
Our study had several limitations. We analyzed reports to NREVSS, which is a passive and voluntary surveillance system in which the number of participating laboratories can vary between seasons, patient demographic characteristics and specific specimen information are not collected, duplication is possible if both antigen-based and PCR tests are performed on the same specimen or if multiple specimens are reported from a single patient, and severity of illness, such as the need for hospitalization, is not known. RSV detections, especially those from PCR-based virus panels, could occasionally represent RSV codetections and might not reflect RSV illness. Our season analyses reflected NREVSS data compiled nationally and by census region; with data from smaller jurisdictions, our new methods may be less precise than locally tailored determinations. Finally, the onset definitions for our new methods were arbitrary to some degree; for example, with 10FB, an 8–13-fold increase from baseline would have yielded similar onsets (±1 week) to those for a 10-fold increase, but the 10-fold increase was chosen for simplicity.
RSV PCR results are now reported more widely across the United States than results of either antigen-detection tests or virus isolation methods and are increasingly important for routine RSV surveillance. Determining RSV seasonality with PCR-based reports is critical for providing a more comprehensive understanding of RSV circulation for epidemiologic purposes.
Supplementary Material
Acknowledgments
We thank all NREVSS reporters, for their contribution to this analysis; the participants in the laboratory practices survey; and Brett Whitaker (CDC), for contributing to the survey content.
Financial support. This work was supported by the Centers for Disease Control and Prevention.
Footnotes
Supplementary Data: Supplementary materials are available at The Journal of Infectious Diseases online. Consisting of data provided by the authors to benefit the reader, the posted materials are not copyedited and are the sole responsibility of the authors, so questions or comments should be addressed to the corresponding author.
Potential conflicts of interest. All authors: No reported conflicts of interest. All authors have submitted the ICMJE Form for Disclosure of Potential Conflicts of Interest. Conflicts that the editors consider relevant to the content of the manuscript have been disclosed.
Disclaimer. The findings and conclusions in this report are those of the authors and do not necessarily represent the official position of the Centers for Disease Control and Prevention.
References
- 1.Nair H, Nokes DJ, Gessner BD, et al. Global burden of acute lower respiratory infections due to respiratory syncytial virus in young children: a systematic review and meta-analysis. Lancet. 2010;375:1545–55. doi: 10.1016/S0140-6736(10)60206-1. [DOI] [PMC free article] [PubMed] [Google Scholar]
- 2.Hall CB, Weinberg GA, Iwane MK, et al. The burden of respiratory syncytial virus infection in young children. N Engl J Med. 2009;360:588–98. doi: 10.1056/NEJMoa0804877. [DOI] [PMC free article] [PubMed] [Google Scholar]
- 3.Falsey AR, Hennessey PA, Formica MA, Cox C, Walsh EE. Respiratory syncytial virus infection in elderly and high-risk adults. N Engl J Med. 2005;352:1749–59. doi: 10.1056/NEJMoa043951. [DOI] [PubMed] [Google Scholar]
- 4.American Academy of Pediatrics CoIDaBGC. Policy statement: Updated guidance for palivizumab prophylaxis among infants and young children at increased risk of hospitalization for respiratory syncytial virus infection. Pediatrics. 2014;134:415–20. doi: 10.1542/peds.2014-1665. [DOI] [PubMed] [Google Scholar]
- 5.Centers for Disease C. National Respiratory and Enteric Virus Surveillance System (NREVSS) [Accessed November 29, 2016]; https://www.cdc.gov/surveillance/nrevss/
- 6.Centers for Disease Control and Prevention. Update: influenza activity–United States and worldwide, 2003–04 season, and composition of the 2004–05 influenza vaccine. MMWR Morb Mortal Wkly Rep. 2004;53:547–52. [PubMed] [Google Scholar]
- 7.Centers for Disease Control and Prevention. Respiratory syncytial virus outbreak activity–United States, 1992. MMWR Morb Mortal Wkly Rep. 1993;42:5–7. [PubMed] [Google Scholar]
- 8.Haynes AK, Prill MM, Iwane MK, Gerber SI Centers for Disease Control and Prevention (CDC) Respiratory syncytial virus—United States, July 2012–June 2014. MMWR Morb Mortal Wkly Rep. 2014;63:1133–6. [PMC free article] [PubMed] [Google Scholar]
- 9.Centers for Disease C, Prevention. Respiratory syncytial virus activity—United States, July 2011–January 2013. MMWR Morb Mortal Wkly Rep. 2013;62:141–4. [PMC free article] [PubMed] [Google Scholar]
- 10.Mullins JA, Lamonte AC, Bresee JS, Anderson LJ. Substantial variability in community respiratory syncytial virus season timing. Pediatr Infect Dis J. 2003;22:857–62. doi: 10.1097/01.inf.0000090921.21313.d3. [DOI] [PubMed] [Google Scholar]
- 11.Panozzo CA, Fowlkes AL, Anderson LJ. Variation in timing of respiratory syncytial virus outbreaks: lessons from national surveillance. Pediatr Infect Dis J. 2007;26:S41–5. doi: 10.1097/INF.0b013e318157da82. [DOI] [PubMed] [Google Scholar]
- 12.Ginocchio CC, McAdam AJ. Current best practices for respiratory virus testing. J Clin Microbiol. 2011;49:S44–S8. [Google Scholar]
- 13.Chartrand C, Tremblay N, Renaud C, Papenburg J. Diagnostic accuracy of rapid antigen detection tests for respiratory syncytial virus infection: systematic review and meta-analysis. J Clin Microbiol. 2015;53:3738–49. doi: 10.1128/JCM.01816-15. [DOI] [PMC free article] [PubMed] [Google Scholar]
- 14.Kanwar N, Hassan F, Nguyen A, Selvarangan R. Head-to-head comparison of the diagnostic accuracies of BD Veritor™ System RSV and Quidel® Sofia® RSV FIA systems for respiratory syncytial virus (RSV) diagnosis. J Clin Virol. 2015;65:83–6. doi: 10.1016/j.jcv.2015.02.008. [DOI] [PubMed] [Google Scholar]
- 15.Centers for Disease C, Prevention. Update: influenza activity–United States, 2009–10 season. MMWR Morb Mortal Wkly Rep. 2010;59:901–8. [PubMed] [Google Scholar]
- 16.Centers for Disease C, Prevention. Update: influenza activity–United States, August 30, 2009–January 9, 2010. MMWR Morb Mortal Wkly Rep. 2010;59:38–43. [PubMed] [Google Scholar]
- 17.Prendergast C, Papenburg J. Rapid antigen-based testing for respiratory syncytial virus: moving diagnostics from bench to bedside? Future Microbiol. 2013;8:435–44. doi: 10.2217/fmb.13.9. [DOI] [PubMed] [Google Scholar]
- 18.Henrickson KJ, Hall CB. Diagnostic assays for respiratory syncytial virus disease. Pediatr Infect Dis J. 2007;26:S36–40. doi: 10.1097/INF.0b013e318157da6f. [DOI] [PubMed] [Google Scholar]
- 19.Centers for Disease C, Prevention. Respiratory syncytial virus–United States, July 2007–June 2011. MMWR Morb Mortal Wkly Rep. 2011;60:1203–6. [PubMed] [Google Scholar]
- 20.PATH Center for Vaccine Innovation and Access. RSV vaccine snapshot. [Accessed July 19, 2017]; http://www.path.org/publications/files/CVIA_rsv_snapshot_final.pdf.
- 21.Glenn GM, Fries LF, Thomas DN, et al. A randomized, blinded, controlled, dose-ranging study of a respiratory syncytial virus recombinant fusion (F) nanoparticle vaccine in healthy women of childbearing age. J Infect Dis. 2016;213:411–22. doi: 10.1093/infdis/jiv406. [DOI] [PubMed] [Google Scholar]
- 22.Glenn GM, Smith G, Fries L, et al. Safety and immunogenicity of a Sf9 insect cell-derived respiratory syncytial virus fusion protein nanoparticle vaccine. Vaccine. 2013;31:524–32. doi: 10.1016/j.vaccine.2012.11.009. [DOI] [PubMed] [Google Scholar]
- 23.Falloon J, Ji F, Curtis C, et al. A phase 1a, first-in-human, randomized study of a respiratory syncytial virus F protein vaccine with and without a toll-like receptor-4 agonist and stable emulsion adjuvant. Vaccine. 2016;34:2847–54. doi: 10.1016/j.vaccine.2016.04.002. [DOI] [PubMed] [Google Scholar]
- 24.Munoz FM. Respiratory syncytial virus in infants: is maternal vaccination a realistic strategy? Curr Opin Infect Dis. 2015;28:221–4. doi: 10.1097/QCO.0000000000000161. [DOI] [PubMed] [Google Scholar]
- 25.Modjarrad K, Giersing B, Kaslow DC, Smith PG, Moorthy VS WHO RSV Vaccine Consultation Expert Group. Vaccine; WHO consultation on respiratory syncytial virus vaccine development report from a World Health Organization meeting held on; 23–24 March 2015; 2016. pp. 190–7. [DOI] [PMC free article] [PubMed] [Google Scholar]
- 26.Langley JM, Aggarwal N, Toma A, et al. A Randomized, controlled, observer-blinded phase 1 study of the safety and immunogenicity of a respiratory syncytial virus vaccine with or without alum adjuvant. J Infect Dis. 2017;215:24–33. doi: 10.1093/infdis/jiw453. [DOI] [PMC free article] [PubMed] [Google Scholar]
- 27.Branche AR, Falsey AR. Respiratory syncytial virus infection in older adults: an under-recognized problem. Drugs Aging. 2015;32:261–9. doi: 10.1007/s40266-015-0258-9. [DOI] [PubMed] [Google Scholar]
- 28.Neuzil KM. Progress toward a respiratory syncytial virus vaccine. Clin Vaccine Immunol. 2016;23:186–8. doi: 10.1128/CVI.00037-16. [DOI] [PMC free article] [PubMed] [Google Scholar]
- 29.Higgins D, Trujillo C, Keech C. Advances in RSV vaccine research and development—A global agenda. Vaccine. 2016;34:2870–5. doi: 10.1016/j.vaccine.2016.03.109. [DOI] [PubMed] [Google Scholar]
- 30.Anderson LJ. Respiratory syncytial virus vaccine development. Semin Immunol. 2013;25:160–71. doi: 10.1016/j.smim.2013.04.011. [DOI] [PubMed] [Google Scholar]
- 31.Grohskopf LA, Sokolow LZ, Broder KR, et al. Prevention and control of seasonal influenza with vaccines. MMWR Recomm Rep. 2016;65:1–54. doi: 10.15585/mmwr.rr6505a1. [DOI] [PubMed] [Google Scholar]
Associated Data
This section collects any data citations, data availability statements, or supplementary materials included in this article.