

Abstract
Efficient protein production for industrial and academic purposes often involves engineering microorganisms to produce and secrete target proteins into the culture. Pseudomonas fluorescens has a TliDEF ATP-binding cassette transporter, a type I secretion system, which recognizes C-terminal LARD3 signal sequence of thermostable lipase TliA. Many proteins are secreted by TliDEF in vivo when recombined with LARD3, but there are still others that cannot be secreted by TliDEF even when LARD3 is attached. However, the factors that determine whether or not a recombinant protein can be secreted through TliDEF are still unknown. Here, we recombined LARD3 with several proteins and examined their secretion through TliDEF. We found that the proteins secreted via LARD3 are highly negatively charged with highly-acidic isoelectric points (pI) lower than 5.5. Attaching oligo-aspartate to lower the pI of negatively-charged recombinant proteins improved their secretion, and attaching oligo-arginine to negatively-charged proteins blocked their secretion by LARD3. In addition, negatively supercharged green fluorescent protein (GFP) showed improved secretion, whereas positively supercharged GFP did not secrete. These results disclosed that proteins' acidic pI and net negative charge are major factors that determine their secretion through TliDEF. Homology modeling for TliDEF revealed that TliD dimer forms evolutionarily-conserved positively-charged clusters in its pore and substrate entrance site, which also partially explains the pI dependence of the TliDEF-dependent secretions. In conclusion, lowering the isoelectric point improved LARD3-mediated protein secretion, both widening the range of protein targets for efficient production via secretion and signifying an important aspect of ABC transporter–mediated secretions.
Keywords: ABC transporter, membrane transport, protein secretion, protein translocation, recombinant protein expression, isoelectric point, membrane potential
Introduction
As demand grows for protein products in clinical, industrial, and academic applications, more methods are developed to achieve an efficient mass production of proteins from microorganisms (1–4). Some of these methods involve engineering microorganisms to produce and secrete target proteins into the culture broth, effectively removing the need to refold the proteins that are produced and to engage in intensive protein purification to isolate the target protein from cellular proteins (5, 6). Pseudomonas fluorescens, a Gram-negative bacterium, is considered one of the best candidates for protein-production engineering through secretion due to its generally non-pathogenic nature against humans (7) and resilience against fermenting conditions because it does not accumulate acetate (8).
P. fluorescens has an ATP-binding cassette (ABC)2 transporter, TliDEF, that belongs to the type I secretion system (T1SS). TliDEF is composed of three different protein multimers: TliD, TliE, and TliF, where TliD is an ABC; TliE is a membrane fusion protein; and TliF is an outer membrane factor. In wild-type P. fluorescens, TliDEF secretes thermostable lipase TliA and metalloprotease PrtA (9). In previous studies, the lipase ABC transporter recognition domain 3 (LARD3) on the C terminus of TliA was conjugated to recombinant proteins, namely green fluorescent protein (GFP) and epidermal growth factor (EGF) (10). These proteins were produced and effectively secreted out to the extracellular space when introduced into the P. fluorescens ΔtliA ΔprtA strain, with conjugated LARD3 to their C terminus.
Many proteins, including those mentioned above, were well-secreted when conjugated with LARD3, but other proteins were only localized in the cytoplasm. A key factor for this phenomenon remains to be determined. Is there any critical factor that determines whether or not a given signal-attached protein can be secreted by the ABC transporter? To investigate the difference between these proteins, we have conjugated various protein genes to LARD3 and introduced them to P. fluorescens. We analyzed both the supernatant and the cell pellet culture of various proteins to determine which proteins can be secreted, which proteins cannot, and what differences they have.
In this study, we took advantage of the pDART plasmid vector we developed in our previous study to conveniently attach LARD3 (11). The pDART plasmid has a multiple-cloning site (MCS) directly followed by an in-frame LARD3 gene. Thus, genes inserted into the multiple-cloning site of pDART are expressed with LARD3 attached to their C termini. These attached LARD3 sequences are recognized by the TliDEF ABC transporter, letting the recombinant protein be secreted by the TliDEF complex. pDART also includes a kanamycin resistance gene for clonal selection; broad host range origin of replication, which makes pDART a shuttle vector between Escherichia coli and P. fluorescens; and tliD, tliE, tliF genes that code and express the TliDEF complex.
Our next approach was to artificially decrease the pI values and add more negative charges to the recombinant polypeptides by adding an oligopeptide sequence to these proteins. To accomplish this task, we constructed two plasmids that attach the oligo-aspartate sequence to the cargo proteins. After the experiment, we constructed a plasmid that attaches arginine residues to examine the effects of adding positively charged amino acids to target proteins. Finally, we experimented with the secretion of supercharged variations of green fluorescent protein (GFP), developed in prior research (12), to see whether the supercharged versions of the protein exhibit a secretory behavior different from that of the original protein.
Results
Cross-analyzing the secretion of recombinant proteins and their pI
Thirteen genes (Table 1) that code for proteins of different sizes, flexibility, bulkiness, charges, etc. were introduced to P. fluorescens ΔtliA ΔprtA via pDART, where they are attached to a C-terminal LARD3 signal sequence. The supernatant and cell pellet were analyzed via Western blotting (Fig. 1). Mannanase, MBP, NKC-TliA, EglV, GFP, and thioredoxin were both detectable in the cell pellet and the supernatant, showing successful expression and secretion out to the extracellular media. However, MAP, cutinase, chitinase, capsid, Hsp40, and CTP-TliA were not detected in the supernatant despite being detected in the cell pellet, signifying that they were not secreted. These non-secreted proteins have a relatively high theoretical pI; all of them (with one exception, CTP-TliA) were above ∼5.5, being either positively or less negatively charged. In contrast, the secreted proteins were relatively acidic and highly negatively charged with a pI that does not exceed 5.5 (Fig. 2A and supplemental Table S1). Similarly intriguing, other reports of recombinant protein secretion through ABC transporters often, if not always, involve acidic, negatively-charged target proteins: mannanase (13), phospholipase A1,3 alkaline phosphatase (11), and epidermal growth factor (10). We also added the pI values of these proteins in Fig. 2A. The secretion of NKC-TliA and CTP-TliA decreased dramatically from that of original TliA (Figs. 1B and 2B). These are derivatives of TliA with an N-terminally attached short, extremely positively-charged sequence (supplemental section A). CTP-TliA was not secreted at all. Note that CTP has nine consecutive residues composed solely of arginine with only one exception, alanine (RRARRRRRR), as described in supplemental section A (14). Then, after quantification, the percentage of secreted protein versus the total amount of expressed protein was plotted. The obtained % secretion values were then plotted against the proteins' pI value (Fig. 2B). There seemed to be a weak negative correlation between protein pI and their secretion efficiency, but there were also a few exceptions.
Table 1.
List of proteins used in this study
This list of proteins and their original gene sources includes proteins that were not used in the experiments in this study but were secreted in our previous studies. Such proteins are marked with asterisks.
| Abbrev. | Full name | Source | Source type |
|---|---|---|---|
| TliA | Thermostable lipase A | P. fluorescens SIK-W1 | Genomic DNA |
| NKC-TliA | NKC-TliA | 40 | Synthesized |
| CTP-TliA | CTP-TliA | 14 | Synthesized |
| Mann | Mannanase | Bacillus subtilis | Plasmid |
| MAP | Mussel adhesion protein | MAP fp-151 | Synthesized |
| MBP | Maltose-binding protein | E. coli XL1-Blue | Genomic DNA |
| Trx | Thioredoxin | E. coli XL1-Blue | Genomic DNA |
| Cuti | Cutinase | Nectria haematococca | Plasmid |
| Chi | Chitinase | Bacillus thuringenesis | Plasmid |
| M37 | M37 lipase | Photobacterium lipolyticum | Plasmid |
| Cap | Capsid protein | Chaetoceros salsugineum DNA inclusion virus | Plasmid |
| Hsp40 | DnaJ chaperone | E. coli XL1-Blue | Genomic DNA |
| EglV | Endo-1,4-β-glucanase V | Trichoderma reesei QM6a | Total cDNA |
| GFP | Green fluorescent protein | pGFPuv (Clontech) | Plasmid |
| GFP(−30) | Negatively-supercharged GFP | 12 | Synthesized |
| GFP(+36) | Positively-supercharged GFP | 12 | Synthesized |
| EGF* | Epidermal growth factor | Homo sapiens | Plasmid |
| AP* | Alkaline phosphatase | E. coli XL1-Blue | Genomic DNA |
| PLA1* | Phospholipase A1 | Serracia marcescens | Plasmid |
Figure 1.

Secretion of selected proteins. A and B, Western blotting image showing the expression and secretion of the target proteins. The cell samples show the amount of the protein that remains in the cytoplasm, and the supernatant samples represent the amount of protein that is localized to the extracellular space. For comparison, equivalent amounts of cell extract and culture supernatant (16 μl) were loaded onto the gel and were analyzed via Western blotting. 50 ng of TliA was loaded in the middle of the gel as a reference. Two other Western blottings were obtained from different culture samples. All of the unpresented results exhibit similar patterns. Below the images, there are Western blottings of the same samples but with primary antibody against cytosolic Neo, the neomycin/kanamycin phosphotransferase 2 protein. The nonspecific lysis or leakage is minimal in all samples except capsid.
Figure 2.

Correlation between % secretion of the target proteins and their pI values. A, protein isoelectic point and secretion. The pI value of the target proteins is calculated from the sequence, including the attached LARD3, as provided in supplemental section A. The proteins that have not been secreted have their bars colored red. AP, EGF, and PLA1 are proven to be secreted in previous studies and are added in this figure. B, secretion percentage and pI. The percent secretion values were calculated by supernatant signal divided by the sum of supernatant and cell signals. Three different biological replicates (independent culture samples) of the experiment in Fig. 1 were used for the quantitative analysis. Two highly basic outlier proteins that were not secreted, MAP (pI = 9.61) and capsid (pI = 9.25), were excluded from the plot. There was a negative correlation between the protein pI and their % secretion.
Analysis of lunasin and its derivatives
Lunasin is an anticancer polypeptide from soybean Glycine max (15). It has a unique feature of nine consecutive aspartate sequences at its C terminus (16). We have constructed multiple derivatives of lunasin with different lengths of the oligo-aspartate tails. Lunasin and its derivatives were introduced to P. fluorescens via pDART, and their expression and secretion were observed via Western blotting (Fig. 3A). The original lunasin showed that the highest secretion and relative amount of secreted proteins declined as the length of the oligo-aspartate tail decreased. We have also observed decreased secretion and expression levels in lunnasin-D15 (lunnasin with 15 Asp at tail). Lunasin-D20 was not expressed in either the cell or supernatant. The exact sequence of the lunasin polypeptide and its derivatives is given in Fig. 3B. Based on this experiment, we determined that the optimal length of the oligo-aspartate sequence would be approximately nine, and we set up the experiments below.
Figure 3.
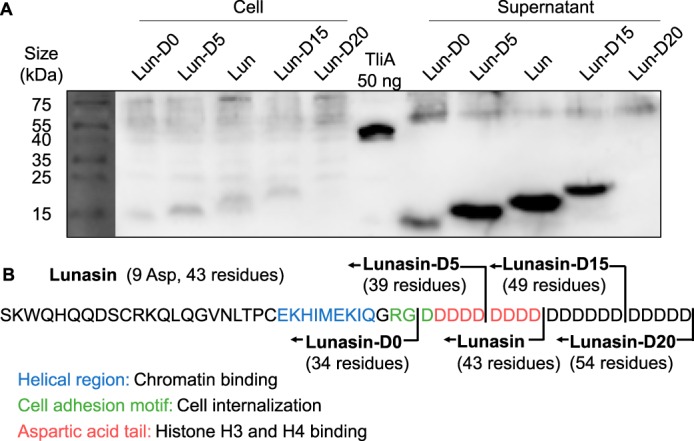
Secretion of lunasin and its derivatives. Lunasin and its derivatives with different lengths of oligo-aspartic acid tail were expressed and secreted via LARD3 attachment to determine the optimal length of the oligo-aspartic acid sequence in P. fluorescens expression and secretion system. A, expression of lunasin and its derivatives in the cell and supernatant was detected via Western blotting. 36-μl eq of cell extract and supernatant were loaded onto the gel and were analyzed via Western blotting. B, protein sequence and domain structure of lunasin and its derivatives whose length of the aspartic acid tail is modified. They were named as lunasin-D0, lunasin-D5, original lunasin (D9), lunasin-D15, and lunasin-D20.
Addition of aspartate oligomers, pFD10 and pBD10 construction
Among the 20 most common amino acids, aspartic acid has the lowest side chain pKa value (17). Inspired by the lunasin protein sequence, we developed two plasmids that add the oligo-aspartate sequence to the inserted proteins as well as the LARD3 signal sequence. We have synthesized an aspartate–decamer-coding DNA sequence (D10) based on the DNA sequence of the lunasin gene's oligo-aspartate tail. After the synthesis, we conjugated D10 to the pDART plasmid, creating two types of plasmid that either add D10 to the N terminus of the cargo polypeptide (pFD10) or to the C-terminal side (pBD10) of the MCS of pDART, where the target genes are inserted (Fig. 4). Then, selected proteins were inserted into both of the newly created plasmids, pFD10 and pBD10. These pFD10 or pBD10-cloned recombinant proteins were introduced to P. fluorescens alongside their pDART-cloned counterparts, and the secretion efficiency was analyzed via Western blot analysis.
Figure 4.
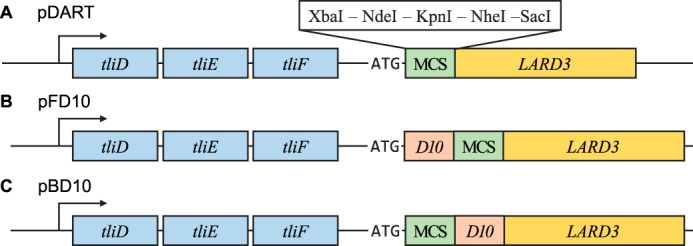
Structures of plasmids used. A, structure of the pDART plasmid near the MCS. tliD, tliE, tliF, and the LARD3-attached fusion protein are controlled in a single operon. MCS is directly followed by the LARD3 gene, and thus the inserted target gene is expressed with LARD3 attached on its C terminus. B, structure of pFD10 plasmid that attaches D10 sequence at the N terminus. The D10 gene directly follows the start codon and is located right before the MCS and LARD3. C, structure of the pBD10 plasmid, which attaches D10 sequence at the C-terminal side, but before LARD3. The D10 gene is located between the MCS and LARD3.
Insertion of TliA-derived recombinant proteins into pFD10 and pBD10
NKC-TliA and CTP-TliA are both derivatives of TliA, each with an N-terminal basic-peptide attachment. Their secretion efficiency through TliDEF is significantly smaller than wild-type TliA (Fig. 1A and supplemental Fig. S1). However, the oligo-aspartate attachment on them by pFD10 or pBD10 greatly re-increases their secretion. In terms of the secretion ratio (secreted protein versus intracellular protein), NKC-TliA shows a dramatic increase in secretion after the addition of either an upstream or downstream D10 sequence (Fig. 5, A and B). CTP-TliA also shows a drastic increase in secretion in both the Western blotting and activity plate assays when a downstream D10 sequence was added by pBD10 (Fig. 5, C and D). In enzyme plate activity assays, the halo sizes of NKC-TliA and CTP-TliA in pDART or pBD10 are generally consistent with the band strength of the supernatant samples in their respective Western blotting results. However, pFD10 has a slightly smaller halo than expected from their band strength, indicating the possibility of a reduced enzymatic activity.
Figure 5.
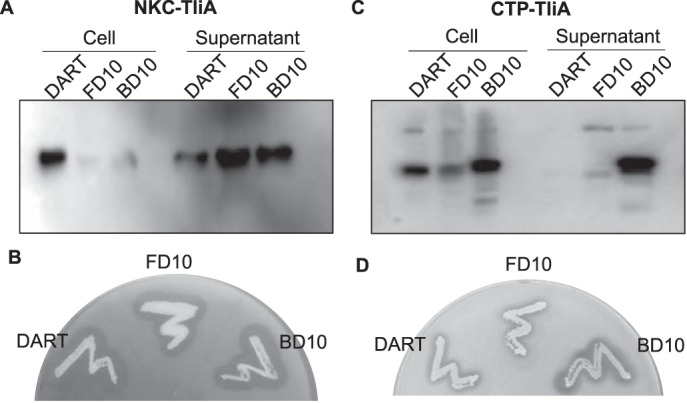
Expression of TliA derivatives in pFD10 and pBD10. A, Western blot of NKC-TliA in pFD10 and pBD10. The Western blottings were performed in a manner identical to that of the previous figures. Secretion strongly improved in both pFD10 and pBD10 when compared with pDART. B, enzyme plate assay of NKC-TliA in different plasmids. C, Western blot of CTP-TliA in pFD10 and pBD10. Secretion strongly increased in pBD10. D, enzyme plate assay of CTP-TliA in different plasmids. pBD10 exhibits a major increase in secretion. Two other Western blot results were obtained from different culture samples, and both of them exhibit similar patterns. Two other enzyme plate assays were obtained from different colonies, and both of them exhibit similar patterns.
Insertion of negatively-charged proteins to pFD10 and pBD10
Genes for GFP, mannanase, MBP, and Trx were introduced to pDART, pFD10, and pBD10. The resulting recombinant plasmids were used to transform P. fluorescens ΔtliA ΔprtA, where the genes were expressed, and the produced proteins were secreted by the TliDEF transporter. GFP showed the most dramatic increase. A comparison of the band strength of pDART and pBD10-inserted GFP showed a remarkable change in the supernatant versus cell expression ratio. pFD10-GFP also exhibited some improvement in terms of the ratio between the supernatant and the cell pellet (Fig. 6A). The case of mannanase was somewhat vague, but we could conclude that pBD10-mannanase exhibits a better secretion than pDART-mannanase. Although the absolute expression itself decreased, there was a small improvement in the ratio when an upstream D10 sequence was added by pFD10 (Fig. 6B). The secretion of MBP improved in both pFD10 and pBD10 in terms of the supernatant/cell ratio, compared with pDART (Fig. 6C). In the case of Trx, the supernatant/cell ratio improved in pFD10 and pBD10 (Fig. 6D).
Figure 6.
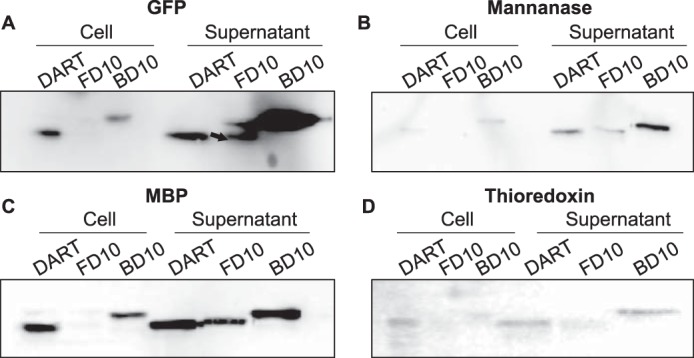
Secretion of negatively-charged proteins in pFD10 and pBD10. Western blottings were performed in a manner identical to that in the previous figures. A, Western blot of GFP. Both pFD10 and pBD10 exhibit an increase in protein secretion in the supernatant. B, Western blot of mannanase. Both pFD10 and pBD10 exhibit slight increases in mannase secretion. C, Western blot of MBP. The increased secretion ratio was observed in both pFD10 and pBD10. D, Western blot of thioredoxin. The signals were weak overall, but there was an increase in the secretion for both pFD10 and pBD10. Overall, the bands of more negatively-charged proteins in pBD10 appeared in slightly upward-shifted positions. Three other Western blot results for pDART and pBD10 were from different culture samples were obtained, whereas there were two other Western blot results for pDART and pFD10. All of them exhibit similar patterns.
Addition of positively charged amino acid oligomers, construction and analysis of pBR10
We constructed an additional plasmid that closely resembles pBD10, but with one difference: the D10 sequence, the DNA sequence that codes for aspartate oligomer, was replaced with R10 (codes for arginine oligomer). We inserted the TliA and GFP gene to pDART, pBD10, and pBR10 plasmids and examined their secretion by enzyme plate assay (TliA only) and Western blotting (Fig. 7). In Western blotting of TliA, pDART and pBD10 exhibited good secretion efficiency. pBR10, however, blocked the secretion (Fig. 7A). Similar patterns were observed in enzyme plate assay; pBR10 did not exhibit halo, but the others did (Fig. 7B). In Western blotting of GFP, both pDART and pBD10 exhibited secretion. Yet again, pBR10 blocked secretion of GFP as it did to TliA (Fig. 7C).
Figure 7.
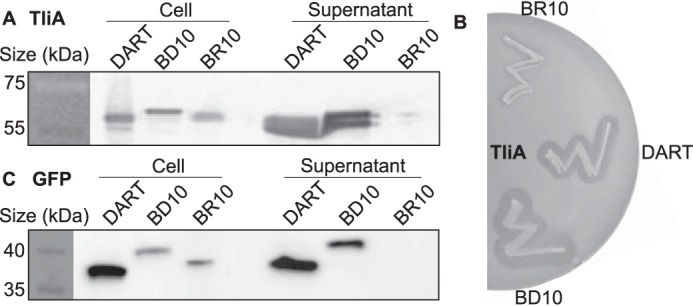
Secretion of TliA and GFP in pDART, pBD10, and pBR10. Two negatively-charged proteins, TliA and GFP, were inserted in the plasmids that attach nothing except the signal sequence (pDART), oligo-aspartate (pBD10), and oligo-arginine (pBR10). A, Western blot of TliA in these plasmids. TliA in pDART and pBD10 shows good secretion. However, the secretion was blocked when R10 was attached. B, enzyme plate assay of TliA in these plasmids. Secretion of TliA was blocked when it was inserted to pBR10. C, Western blot of GFP in these plasmids. Similarly, pDART and pBD10 showed good secretion, although secretion was blocked when R10 was attached.
Western blot analysis of supercharged proteins
GFP and its two supercharged derivatives, GFP (−30) and GFP (+36), were recombined with LARD3 and introduced to P. fluorescens ΔtliA ΔprtA. The samples were analyzed via Western blotting (Fig. 8). Both GFP and GFP (−30) were detected in the cell pellet and the supernatant, indicating that they were effectively expressed and secreted to the extracellular space. Note that GFP (−30) was more strongly localized to the supernatant than the original GFP. In contrast, GFP (+36) is heavily expressed but localized in the cell pellet and is not secreted to the extracellular space. The pI values for these recombinant proteins are 4.64 for GFP (−30), 5.36 for unmodified GFP, and 10.42 for GFP (+36).
Figure 8.
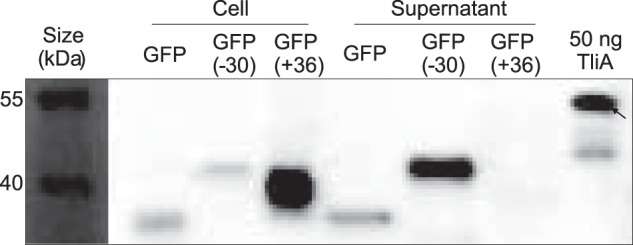
Secretion of GFP and supercharged GFPs. Western blotting was carried out in a manner identical to that of the previous figures. GFP(−30) exhibited a much higher secretion ratio than the original GFP, whereas GFP(+36) was not secreted at all despite its high expression. Note that the bands of the supercharged GFPs are also slightly shifted upwards. Two other Western blot results from different culture samples were obtained, and both of them exhibit similar patterns.
Discussion
Altogether, these results indicate that the secretion rate is higher in more negatively-charged proteins in the TliDEF ABC transporter. There was a qualitative correlation between the protein pI value and whether it could be secreted by the TliDEF ABC transporter; highly-acidic and negatively-charged proteins were secreted by the TliDEF ABC transporter, whereas proteins with a less negative charge and higher pI value were hardly secreted. This finding is also consistent with the meta-analysis by Delepelaire, which states that the proteins naturally transported by the ABC transporters are very acidic, “all of them are (with only one exception) very acidic proteins with pI around 4”, at least for the proteins he had meta-analyzed (18).
When the genes were introduced to pFD10, some proteins exhibited an increased secretion. But in general, their expressions tended to be reduced relative to pDART. This may be due to a reduction in mRNA stability or translation rate due to alterations in its secondary structure. In addition, the target genes that were inserted into pFD10 were expressed with D10 immediately following the start codon methionine, with an extremely negatively charged N-terminal region. This may reduce the protein half-life if they are targeted by cellular degradation mechanisms. For pBD10, this is not the case because the D10 sequence was followed by LARD3, and thus the charged region is not located at the terminus in translations of pBD10 (Fig. 4C). More specific reasons are not yet understood.
The combined results of the pFD10, pBD10 experiments, and secretion patterns of supercharged proteins indicate that proteins engineered to carry more negative charges are secreted better. We expect that this reduces the energy required to overcome the electric potential energy barrier between the cytoplasm and the extracellular space. In general, Gram-negative bacteria maintain an inner membrane potential that is roughly around −150 mV, with the cytoplasmic side more negatively charged than the periplasmic space (19, 20). This polarized charge distribution is maintained by various cellular mechanisms, including active proton transport across the membranes. The outer membrane potential is also negative, with the periplasm being more negatively charged than the extracellular space due to negatively-charged membrane-derived oligosaccharides that are localized there (21). However, the magnitude is significantly smaller, typically less than −30 mV, due to the pore-rich nature of the outer membrane (22, 23). Considering all these facts, it is energetically more favorable to secrete highly negatively-charged proteins, affecting the general equilibrium of secretion. The significance of the membrane potential on the protein alignment has already been studied in many previous studies; charged residues determine the orientation of the polypeptide during the interaction with the membrane and affect protein translocation through membrane (24–26). As seen from these biological phenomena, the membrane potential is quite powerful at the biochemical level, and it has a significant impact on the change in free energy during translocation through ABC transporters. Moving a polypeptide across the inner membrane with a −150-mV potential requires an energy of ∼3.5 kcal/mol per charge that the polypeptide carries. The calculation under constant pressure, temperature, and concentration is presented in Equation 1,
| (Eq. 1) |
where n is the total charge of the polypeptide, and F is the Faraday constant. Thus, if a protein has 10 positive net charges (n = +10), then w = +35 kcal/mol and secretion becomes that much more unfavorable. A typical change in free energy (ΔG) during ATP hydrolysis under in vivo concentrations is −11.4 kcal/mol (27). The models suggested for the ABC transporter mechanism indicate that the ABC protein operates through continuous switching between the “inward-facing” and “outward-facing” conformation coupled to ATP hydrolysis (28, 29). According to this model, one of the major forces that drive translocation in ABC transporters is the force of this “power stroke” (30). The negative membrane potential applies an electrostatic force that either helps (for negative charges) or opposes (for positives charges) the force created by this power stroke, kinetically accelerating or hampering the translocation process and ultimately affecting the secretion equilibrium.
This “membrane potential” hypothesis is further supported by a number of previous studies spanning various secretion types. A positive-charge inducing mutation on an E. coli lipoprotein is reported to have reduced its secretion by interrupting its folding near the membrane in both prokaryotes and eukaryotes (31, 32). Either neutralizing or reversing the net negative charge of the passenger domain of E. coli autotransporter (type Va secretion system) halts the transportation across the outer membrane that also has an “inside-negative” charge configuration across the membrane (33).
The other factor to consider is the charge state of TliD. TliD is the ABC protein, the inner membrane component, of the TliDEF transporter. It carries a nucleotide-binding domain (NBD) and a transmembrane domain (TMD), connected by a short inter-domain sequence (9). It is interesting that the TliD ABC protein has an extremely high theoretical pI value, especially around the TMD (pI 9.43) and inter-domain sequences (pI 8.14). Subsequent homology structural modeling of dimeric TliD, with Aquifex aeolicus PrtD (PDB code 5l22) (34) as a template (sequence identity 40.98%), revealed that it has positive charge distribution at the midpoint of its channel's inner surface (Fig. 9, A and B). Moreover, a ConSurf homolog conservation analysis on TliD showed that these charges were indeed conserved, forming a positively charged sub-region at the midpoint of the channel (Fig. 9, C and D, yellow circles). In addition, on the kinked helix on the substrate entry window, there is a positively-charged residue that sticks out toward the pore of the window and blocks the window in ADP-bound state of TliD (34). The ConSurf results also verified that this residue was charge-conserved, as all of the 50 homologs had either arginine or lysine at this residue (Fig. 9C, black arrow). We expect that this positively-charged inner surface interacts with negatively-charged residues during protein transport, facilitating secretion (Fig. 9E). Also, the positive charges in the inner surface of the channel and on the substrate entry window may repel positively-charged sections of polypeptides, blocking them from entering the channel and ultimately from being secreted, as can be seen from the results of oligo-arginine attachment. Here, we assumed that the cargo proteins unfolds (at least partially) during transport because the pore size of TliF, which is expected to have a very similar structure to E. coli TolC (PDB code 1tqq), has average interior diameter of 19.8 Å (35). This is apparently smaller than 20–30 Å, which is the average diameter of most globular proteins, including 24 Å of GFP's barrel (36). TliF contains a relatively rigid β-barrel transmembrane structure, which means it is unlikely that it expands during transport.
Figure 9.

Charge distribution in the structure of TliD, the ABC protein of the TliDEF complex. A, electron repulsion surface of the TliD monomer. Colored according to its surface electric potential, from blue (+7 kBT/e) to red (−7 kBT/e). The inner surface of the central channel is circled yellow. Note that the circled inner surface is highly positively charged. B, TliD homodimer, with one of the monomers presented in the ribbon model. Substrate entry window is circled green. C, TliD, residues with conserved positive or negative charges are colored blue and red, respectively. The conserved positive charge cluster at the midpoint of the channel's inner surface are circled yellow. The two α-helices that form substrate entry window are colored green. Among the two conserved positively-charged residues, Arg-316 (black arrow) sticks out to the pore. D, TliD dimer, seen from the periplasmic face. Positive charges are located in the middle of the channel (circled yellow), whereas negative charges are outside of the channel. E, schematic model of the TliD dimer, transporting a highly negatively charged recombinant polypeptide with the attached LARD3. The NBD and TMD of TliD are labeled accordingly. Note that the electric potential across the inner membrane (IM) is −150 mV, where the cytoplasm (CP) is more negative than the periplasm (PP). This potential difference also makes it more favorable to outward-transport negatively-charged proteins than positively-charged proteins. F, sequence mapping of the structures in C and D. Residues with high Bayesian conservation score (≥7) are highlighted in gray. Among them, the charged residues are colored as blue (+ charged) and red (− charged). Green and yellow boxes represent the substrate entry window and the channel's inner surface, respectively.
Other ABC transporters, although their structures are not yet fully understood, have similarly positively-charged TMD in their ABC proteins. The E. coli hemolysin transporter, HlyB–HlyD–TolC complex, also has a similar charge distribution with a significantly positive charge on the TMD of its ABC protein, HlyB, which is functionally homologous to TliD. The same is true for Dickeya dadantii PrtD. Along with the previously reported meta-analysis mentioned above (18), this fact strongly supports the charge dependence of the T1SS ABC transporter secretion mechanism.
In conclusion, only highly acidic proteins were capable of being transported through the ABC transporter. Either basic or only slightly acidic proteins could not be secreted through the ABC transporter. However, the secretion of recombinant proteins can improve when their pI value is artificially lowered through oligo-aspartate attachment or by negatively supercharging them. This result suggests that through simple pI inspection, it is possible to determine whether a protein of interest could be secreted by ABC transporters. Also, it is possible to increase the protein secretion by altering their charge, which can ultimately widen the range of targets to efficiently produce proteins via ABC transporter-dependent secretion.
Experimental procedures
Bacterial strains and growth media
Plasmid construction and genetic modifications were performed in E. coli XL1-BLUE. Protein expression and secretion were observed in the P. fluorescens ΔtliA ΔprtA strain, which is a double-deletion derivative of P. fluorescens SIK-W1 (37). Microorganisms were cultured in lysogeny broth (LB) with 30 μg/ml kanamycin. An enzyme plate assay for the target genes with lipase activity (TliA, NKC-TliA, and CTP-TliA) was prepared with LB agar containing blender-mixed 0.5% colloidal glyceryl tributyrate. E. coli and P. fluorescens were incubated at 37 and 25 °C, respectively. E. coli transformation was performed following the standard heat-shock method, and P. fluorescens transformation was performed via electroporation at 2.5 kV, 125 ohms, and 50 microfarads, with electrocompetent cells prepared using a standard electroporation protocol (38). The transformed P. fluorescens were cultured in test tubes with 5 ml of liquid LB media, including 60 μg/ml kanamycin, and were incubated at 25 °C in an 180 rpm shaking incubator until the stationary phase was reached. The proteins were analyzed for both expression and secretion by seeding the transformed cells in liquid LB or streaking them on the solid-plate activity assay.
Plasmid vector constructions
Plasmid pDART was used for the secretory production of different proteins (11). Plasmid vectors pFD10 and pBD10 were derivatives of pDART, constructed by adding codons for 10 aspartic acid residues to the target proteins in either the upstream or downstream position of MCS. The DNA sequence for 10 aspartic acids was amplified via PCR using synthesized G. max lunasin gene (15) as a template. Two different PCR products were obtained, each for pFD10 and pBD10. One or two arbitrary bases are inserted upstream or downstream of the primers to keep the translation in-frame, causing a slight size and pI difference between the pFD10- and pBD10-inserted proteins. Recombining the PCR product with pDART to construct pFD10 and pBD10 was accomplished with an In-Fusion cloning kit (Clontech In-Fusion HD cloning plus CE). To linearize pDART, it was digested with either XbaI (for pFD10 construction) or SacI (for pBD10). Then, the linearized pDART and the corresponding PCR products were digested with In-Fusion 3′-to-5′-exodeoxyribonuclease and re-ligated following the standard protocol of the In-Fusion kit. Ligation of these DNA fragments with complementary ∼15-base 5′-overhangs resulted in pFD10 and pBD10 plasmid, ready for target gene insertions. pDART, pFD10, and pBD10 sequences near their MCSs are provided in supplemental section A.
Construction of plasmids with inserted target genes
Thirteen target genes were selected for pDART insertion. The full names and sources of these proteins are provided in Table 1. The genes were amplified with PCR from extracted genomic DNA samples (TliA, MBP, Trx, and Hsp40), total cDNA (EglV), synthesized DNA products (NKC-TliA, CTP-TliA, MAP, lunasin, lunasin derivatives, GFP, and supercharged GFPs), or plasmids (other proteins), respectively. N-terminal signal peptides were detected with the SignalP 4.1 web-based prediction algorithm (http://www.cbs.dtu.dk/services/SignalP/)4 (39) and were excluded from secretory production in pDART, pFD10, or pBD10. For synthetic genes, the codons were optimized for either E. coli expression (supercharged GFPs) or P. fluorescens expression (TliA derivatives).
The lunasin gene was synthesized and amplified with PCR for pDART insertion. With various primers, we also synthesized its variations with differing lengths of the oligo-Asp sequence at their C terminus: lunasin-D0, lunasin-D5, lunasin-D15, and lunasin-D20 (Fig. 3B). These sequences were recombined with pDART for secretory production. NKC-TliA and CTP-TliA are derivatives of TliA. NKC is an antibiotic polypeptide developed in a previous study (40), and CTP is a cytoplasmic transduction peptide that was developed as a cellular import tag in a previous study (14). We have synthesized genes for these two, with codons optimized for P. fluorescens expression.
The supercharged variations of GFP, including negatively supercharged GFP(−30) and positively supercharged GFP(+36), were previously developed by replacing solvent-exposed residues of GFP with negatively or positively charged amino acids, respectively (12). We have completely synthesized genes that code for these two supercharged proteins, with codons optimized for E. coli expression.
The primers we used for PCR had restriction enzyme sites that were utilized to insert the target genes to the MCSs of the plasmids: pDART, pFD10, and pBD10. The PCR products and plasmid vectors were double-digested with two restriction enzymes for XbaI, KpnI, SacI, and SpeI (which is compatible with XbaI). The specific pair of enzymes used on each gene can be directly identified from the full sequences provided insupplemental section A. Then, they were ligated with T4 ligase. The constructed plasmids were then introduced into E. coli for cloning, and the cloned plasmids were first obtained using a standard plasmid purification method. The purified plasmids were then introduced to P. fluorescens, for which expression and secretion were analyzed.
Western blotting conditions
After 48 h of cell growth (secretion occurs during the entire growth), the liquid culture reached stationary growth phase, and the cell density reached ∼1.5 × 10⁹ cells/ml (A600 = ∼3). 400 μl of the liquid cultures were taken and centrifuged at 18,000 relative centrifugal force for 10 min to separate the supernatant and the cell pellet. 16 μl of culture (∼0.048 OD) equivalents of the cell pellet extract and supernatant were each loaded onto 10% polyacrylamide gels. SDS-PAGE was used to separate the proteins according to their sizes. Then, the proteins were transferred to a nitrocellulose membrane (Amersham Biosciences) for Western blotting. Polyclonal anti-LARD3 rabbit immunoglobulin G (IgG) and anti-neomycin phosphotransferase 2 (Abcam, ab33595) were utilized as the primary antibody with 1:3000 and 1:500 dilution each, and anti-rabbit recombinant goat IgG-peroxidase (anti-rIgG goat IgG-peroxidase) was used as the secondary antibody with 1:1000 dilution. The bands were then detected using a chemiluminescence agent (Advansta WesternBright Pico). Western blotting images were acquired using an Azure C600 automatic detecting system. All included Western blotting images are representative results from at least three different repeated experiments, starting over again from cell culturing with independent P. fluorescens colonies. After the images were obtained, we quantified the results of experiment 1 (Fig. 1) with ImageJ software. We calculated % secretion of the target proteins of this experiment. The % secretion was calculated as Equation 2,
| (Eq. 2) |
where S is the normalized signal strength of each bands in the Western blotting image, and the subscripts denote the sample type of the lanes.
Computational analysis of polypeptide properties and protein structure
The theoretical pI values of the target proteins were calculated using the ExPASy Compute pI/Mw tool (41–43). The entire sequences were used, and LARD3 and any additional sequences from the enzyme sites were included in the sequences for this purpose. The protein pI values are highly correlated with their charge per residue, and the correlation analysis of the protein pI values and their charge per residue is included in supplemental Fig. S2. SWISS-MODEL structural homology modeling (https://swissmodel.expasy.org/)4 was used to study the ABC transporter protein structures (44–47). We used A. aeolicus PrtD (PDB code 5l22) (34) as a template, with sequence identity of 40.98%. Sequence alignment between TliD and the template is provided in supplemental Fig. S3. The model's transmembrane helices were verified by DAS-TMfilter (http://mendel.imp.ac.at/sat/DAS/)4 (48), and the results are provided in supplemental Fig. S4. The surface of the obtained 3D model was calculated and colored with Swiss PdbViewer (spdbv) (http://spdbv.vital-it.ch/).4 We used the ConSurf web server (http://consurf.tau.ac.il/2016/)4 to compare TliD with its homologs and to verify the structure prediction of TliD (49, 50). Specific parameters we put for the homolog searching are provided in supplemental material. The ConSurf homology analysis also approved our structural prediction in a sense that most of the transmembrane helices were highly conserved in the inner surface-facing residues; supplemental Fig. S5 contains further information on the conserved residues of TliD. Finally, we checked side-chain pKa values of the highly conserved arginine and lysine residues at the potentially important positions (Fig. 9, C, D and F) with the web-based PDB 2PQR server (http://nbcr-222.ucsd.edu/pdb2pqr_2.0.0/),4 using the predicted structure as an input. We visualized the results with the PyMOL software. All sequences that were used for the analysis are provided in supplemental section A.
Author contributions
J. H. A. conceived and coordinated the study. H. B. and J. P. designed and performed the experiments. H. B. wrote most of the paper. S. C. K. proposed target gene selections and provided key intellectual contents. All authors analyzed the results and approved the final version of the manuscript.
Supplementary Material
Acknowledgments
We are very grateful to J. K. Song, C. S. Kwon, and H. Kim for their critical review of this manuscript.
This work was supported by the Intelligent Synthetic Biology Center of the Global Frontier Project; URP Program of the Korea Advanced Institute of Science and Technology; and the R&E Program of the Republic of Korea Ministry of Science, ICT and Future Planning. The authors declare that they have no conflicts of interest with the contents of this article.
This article contains supplemental Figs. S1–S5, Table S1, and Section A.
J. Park, J. Y. Oh, J. H. Park, S. C. Kim, J. K. Song, and J. H. Ahn, submitted for publication.
Please note that the JBC is not responsible for the long-term archiving and maintenance of this site or any other third party hosted site.
- ABC
- ATP-binding cassette
- T1SS
- type I secretion system
- MCS
- multiple-cloning site
- PDB
- Protein Data Bank
- Trx
- thioredoxin
- NBD
- nucleotide-binding domain
- TMD
- transmembrane domain
- MBP
- maltose-binding protein
- MAP
- mussel adhesion protein.
References
- 1. Wurm F. M. (2004) Production of recombinant protein therapeutics in cultivated mammalian cells. Nat. Biotechnol. 22, 1393–1398 [DOI] [PubMed] [Google Scholar]
- 2. Demain A. L., and Vaishnav P. (2009) Production of recombinant proteins by microbes and higher organisms. Biotechnol. Adv. 27, 297–306 [DOI] [PubMed] [Google Scholar]
- 3. Vlieghe P., Lisowski V., Martinez J., and Khrestchatisky M. (2010) Synthetic therapeutic peptides: science and market. Drug Discov. Today 15, 40–56 [DOI] [PubMed] [Google Scholar]
- 4. Huang C.-J., Lin H., and Yang X. (2012) Industrial production of recombinant therapeutics in Escherichia coli and its recent advancements. J. Ind. Microbiol. Biotechnol. 39, 383–399 [DOI] [PubMed] [Google Scholar]
- 5. Choi J. H., and Lee S. Y. (2004) Secretory and extracellular production of recombinant proteins using Escherichia coli. Appl. Microbiol. Biotechnol. 64, 625–635 [DOI] [PubMed] [Google Scholar]
- 6. Chen R. (2012) Bacterial expression systems for recombinant protein production: E. coli and beyond. Biotechnol. Adv. 30, 1102–1107 [DOI] [PubMed] [Google Scholar]
- 7. Von Graevenitz A., and Weinstein J. (1971) Pathogenic significance of Pseudomonas fluorescens and Pseudomonas putida. Yale J. Biol. Med. 44, 265–273 [PMC free article] [PubMed] [Google Scholar]
- 8. Squires C. H., Retallack D. M., Chew L. C., Ramseier T. M., Schneider J. C., and Talbot H. W. (2004) Heterologous protein production in P. fluorescens. BioProcesss Int. 2004, 54–58 [Google Scholar]
- 9. Ahn J. H., Pan J. G., and Rhee J. S. (1999) Identification of the tliDEF ABC transporter specific for lipase in Pseudomonas fluorescens SIK W1. J. Bacteriol. 181, 1847–1852 [DOI] [PMC free article] [PubMed] [Google Scholar]
- 10. Park Y., Moon Y., Ryoo J., Kim N., Cho H., and Ahn J. H. (2012) Identification of the minimal region in lipase ABC transporter recognition domain of Pseudomonas fluorescens for secretion and fluorescence of green fluorescent protein. Microb. Cell Fact. 11, 60. [DOI] [PMC free article] [PubMed] [Google Scholar]
- 11. Ryu J., Lee U., Park J., Yoo D. H., and Ahn J. H. (2015) A vector system for ABC transporter-mediated secretion and purification of recombinant proteins in Pseudomonas species. Appl. Environ. Microbiol. 81, 1744–1753 [DOI] [PMC free article] [PubMed] [Google Scholar]
- 12. Lawrence M. S., Phillips K. J., and Liu D. R. (2007) Supercharging proteins can impart unusual resilience. J. Am. Chem. Soc. 129, 10110–10112 [DOI] [PMC free article] [PubMed] [Google Scholar]
- 13. Eom G. T., Oh J. Y., Park J. H., Jegal J., and Song J. K. (2016) Secretory production of enzymatically active endo-β-1,4-mannanase from Bacillus subtilis by ABC exporter in Escherichia coli. Process Biochemistry 51, 999–1005 [Google Scholar]
- 14. Kim D., Jeon C., Kim J.-H., Kim M.-S., Yoon C.-H., Choi I.-S., Kim S.-H., and Bae Y.-S. (2006) Cytoplasmic transduction peptide (CTP): New approach for the delivery of biomolecules into cytoplasm in vitro and in vivo. Exp. Cell Res. 312, 1277–1288 [DOI] [PubMed] [Google Scholar]
- 15. Galvez A. F., Chen N., Macasieb J., and de Lumen B. O. (2001) Chemopreventive property of a soybean peptide (Lunasin) that binds to deacetylated histones and inhibits acetylation. Cancer Res. 61, 7473–7478 [PubMed] [Google Scholar]
- 16. Odani S., Koide T., and Ono T. (1987) Amino acid sequence of a soybean (Glycine max) seed polypeptide having a poly(l-aspartic acid) structure. J. Biol. Chem. 262, 10502–10505 [PubMed] [Google Scholar]
- 17. Mathews C. K., Van Holde K. E., Appling D. R., and Anthony-Cahill S. J. (eds) (2013) Biochemistry, 4th Ed., p. 138, Pearson, Toronto, Canada [Google Scholar]
- 18. Delepelaire P. (2004) Type I secretion in gram-negative bacteria. Biochim. Biophys. Acta 1694, 149–161 [DOI] [PubMed] [Google Scholar]
- 19. Damper P. D., and Epstein W. (1981) Role of the membrane potential in bacterial resistance to aminoglycoside antibiotics. Antimicrob. Agents Chemother. 20, 803–808 [DOI] [PMC free article] [PubMed] [Google Scholar]
- 20. Novo D., Perlmutter N. G., Hunt R. H., and Shapiro H. M. (1999) Accurate flow cytometric membrane potential measurement in bacteria using diethyloxacarbocyanine and a ratiometric technique. Cytometry 35, 55–63 [DOI] [PubMed] [Google Scholar]
- 21. Kennedy E. P. (1982) Osmotic regulation and the biosynthesis of membrane-derived oligosaccharides in Escherichia coli. Proc. Natl. Acad. Sci. U.S.A. 79, 1092–1095 [DOI] [PMC free article] [PubMed] [Google Scholar]
- 22. Nikaido H. (2003) Molecular basis of bacterial outer membrane permeability revisited. Microbiol. Mol. Biol. Rev. 67, 593–656 [DOI] [PMC free article] [PubMed] [Google Scholar]
- 23. Sen K., Hellman J., and Nikaido H. (1988) Porin channels in intact cells of Escherichia coli are not affected by Donnan potentials across the outer membrane. J. Biol. Chem. 263, 1182–1187 [PubMed] [Google Scholar]
- 24. Cao G., Kuhn A., and Dalbey R. E. (1995) The translocation of negatively-charged residues across the membrane is driven by the electrochemical potential: evidence for an electrophoresis-like membrane transfer mechanism. EMBO J. 14, 866–875 [DOI] [PMC free article] [PubMed] [Google Scholar]
- 25. Harley C. A., and Tipper D. J. (1996) The role of charged residues in determining transmembrane protein insertion orientation in yeast. J. Biol. Chem. 271, 24625–24633 [DOI] [PubMed] [Google Scholar]
- 26. Seppälä S., Slusky J. S., Lloris-Garcerá P., Rapp M., and von Heijne G. (2010) Control of membrane protein topology by a single C-terminal residue. Science 328, 1698–1700 [DOI] [PubMed] [Google Scholar]
- 27. Tran Q. H., and Unden G. (1998) Changes in the proton potential and the cellular energetics of Escherichia coli during growth by aerobic and anaerobic respiration or by fermentation. Eur. J. Biochem. 251, 538–543 [DOI] [PubMed] [Google Scholar]
- 28. Oldham M. L., Davidson A. L., and Chen J. (2008) Structural insights into ABC transporter mechanism. Curr. Opin. Struct. Biol. 18, 726–733 [DOI] [PMC free article] [PubMed] [Google Scholar]
- 29. Locher K. P. (2009) Structure and mechanism of ATP-binding cassette transporters. Philos. Trans. R. Soc. B Biol. Sci. 364, 239–245 [DOI] [PMC free article] [PubMed] [Google Scholar]
- 30. Mishra S., Verhalen B., Stein R. A., Wen P.-C., Tajkhorshid E., and Mchaourab H. S. (2014) Conformational dynamics of the nucleotide binding domains and the power stroke of a heterodimeric ABC transporter. eLife 3, e02740. [DOI] [PMC free article] [PubMed] [Google Scholar]
- 31. Yamane K., and Mizushima S. (1988) Introduction of basic amino acid residues after the signal peptide inhibits protein translocation across the cytoplasmic membrane of Escherichia coli. Relation to the orientation of membrane proteins. J. Biol. Chem. 263, 19690–19696 [PubMed] [Google Scholar]
- 32. Kohara A., Yamamoto Y., and Kikuchi M. (1991) Alteration of N-terminal residues of mature human lysozyme affects its secretion in yeast and translocation into canine microsomal vesicles. J. Biol. Chem. 266, 20363–20368 [PubMed] [Google Scholar]
- 33. Kang'ethe W., and Bernstein H. D. (2013) Charge-dependent secretion of an intrinsically disordered protein via the autotransporter pathway. Proc. Natl. Acad. Sci. U.S.A. 110, E4246–E4255 [DOI] [PMC free article] [PubMed] [Google Scholar]
- 34. Morgan J. L., Acheson J. F., and Zimmer J. (2017) Structure of a Type-1 secretion system ABC transporter. Structure 25, 522–529 [DOI] [PubMed] [Google Scholar]
- 35. Higgins M. K., Eswaran J., Edwards P., Schertler G. F., Hughes C., and Koronakis V. (2004) Structure of the ligand-blocked periplasmic entrance of the bacterial multidrug efflux protein TolC. J. Mol. Biol. 342, 697–702 [DOI] [PubMed] [Google Scholar]
- 36. Hink M. A., Griep R. A., Borst J. W., van Hoek A., Eppink M. H., Schots A., and Visser A. J. (2000) Structural dynamics of green fluorescent protein alone and fused with a single chain Fv protein. J. Biol. Chem. 275, 17556–17560 [DOI] [PubMed] [Google Scholar]
- 37. Son M., Moon Y., Oh M. J., Han S. B., Park K. H., Kim J. G., and Ahn J. H. (2012) Lipase and protease double-deletion mutant of Pseudomonas fluorescens suitable for extracellular protein production. Appl. Environ. Microbiol. 78, 8454–8462 [DOI] [PMC free article] [PubMed] [Google Scholar]
- 38. Seidman C. E., Struhl K., Sheen J., and Jessen T. (1987) in Current Protocols in Molecular Biology (Ausubel M. F., Brent R., Kingston R. E., Moore D. D., Seidman J. A., and Struhl K., eds) Vol. 1, Section 1.8.4, John Wiley & Sons, Inc., New York [Google Scholar]
- 39. Petersen T. N., Brunak S., von Heijne G., and Nielsen H. (2011) SignalP 4.0: discriminating signal peptides from transmembrane regions. Nat. Methods 8, 785–786 [DOI] [PubMed] [Google Scholar]
- 40. Yang K. S., Sung B. H., Park M. K., Lee J. H., Lim K. J., Park S. C., Kim S. J., Kim H. K., Sohn J.-H., Kim H. M., and Kim S. C. (2015) Recombinant lipase engineered with amphipathic and coiled-coil peptides. ACS Catalysis 5, 5016–5025 [Google Scholar]
- 41. Bjellqvist B., Hughes G. J., Pasquali C., Paquet N., Ravier F., Sanchez J. C., Frutiger S., and Hochstrasser D. (1993) The focusing positions of polypeptides in immobilized pH gradients can be predicted from their amino acid sequences. Electrophoresis 14, 1023–1031 [DOI] [PubMed] [Google Scholar]
- 42. Bjellqvist B., Basse B., Olsen E., and Celis J. E. (1994) Reference points for comparisons of two-dimensional maps of proteins from different human cell types defined in a pH scale where isoelectric points correlate with polypeptide compositions. Electrophoresis 15, 529–539 [DOI] [PubMed] [Google Scholar]
- 43. Wilkins M. R., Gasteiger E., Bairoch A., Sanchez J. C., Williams K. L., Appel R. D., and Hochstrasser D. F. (1999) Protein identification and analysis tools in the ExPASy server. Methods Mol. Biol. 112, 531–552 [DOI] [PubMed] [Google Scholar]
- 44. Arnold K., Bordoli L., Kopp J., and Schwede T. (2006) The SWISS-MODEL workspace: a web-based environment for protein structure homology modelling. Bioinformatics 22, 195–201 [DOI] [PubMed] [Google Scholar]
- 45. Guex N., Peitsch M. C., and Schwede T. (2009) Automated comparative protein structure modeling with SWISS-MODEL and Swiss-PdbViewer: A historical perspective. Electrophoresis 30, S162–S173 [DOI] [PubMed] [Google Scholar]
- 46. Kiefer F., Arnold K., Künzli M., Bordoli L., and Schwede T. (2009) The SWISS-MODEL Repository and associated resources. Nucleic Acids Res. 37, D387–D392 [DOI] [PMC free article] [PubMed] [Google Scholar]
- 47. Biasini M., Bienert S., Waterhouse A., Arnold K., Studer G., Schmidt T., Kiefer F., Gallo Cassarino T., Bertoni M., and Bordoli L., Schwede T. (2014) SWISS-MODEL: modelling protein tertiary and quaternary structure using evolutionary information. Nucleic Acids Res. 42, W252–W258 [DOI] [PMC free article] [PubMed] [Google Scholar]
- 48. Cserzö M., Eisenhaber F., Eisenhaber B., and Simon I. (2002) On filtering false positive transmembrane protein predictions. Protein Eng. 15, 745–752 [DOI] [PubMed] [Google Scholar]
- 49. Ashkenazy H., Abadi S., Martz E., Chay O., Mayrose I., Pupko T., and Ben-Tal N. (2016) ConSurf 2016: an improved methodology to estimate and visualize evolutionary conservation in macromolecules. Nucleic Acids Res. 44, W344–W350 [DOI] [PMC free article] [PubMed] [Google Scholar]
- 50. Landau M., Mayrose I., Rosenberg Y., Glaser F., Martz E., Pupko T., and Ben-Tal N. (2005) ConSurf 2005: the projection of evolutionary conservation scores of residues on protein structures. Nucleic Acids Res. 33, W299–W302 [DOI] [PMC free article] [PubMed] [Google Scholar]
Associated Data
This section collects any data citations, data availability statements, or supplementary materials included in this article.