This study provides the first physiological characterization of oxygen chemoreceptors from an anoxia-tolerant vertebrate. Neuroepithelial cells (NECs) from the gills of goldfish displayed L-type Ca2+ channels and three types of K+ channels, one of which was dependent upon intracellular Ca2+. Although membrane currents were not inhibited by hypoxia during patch-clamp recording, this study is the first to show that NECs with an undisturbed cytosol responded to hypoxia with increased intracellular Ca2+ and synaptic vesicle activity.
Keywords: neuroepithelial cell, hypoxia, goldfish, chemoreceptor, ion channel
Abstract
The neuroepithelial cell (NEC) of the fish gill is an important model for O2 sensing in vertebrates; however, a complete picture of the chemosensory mechanisms in NECs is lacking, and O2 chemoreception in vertebrates that are tolerant to anoxia has not yet been explored. Using whole cell patch-clamp recording, we characterized four types of ion channels in NECs isolated from the anoxia-tolerant goldfish. A Ca2+-dependent K+ current (IKCa) peaked at ~20 mV, was potentiated by increased intracellular Ca2+, and was reduced by 100 μM Cd2+. A voltage-dependent inward current in Ba2+ solution, with peak at 0 mV, confirmed the presence of Ca2+ channels. A voltage-dependent K+ current (IKV) was inhibited by 20 mM tetraethylammonium and 5 mM 4-aminopyridine, revealing a background K+ current (IKB) with open rectification. Mean resting membrane potential of −45.2 ± 11.6 mV did not change upon administration of hypoxia (Po2 = 11 mmHg), nor were any of the K+ currents sensitive to changes in Po2 during whole cell recording. By contrast, when the membrane and cytosol were left undisturbed during fura-2 or FM 1-43 imaging experiments, hypoxia increased intracellular Ca2+ concentration and initiated synaptic vesicle activity. 100 μM Cd2+ and 50 μM nifedipine eliminated uptake of FM 1-43. We conclude that Ca2+ influx via L-type Ca2+ channels is correlated with vesicular activity during hypoxic stimulation. In addition, we suggest that expression of IKCa in gill NECs is species specific and, in goldfish, may contribute to an attenuated response to acute hypoxia.
NEW & NOTEWORTHY This study provides the first physiological characterization of oxygen chemoreceptors from an anoxia-tolerant vertebrate. Neuroepithelial cells (NECs) from the gills of goldfish displayed L-type Ca2+ channels and three types of K+ channels, one of which was dependent upon intracellular Ca2+. Although membrane currents were not inhibited by hypoxia during patch-clamp recording, this study is the first to show that NECs with an undisturbed cytosol responded to hypoxia with increased intracellular Ca2+ and synaptic vesicle activity.
the ability to detect and respond to changes in environmental O2 is critically important for the survival of air- and water-breathing vertebrates. In mammals and fish, peripheral chemoreceptors initiate physiological responses to low O2 (hypoxia), such as hyperventilation and changes in heart rate (González et al. 1994; Jonz 2014; Kumar and Prabhakar 2012; Milsom and Burleson 2007; Perry et al. 2009). Among the most studied respiratory chemoreceptors are the type I cells of the carotid body—the primary O2-sensing organ in mammals (González et al. 1994; Kumar and Prabhakar 2012; López-Barneo et al. 2016; Peers et al. 2010). In fish, serotonergic neuroepithelial cells (NECs) of the gills are the primary O2 chemoreceptors and are, thus, considered to be homologs of respiratory chemoreceptors in mammals (Jonz and Nurse 2009; Milsom and Burleson 2007; Zachar and Jonz 2012). However, the electrophysiological properties and mechanisms of O2 chemosensing in gill NECs have been described in only two species—zebrafish (Danio rerio; Abdallah et al. 2015; Jonz et al. 2004; Porteus et al. 2014; Qin et al. 2010) and channel catfish (Ictalurus punctatus; Burleson et al. 2006)—thus limiting our understanding of hypoxic transduction in NECs and their role in cardioventilatory control.
Some fish species, including the common goldfish (Carassius auratus), have evolved strategies to adapt to extreme O2 deprivation, or even anoxia (Bickler and Buck 2007). Goldfish have a relatively high blood O2 affinity (P50 = 2.6 mmHg; Burggren 1982), allowing them to effectively extract O2 from their environment during hypoxia, and goldfish display ion channel arrest in the central nervous system to conserve ATP during anoxia (Wilkie et al. 2008). Despite such adaptive features, comparative studies have revealed that, like the hypoxia-sensitive adult zebrafish, goldfish respond to acute hypoxia with hyperventilation (Tzaneva et al. 2011; Vulesevic et al. 2006), although in these studies, goldfish first displayed a significant hypoxic hyperventilatory response at a relatively depressed partial pressure of O2 (Po2) compared with zebrafish. Because gill NECs of anoxia-tolerant animals have not previously been studied, it is unclear how peripheral chemoreceptors in such organisms may be adapted to mediate hyperventilatory responses in extremely hypoxic environments.
Whole cell currents in zebrafish NECs are dominated by an O2-sensitive current through background K+ (KB) channels, and hypoxic inhibition of KB produces membrane depolarization (Jonz et al. 2004). In carotid body type I cells, hypoxia leads to inhibition of KB channels and ultimately to the activation of voltage-dependent Ca2+ channels and Ca2+-dependent neurosecretion (Buckler 1997, 2015; Kumar and Prabhakar 2012; López-Barneo et al. 1988). An increase in intracellular Ca2+ concentration ([Ca2+]i) is an important step in the transduction of the hypoxic signal to a neurosecretory response and has been demonstrated in type I cells of the rabbit (Montoro et al. 1996) and rat (Bright et al. 1996; Piskuric and Nurse 2012). In gill NECs, elevated [Ca2+]i was induced by extracellular H+ (Abdallah et al. 2015) and sodium sulfide (Porteus et al. 2014) in zebrafish; and in trout (Oncorhynchus mykiss), ammonia induced a [Ca2+]i response (Zhang et al. 2011). In the study that first identified gill NECs, hypoxia induced degranulation of dense-cored vesicles in trout (Dunel-Erb et al. 1982), and uptake of the styryl dye FM 1-43 (an indicator of Ca2+-dependent synaptic vesicle recycling) was induced by the metabolic inhibitor cyanide in zebrafish (Jonz et al. 2015). However, an intracellular Ca2+ response has never been linked directly with a hypoxic stimulus in gill NECs. Therefore, it has not been possible to assess whether NECs are capable of Ca2+-dependent neurosecretion during hypoxia.
In a previous report, we showed that NECs isolated from the gills of the anoxia-tolerant goldfish were insensitive to hypoxia under whole cell patch-clamp recording (Zachar and Jonz 2012). In the present study, we characterized the ion channel currents in these cells and hypothesized that goldfish NECs would have unique membrane properties, compared with those of zebrafish. Using whole cell patch-clamp techniques, in which the cytoplasm was dialyzed with an intracellular solution, we discovered a suite of membrane currents, including a dominant Ca2+-activated K+ current but were unable to identify O2 sensitivity under these conditions. By contrast, using fura-2 microspectrofluorometry and the activity-dependent dye FM 1-43, we demonstrate that NECs with a preserved cytosol responded to hypoxia with an increase in [Ca2+]i and synaptic vesicle activity. These studies are the first to confirm a role for intracellular Ca2+ in hypoxic signaling in gill NECs. We further suggest that ion channel expression in NECs may contribute to hypoxic sensitivity or tolerance.
METHODS
Ethical approval.
Adult goldfish (Carassius auratus L., Mt. Parnell Fisheries, Mercersburg, PA) were maintained at 18°C in a closed recirculated facility. All procedures for animal use were carried out according to institutional guidelines (protocol no. BL-262) adhering to those of the Canadian Council on Animal Care.
Cell isolation.
Experiments were performed on NECs enzymatically isolated from the gills of adult goldfish. Cell isolation techniques were adapted from Jonz et al. (2004). Goldfish were euthanized by rapid pithing and decapitation. Gill tissue from one or two fish was combined daily to provide cells for each round of experiments. Whole gill baskets were dissected and immediately placed in ice-cold PBS containing (mM): 137 NaCl, 15.2 Na2HPO4, 2.7 KCl, and 1.5 KH2PO4 1.5 at pH 7.8 (Jonz et al. 2004). Individual gill arches were separated under sterile conditions and placed in a wash solution of PBS containing 2% penicillin/streptomycin (Gibco, Life Technologies, Carlsbad, CA) for 8 min, where they were cleaned of blood and mucous.
The distal tips of the gill filaments were then separated from all gill arches and left in 3 ml of 0.25% trypsin/EDTA (Gibco) for 1 h at 28°C. The tissue was further dissociated mechanically using fine forceps and by trituration in a 15-ml Falcon tube (Fisher Scientific, Waltham, MA). Trypsin activity was halted by adding 0.2 ml FBS (Gibco). Undissociated tissue was left to settle for 8 min, and the remaining suspension was centrifuged (Thermo Scientific) in a separate 15-ml Falcon tube at 100 g for 5 min. The supernatant was removed, and the pellet was resuspended in 2 ml PBS. To remove any remaining tissue debris, the suspension was allowed to settle again and was centrifuged for 3 min. The supernatant was removed, and the pellet resuspended in an incubating solution of 0.5 ml Leibovitz’s (L-15, Gibco) culture medium containing 2% penicillin/streptomycin and 2% FBS. The cell suspension was then plated in 0.1-ml volumes onto modified glass-bottomed cell culture dishes (35 mm; Corning, Corning, NY; see Jonz et al. 2004) and incubated overnight. Dishes were previously coated with 0.1 mg/ml poly-l-lysine (Sigma, Oakville, ON, Canada) followed by Matrigel (BD Biosciences, San Jose, CA). Cells were treated the following day by the addition of 2 ml L-15 containing 2% FBS. Experiments on dissociated cells were completed within 24–36 h following dissociation.
Immunocytochemistry.
Isolated NECs were plated in dishes fitted with coverslips etched with grids to allow repeated localization of cells of interest following fixation. NECs that adhered to the culture substrate were identified by the addition of 2 mg/ml neutral red (NR; Sigma), a vital marker used to identify NECs containing serotonin (5-HT) and synaptic vesicles (Jonz et al. 2004), to the medium for 8 min. Live cells that took up NR were first imaged using bright-field optics. Following NR staining, cells were immediately processed for immunolabeling to positively identify them as NECs. Cells were fixed using 4% paraformaldehyde (Sigma) in PBS for 15 min at room temperature. Polyclonal antibodies raised in rabbit against serotonin (5-HT; cat. no. S5545; Sigma), a well as monoclonal antibodies raised in mouse against a synaptic vesicle protein (SV2; Developmental Studies Hybridoma Bank, University of Iowa), were applied at a dilution of 1:250 to the dishes for 24 h at 4°C. Secondary antibodies were then targeted to the primary antibodies for 1 h at room temperature. FITC (Invitrogen, Burlington, ON, Canada) was used at 1:50 to label 5-HT immunoreactivity, and Alexa Fluor 594 (Invitrogen) was used at 1:100 to label SV2. Cells positively stained by NR were imaged for 5-HT and SV2 immunolabeling using epifluorescence filters for 488- and 594-nm emission. Imaging was done on an inverted microscope (Axio Vert, Zeiss, Jena, Germany), and images were captured with a digital camera (CCD; QImaging, Surrey, BC, Canada) and Northern Eclipse imaging software (Empix Imaging, Mississauga, ON, Canada). The diameter of cells labeled by NR, 5-HT, and SV2 was measured using the line tool on Northern Eclipse.
Solutions.
Dishes were fitted with a chamber insert (~200−400 μl volume) and mounted on the stage of an inverted microscope (Axio Vert, Zeiss). The recording chamber was perfused under gravity at 4 ml/min with extracellular solution (22−24°C) maintained in reservoirs. Hypoxia (Po2 ~11 mmHg) was generated by bubbling solution in a reservoir with 99.9% N2 for 30 min before experiments, as well as blowing N2 over the open recording chamber. A carbon fiber electrode (Kation Scientific, Minneapolis, MN) was used to measure Po2 in a cell-free perfusion chamber. All carbon fiber recordings were made relative to an Ag-AgCl pellet. The carbon fiber electrode was polarized to −600 mV to detect O2 (Mojet et al. 1997). Carbon fiber recordings were calibrated by using an air-equilibrated Po2 of 150 mmHg and by using a solution containing 2 mM sodium dithionite (Sigma) bubbled with N2 to produce anoxia (Po2 = 0 mmHg). Recordings were obtained using a Multiclamp amplifier controlled by pClamp 10 software (Molecular Devices, Sunnyvale, CA).
Normal extracellular solution contained (in mM): 120 NaCl, 5 KCl, 2.5 CaCl2, 2 MgCl2, 10 glucose, and 10 HEPES. The pH of extracellular solutions was adjusted to 7.8 with NaOH. In some experiments, solutions containing 10 mM KCl were used to stimulate NECs. Pharmacological block of voltage-gated K+ channels (Kv) was produced using 20 mM tetraethylammonium (TEA) and 5 mM 4-aminopyridine. Blockade of voltage-gated Ca2+ channels was achieved using the general Ca2+ channel blocker, Cd2+ (100 µM), or the L-type channel blocker, nifedipine (50 µM). In some experiments, conductance through Ca2+ channels was enhanced by using 10 mM Ba2+ as a charge carrier in place of extracellular Ca2+. Cd2+ was also used to indirectly inhibit the activity of Ca2+-dependent K+ channels (KCa). All agents were purchased from Sigma and added to the perfusion reservoir. Chemicals of concentration 5 mM or greater were added to solutions by equimolar substitution of NaCl.
Electrophysiology.
All voltage- and current-clamp recordings were performed using the whole cell patch-clamp technique. Experiments were conducted using an Axon Digidata 1440 in conjunction with an Axon MultiClamp 700B microelectrode amplifier and pClamp 10 software (Molecular Devices). Electrodes were made from borosilicate glass (World Precision Instruments, Sarasota, FL) and pulled on a PC-10 vertical pipette puller (Narishige International, East Meadow, NY). All electrodes were fire-polished with a tip resistance of 6−8 MΩ. Electrode filling solution contained (in mM) 10 NaCl, 120 KCl, 0.5 CaCl2, 2 Mg-ATP, 10 HEPES, and 5 EGTA. The pH was adjusted to 7.4 with KOH. In this solution, free Ca2+ concentration was calculated to be ~10 nM (Schoenmakers et al. 1992). Electrophysiological recordings were made against an Ag-AgCl pellet immersed in the recording chamber. Data are presented after correction for liquid junction potential error of ~5 mV.
NECs were identified for recording using NR. Only cells having a seal resistance of ≥1 GΩ, a resting membrane potential (Vm) ≥ −40 mV, whole cell membrane capacitance (Cm) of 2−4 pF, and Rs of <20 MΩ were used for analysis. Cells were held at a potential of −60 mV, and currents were evoked by step depolarization to test potentials (see figure legends) for 200 ms at a frequency of 2.5 Hz. Steady-state current was measured at 175 ms. In some experiments, currents were evoked by changing the membrane potential from −100 mV to +100 mV over a period of 1 s. In current-clamp, Vm was recorded without current injection (I = 0). Recordings were digitized at 10 kHz and filtered at 5 kHz. All data were analyzed using Clampfit software (Molecular Devices), and figures were arranged using Origin 8.6 (OriginLab, Northampton, MA), Prism 5 (GraphPad Software, La Jolla, CA), and Adobe Illustrator CS6 (Adobe Systems, San Jose, CA).
Measurement of relative changes in intracellular calcium concentration [Ca2+]i.
Relative changes in intracellular Ca2+ concentration ([Ca2+]i) in NECs were measured using the ratiometric fluorescent Ca2+ indicator, fura-2-acetoxymethyl ester (fura-2 AM; Invitrogen). Techniques were adapted from Abdallah et al. (2015). Cells isolated on glass-bottomed culture dishes were washed with PBS and incubated with 5 µM fura-2 AM in extracellular solution containing 0.1% pluronic acid (Invitrogen) for 45 min. Cells were then washed and incubated in PBS for 45 min. NECs were identified by labeling with both NR and fura-2 AM on an upright microscope (Eclipse, Nikon, Tokyo, Japan) equipped with a Lambda DG-5 high-speed wavelength changer (Sutter Instruments, Novato, CA) using a digital camera (EXi CCD Camera, QImaging). Dual images (340- and 380-nm excitation and 510-nm emission) were collected, and ratiometric data were obtained using Northern Eclipse imaging software (Empix Imaging). Values for normoxia were obtained as an average of the 340/380-nm fluorescence excitation ratio (R340/380) before hypoxic exposure. Hypoxic values are presented as peak R340/380 during hypoxic exposure.
Measurement of synaptic vesicle activity using FM 1-43.
The fluorescence vital dye, N-(3-triethylammoniumpropyl)-4-(4-(dibutylamino) styryl) pyridinium dibromide (FM 1-43; Invitrogen), was used to observe vesicular activity in NR-positive NECs. Cells were exposed to normoxic extracellular solution for 3 min followed by either normoxic (as control) or hypoxic solution containing FM 1-43 (2 µM) for 2 min and then washed with normoxic solution without FM 1-43 for 1 min. Imaging was done using an inverted microscope (Axio Vert, Zeiss) with a digital camera (CCD; QImaging) and Northern Eclipse imaging software (Empix Imaging) within 20 min of FM 1-43 exposure. All NECs were imaged under bright-field and epifluorescence filtered for 488-nm emission. Images were processed using ImageJ (National Institutes of Health, Bethesda, MD). Fluorescence intensity was quantified using corrected total cell fluorescence, which was calculated as the integrated density minus the product of two-dimensional cell area and mean background fluorescence, as described by Burgess et al. (2010).
Statistics.
Data are presented as means ± SE for values for voltage- and current-clamp, Ca2+ imaging and FM 1-43 experiments. To determine whether data sets were normally distributed, we used the DʼAgostino and Pearson test for normality. For normal data, multiple comparisons were performed using ANOVA followed by the Bonferroni post hoc test for FM 1-43 data. For other experiments, groups were compared using the paired t-test. For nonnormal data sets, nonparametric statistical procedures were used. The Friedman test for repeated measures was used for multiple comparison, and the Wilcoxon matched-pairs test was used. Statistical analyses were performed using software packages Excel (Microsoft, Redmond, WA), Origin 8.6 (OriginLab), or Prism 5 (GraphPad).
RESULTS
Identification and passive membrane properties of isolated NECs.
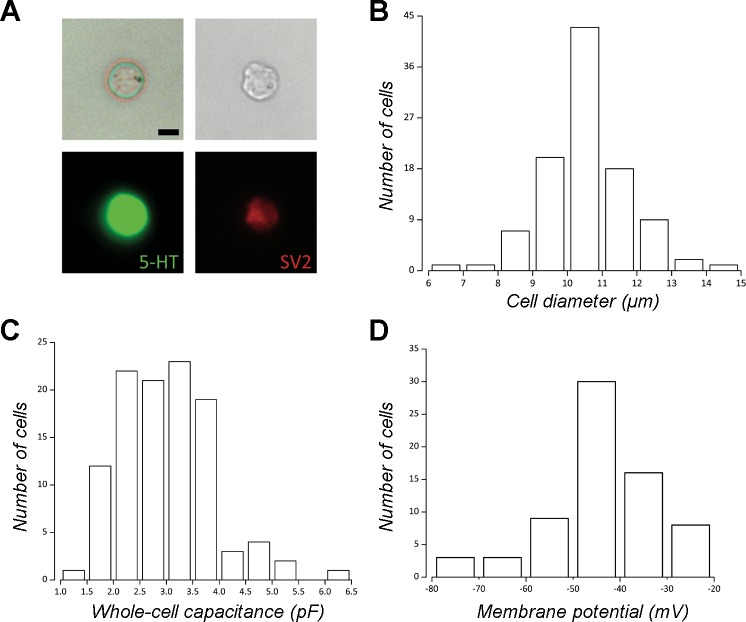
Isolated goldfish NECs were identified in vitro using NR (Fig. 1A). Immunocytochemical analysis showed that 87% (n = 102) of NR-positive cells were also immunoreactive for 5-HT and SV2. Measurement of diameter in cells positive for all three markers yielded a frequency distribution with a single mode between 10 and 11 µm and a mean diameter of 10.2 ± 1.3 µm (Fig. 1B). NR-positive cells with these morphological characteristics were identified as NECs and were selected for all subsequent experiments.
Fig. 1.
Identification and passive membrane properties of neuroepithelial cells (NECs) isolated from the goldfish gill. A: a single NEC is shown under bright-field illumination and stained with neutral red (NR) 24 h after dissociation (upper left) and immediately after fixation (upper right). Using fluorescence microscopy, the same NEC was subsequently labeled by antibodies against serotonin (5-HT, lower left) and the synaptic vesicle protein, SV2 (lower right). Scale bar = 5 µm. B: frequency distribution of the number of cells vs. cell diameter measured from dissociated cells (n = 102) stained with NR and labeled with 5-HT and SV2, demonstrating a mean diameter of 10.2 ± 1.3 µm. C: frequency distribution of the number of cells vs. whole cell membrane capacitance (Cm, n = 108) indicated that 90% of cells were between 2 and 4 pF with a mean of 3 ± 0.9 pF. D: frequency distribution of the number of cells vs. resting membrane potential (Vm) under current-clamp (I = 0 pA, n = 65) indicated that 69% of cells had a Vm ≥ –40 mV with a mean of –45.2 ± 11.6 mV.
Under voltage-clamp electrophysiological recording, the mean membrane capacitance (Cm) of NECs was 3 ± 0.9 pF (n = 108), with 90% of cells having a Cm of 2–4 pF (Fig. 1C). In agreement with direct measurement of cell diameter, we calculated the mean diameter of patched cells using measured Cm, the ratio 1 µF/cm2, and the equation for membrane surface area of a spherical cell (A = 4πr2; Golowasch et al. 2009; Solsona et al. 1998), as 9.7 ± 1.4 µm (n = 108). Mean resting membrane potential (Vm) measured under current-clamp recording (I = 0 pA) was –45.2 ± 11.6 mV (n = 65), with 69% of cells having a Vm ≥ –40 mV (Fig. 1D). Mean series resistance (Rs) was 14.2 ± 7.7 MΩ (n = 115), with 82% of cells having an Rs ≤ 20 MΩ.
Voltage-clamp recording revealed K+ and Ca2+ currents.
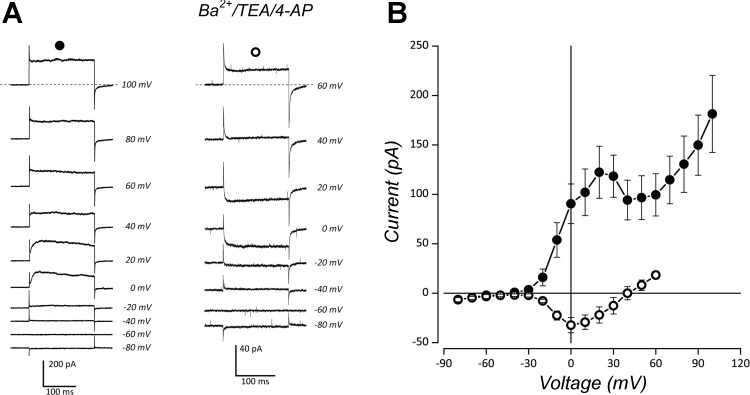
Depolarizing steps from a holding potential of –60 mV in normal extracellular solution evoked outward K+ current at test potentials positive to –30 mV (Fig. 2A, left). This current peaked at 20 mV, with delayed activation at potentials below 40 mV, and displayed some deactivation within 100 ms of the voltage step between 0 and 20 mV. A current-voltage (I–V) relationship generated from the means ± SE of steady-state current amplitude from six cells is shown in Fig. 2B. The I–V curve shows a prominent shoulder between depolarizing steps from −20 to 40 mV. This shoulder approximately corresponded to inward current carried through voltage-gated Ca2+ channels with peak current at 0 mV, as recorded from eight cells in solution containing 10 mM Ba2+, 20 mM TEA, and 5 mM 4-AP, and shown in Fig. 2A (traces at right) and in the I–V in Fig. 2B. These characteristics suggested that a component of the outward K+ current was dependent upon intracellular Ca2+ (IKCa), as generated by Ca2+-dependent K+ channels (KCa).
Fig. 2.
Whole cell currents in isolated neuroepithelial cells (NECs) indicate Ca2+-activated K+ (KCa) channels and voltage-gated Ca2+ channels. A: traces are shown from stepwise depolarization under voltage clamp, averaged from multiple cells. Traces at left (n = 6) show currents evoked in normal extracellular solution with peak conductance at 20 mV. Traces at right (n = 8) show currents evoked in solution containing 10 mM Ba2+ as a charge carrier, 20 mM TEA, and 5 mM 4-AP. Initial activation of inward current occurred at approximately –30 mV, with peak conductance at 0 mV. B: current-voltage relationships show means ± SE. Whole cell current in normal extracellular solution demonstrates that a component of outward K+ current was Ca2+-activated (IKCa; ●); and in Ba2+, TEA, and 4-AP solution demonstrating an inward current through Ca2+ channels (○).
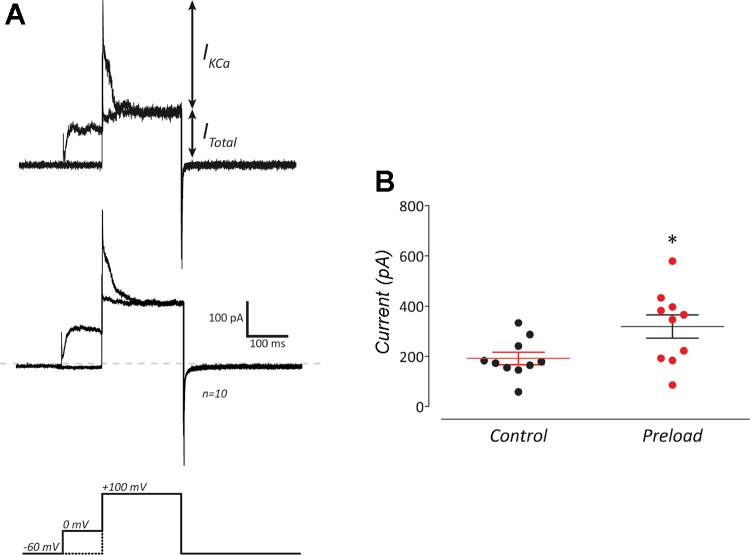
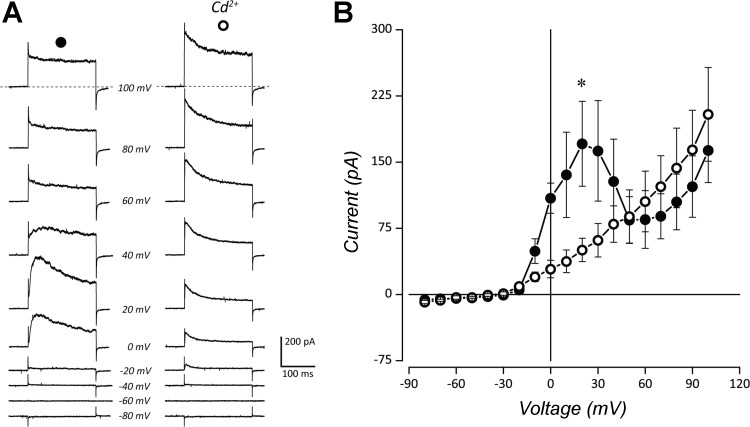
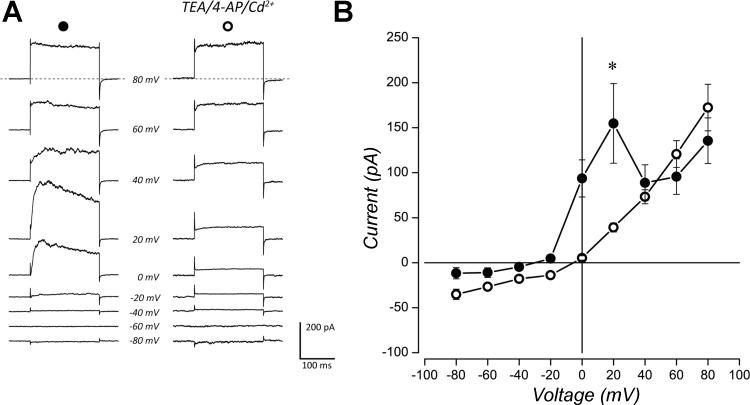
IKCa was further investigated by preloading cells with Ca2+ (Fig. 3), following previously established procedures (López-López et al. 1997). In control experiments, NECs were depolarized with a single step from a holding potential of −60 mV to 100 mV. Current evoked from this test pulse constituted total whole cell current (ITotal; Fig. 3A). Cells were then preloaded with Ca2+ using a 100-ms prepulse to 0 mV, exceeding the activation potential of Ca2+ channels. Subsequent depolarization of preloaded cells to the 100-mV test potential evoked an increased outward current (i.e., IKCa). The average current (n = 10), measured 5 ms after the initial step to 100 mV, increased significantly in the prepulse experiments compared with control (Fig. 3B, P < 0.05, paired t test). The dependence of IKCa on Ca2+ influx was investigated by blocking Ca2+ channels with 100 µM Cd2+ (Fig. 4, A and B). Exposing NECs to Cd2+ eliminated IKCa. Outward current was significantly reduced at 20 mV upon application of Cd2+ (P < 0.05, n = 4, Wilcoxon matched-pairs test).
Fig. 3.
Preloading NECs with Ca2+ induced a transient increase in current through KCa. A: upper traces were generated from the step protocol in the lower panel. The upper trace shows a recording from a single cell, while the middle trace shows the average of 10 cells. Total whole cell current (ITotal) was generated with a control step from a holding potential of –60 mV to 100 mV (lower panel, dotted line). The transient Ca2+-activated K+ current (IKCa) was evoked by preloading NECs with Ca2+ using an initial 100-ms step to 0 mV, followed immediately by a step to 100 mV (lower panel, solid line). B: preloading cells with Ca2+ resulted in a significant increase in means ± SE outward current immediately following the step to 100 mV (*P < 0.05, paired t test, n = 10).
Fig. 4.
IKCa was reduced by Cd2+. A: whole cell currents elicited by step depolarization and averaged from multiple cells (n = 4) are shown. Left: control traces in normal extracellular solution. Right: traces in solution containing 100 µM Cd2+. B: current-voltage relationship generated from step depolarizations in A are shown. Values are expressed as means ± SE. Whole cell current in normal solution (●) shows a characteristic IKCa profile. Blockade of Ca2+ channels with Cd2+ eliminated IKCa and revealed a voltage-gated K+ current (IKV) activating at approximately –30 mV (○). Current was significantly reduced at 20 mV (*P < 0.05, Wilcoxon matched-pairs test).
Inhibition of IKCa by Cd2+ revealed a transient, voltage-dependent K+ current (IKV) with rapid activation at test potentials positive to approximately –30 mV, as well as an inactivating component within the first 100 ms of the voltage step (Fig. 4A, right). Administration of the Kv channel blockers, 20 mM TEA, and 5 mM 4-AP, with 100 µM Cd2+, eliminated IKCa and IKv (Fig. 5, A and B). Upon application of these agents, mean outward current was significantly reduced at 20 mV (P < 0.05, Wilcoxon matched-pairs test, n = 5). The remaining outward current was rapidly activating (Fig. 5A, right) and characteristic of an open-rectifier-type K+ conductance, as would be carried through background K+ (KB) channels (Fig. 5B). Such currents have been described in rat type I cells (Buckler 1997) and zebrafish NECs (Jonz et al. 2004) and are O2 sensitive.
Fig. 5.
Expression of voltage-dependent (Kv) and voltage-independent (KB) K+ channels in goldfish NECs. A: raw current traces elicited by step depolarization and averaged from multiple cells (n = 5). Left: control traces in normal extracellular solution; right: traces in solution containing 20 mM TEA, 5 mM 4-AP, and 100 µM Cd2+. B: current-voltage relationship from traces in A are shown. Values are expressed as means ± SE. Whole cell current in normal solution (●) shows characteristic whole cell current with IKCa profile. Blocking KCa and Kv channels reveals openly rectifying background K+ current (IKB, ○), with significant reduction at 20 mV (*P < 0.05, Wilcoxon matched-pairs test).
Goldfish NECs did not respond to hypoxia under whole cell recording.
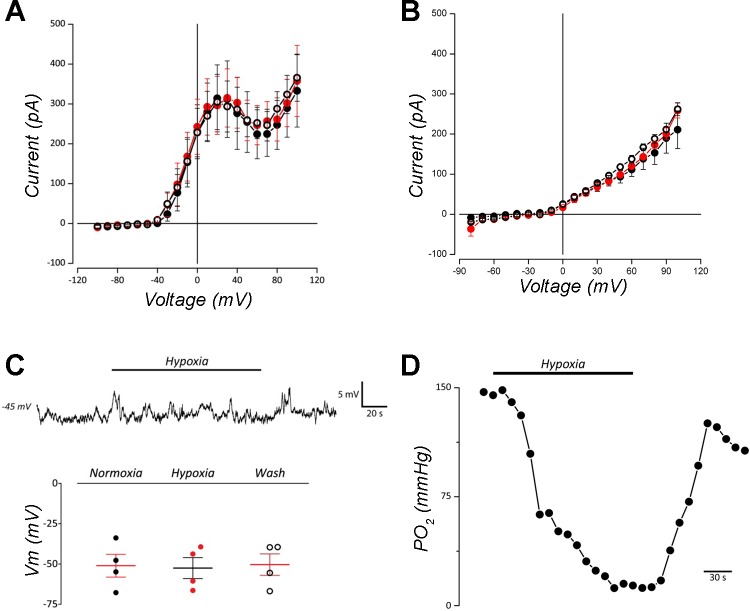
Goldfish NECs were exposed to brief applications of progressive hypoxia. In voltage-clamp experiments under these conditions, goldfish NECs showed no change in whole cell current across a range of potentials shown in Fig. 6, compared with normoxia, in normal solution (Fig. 6A; n = 6) or when KB channels were isolated with TEA, 4-AP, and Cd2+ (Fig. 6B, Wilcoxon matched-pairs test, n = 4). Current-clamp recording revealed that membrane potential (Vm) was unaffected by application of hypoxia, and there was no significant change in Vm by hypoxia in a sampled population of cells (Fig. 6C, n = 4; Friedman multiple-comparison test). Figure 6D presents a carbon fiber recording demonstrating that bath Po2 reached values as low as 11 mmHg over a period of 2 min in these experiments.
Fig. 6.
Hypoxia did not affect whole cell current or membrane potential in goldfish NECs under voltage- or current-clamp. A: means ± SE current-voltage relationship at 10-mV intervals from –100 to 100 mV in normal extracellular solution (n = 6). B: means ± SE current-voltage relationship generated with step depolarizations in solution containing 20 mM TEA, 5 mM 4-AP, and 100 µM Cd2+ (n = 4) to isolate background K+ current (IKB). There were no differences in whole cell current between normoxia (●), hypoxia (closed red circles), and return to normoxic solution (○) in A or B (Wilcoxon matched-pairs test). C: in current-clamp recording of a single cell in normal solution, brief application of hypoxia did not elicit a change in membrane potential (Vm, upper trace). Bottom: summary of data indicating that there was no significant change in means ± SE Vm during hypoxic perfusion compared with normoxia (n = 4, Friedman multiple-comparison test). D: carbon fiber recording of changes in Po2 within the recording chamber. Po2 change was measured with time, while superfusing the chamber with N2-bubbled solution to produce hypoxia. Solution reached a Po2 of ~11 mmHg within 2 min.
Goldfish NECs with a preserved cytosol responded to hypoxia.
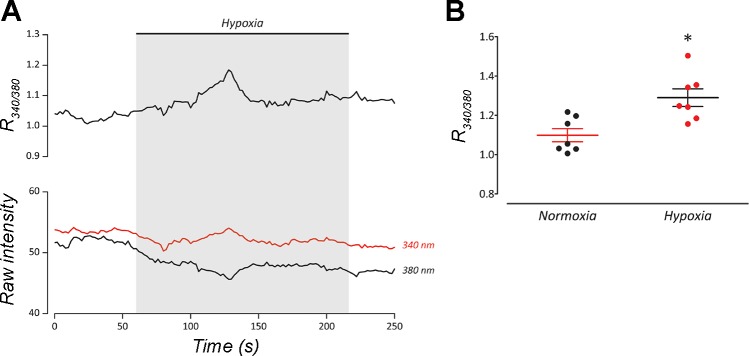
The ability of goldfish NECs to respond to hypoxia was demonstrated using microspectrofluorometry. Cells loaded with fura-2 AM were exposed to hypoxia, and changes in intracellular Ca2+ concentration ([Ca2+]i) were observed as a shift in the 340/380 nm excitation ratio (R340/380; Fig. 7). Exposure to hypoxia resulted in a gradual rise in [Ca2+]i that returned to control values before normoxic solution was reintroduced to the recording chamber (Fig. 7A). Mean R340/380 from peak responses to hypoxia was significantly higher than mean R340/380 during normoxic superfusion (P < 0.05, Wilcoxon matched-pairs test, n = 7) (Fig. 7B). To verify that depolarization of Vm was sufficient to induce an increase in [Ca2+]i similar to that of hypoxia, NECs were treated with solution containing 10 mM KCl. High K+ solution elicited a transient rise in [Ca2+]i (n = 4; Fig. 8).
Fig. 7.
Intracellular Ca2+ increased in response to hypoxia in isolated neuroepithelial cells (NECs) of goldfish. A: representative recording of a NEC responding to hypoxia by increasing intracellular Ca2+ concentration ([Ca2+]i). Upper trace shows 340/380-nm excitation ratio (R340/380) using fura-2 AM; bottom traces show raw intensities at each wavelength. B: Plot of means ± SE R340/380 indicates that [Ca2+]i rose significantly during hypoxia compared with normoxia (*P < 0.01, Wilcoxon matched-pairs test; n = 7).
Fig. 8.
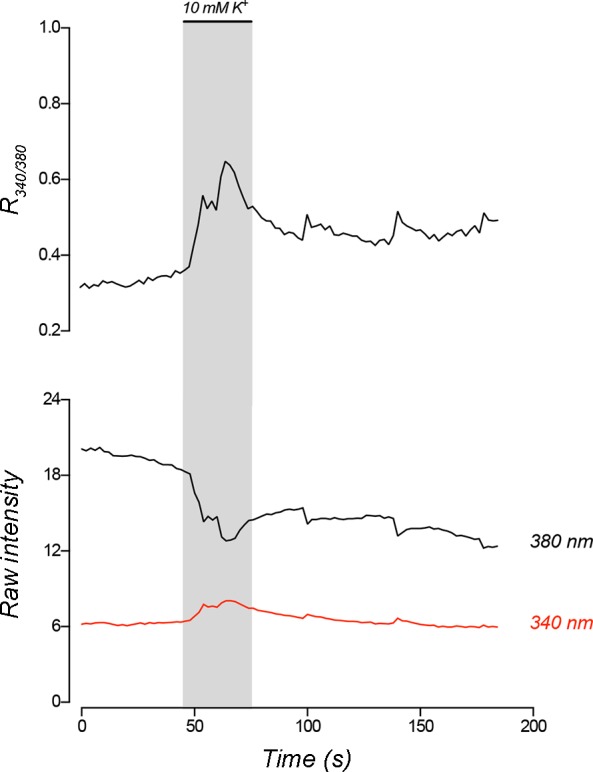
High K+ solution increased intracellular Ca2+ in isolated neuroepithelial cells (NECs) of goldfish. Representative recording of a NEC responding to a 30-s application of solution containing 10 mM KCl by increasing intracellular Ca2+ concentration ([Ca2+]i). Upper trace shows 340/380 nm excitation ratio (R340/380) using fura-2 AM, while bottom traces show raw intensities at each wavelength.
Goldfish NECs increased Ca2+-dependent recycling of synaptic vesicles in response to hypoxia (Fig. 9). Vesicular activity was observed using the styryl dye FM 1-43. Uptake of FM 1-43 into excitable cells takes place primarily during the process of vesicular recycling, following neurotransmitter release (Betz et al. 1992; Tegenge et al. 2012). NECs exposed to hypoxia in the presence of FM 1-43 incorporated significantly more dye compared with normoxia (P < 0.05, ANOVA, Bonferroni), as indicated by an approximately twofold increase in mean fluorescence intensity (Fig. 9B). Blocking Ca2+ channels with 100 µM Cd2+ eliminated increased dye uptake during hypoxia, as did application of the L-type Ca2+ channel blocker, 50 µM nifedipine.
Fig. 9.
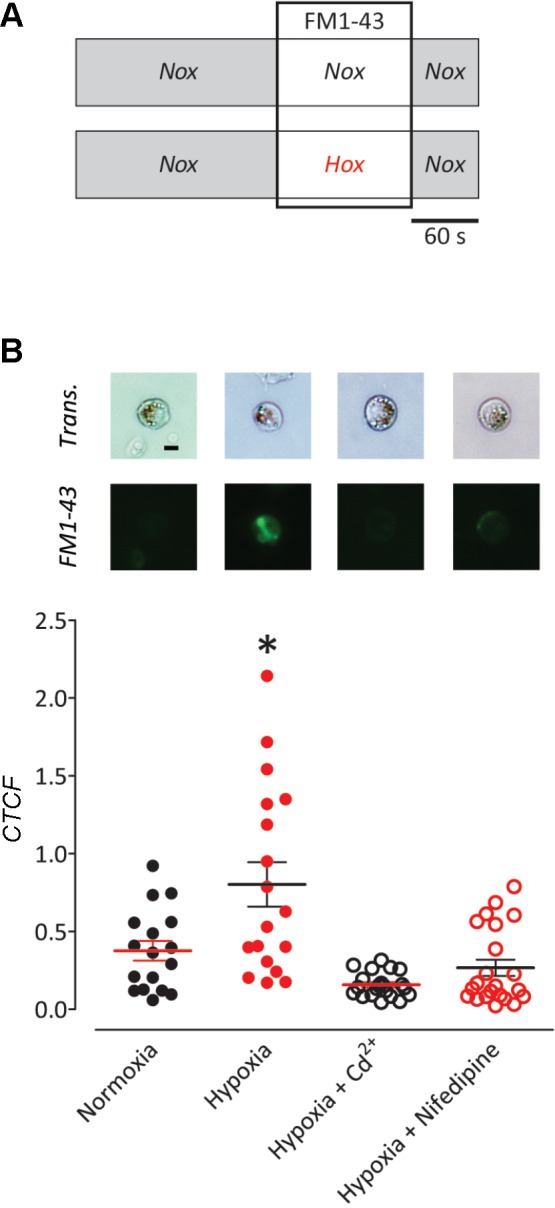
Ca2+-dependent vesicular activity in isolated goldfish NECs increased in response to hypoxia. A: summary of the experimental procedure. Isolated NECs were perfused with normal extracellular solution for 3 min. Subsequently, NECs were exposed to either normoxia or hypoxia in the presence of 2 µM FM 1-43 for 2 min. Cells were then washed with normal solution for 1 min and imaged. B: images show NECs labeled with neutral red under transmitted light (Trans.) or FM 1-43 uptake by fluorescence imaging. Scale bar = 5 µm. Exposure to hypoxia (n = 19) significantly increased uptake of FM 1-43, as indicated by means ± SE corrected total cell fluorescence (CTCF) (*P < 0.05, ANOVA, Bonferroni) as compared with normoxia (n = 17). The addition of 100 µM Cd2+ (n = 21) or 50 µM nifedipine (n = 22) to the recording chamber for the duration of the experiment resulted in no significant change in dye uptake during the hypoxic exposure.
DISCUSSION
The present study has characterized the electrophysiological properties of NECs in the gills of goldfish and identified four types of ion channels in the plasma membrane. Our results reveal important differences in ion channel expression in chemoreceptors of goldfish, compared with previous studies in other fish species (Burleson et al. 2006; Jonz et al. 2004; Qin et al. 2010). We have also demonstrated the O2 sensitivity of goldfish NECs and confirm a role for intracellular Ca2+ in hypoxic signaling. Although an O2-sensitive current was not observed in whole cell patch-clamp experiments, NECs with an intact cytosol responded to hypoxia with increased [Ca2+]i and synaptic vesicle activity.
Ion channels of goldfish NECs.
The electrophysiological properties of respiratory chemoreceptors in water-breathing vertebrates have been studied in only two species: zebrafish (Jonz et al. 2004; Qin et al. 2010) and channel catfish (Burleson et al. 2006). In zebrafish, whole cell current is primarily attributable to O2-sensitive background K+ (KB) channels, similar to those observed in mammalian type I cells of the carotid body (Buckler 1997; Buckler et al. 2000). The present study demonstrates that goldfish NECs express a notably different array of ion channels than those of zebrafish. Whole cell patch-clamp recordings from isolated goldfish NECs showed that depolarization activated a Ca2+-dependent K+ current (IKCa). This current resembled that of Ca2+-activated K+ (KCa) channels, as peak IKCa approximately corresponded with inward Ca2+ current. In addition, IKCa was activated by preloading cells with Ca2+ and was blocked by Cd2+. KCa channels have been described in mammalian O2 chemoreceptors, such as carotid body type I cells from neonatal and adult rat (López-López et al. 1997; Peers 1990; Peers and OʼDonnell 1990), adult rabbit (López-López et al. 1993), and in chromaffin cells (Solaro et al. 1995). Unlike peak IKCa in type I cells, which may exceed 600 pA (López-López et al. 1997; Peers and OʼDonnell 1990), IKCa in goldfish NECs was relatively small. Although a subpopulation of NECs in zebrafish may express KCa (Jonz et al. 2015), KCa channels are typically not observed in whole cell recordings of NECs in zebrafish or channel catfish (Jonz et al. 2004; Burleson et al. 2006; Qin et al. 2010).
The K+ current remaining after application of Cd2+ was rapidly activating and inactivating, and resembled a transient “A-type” K+ conductance (IA) (Chen et al. 2006; Hoffman et al. 1997). Current through A-type channels in excess of 1 nA at depolarized potentials has also been observed in rabbit carotid body and contributes to O2-sensitive K+ current (Sanchez et al. 2002). Further experiments, however, are required to confirm the presence of IA currents in goldfish NECs and identify which members of the A-type subfamily may be present.
Application of voltage-gated K+ and Ca2+ channel blockers TEA, 4-AP, and Cd2+ further revealed the presence of an openly rectifying K+ current, as is observed through KB channels in carotid body type I cells (Buckler 1997) and in gill NECs of zebrafish (Jonz et al. 2004), where they provide an important step in O2 transduction. Goldfish and zebrafish NECs have approximately equal levels of KB current and Cm (see also Jonz et al. 2004), and, therefore, would have roughly equal KB current density, and NECs of both preparations display IKB of relatively equal amplitude compared with type I cells (Buckler 1997).
Oxygen sensitivity of goldfish NECs.
Under whole cell patch-clamp, NECs of goldfish did not respond to hypoxia (Po2: ~11 mmHg). This is despite the fact that the level of hypoxia used in the present study was lower than that used previously to stimulate zebrafish NECs during whole cell recording (Po2: ~25 mmHg), which showed a half maximal inhibition of IKB at Po2 ~60 mmHg (Jonz et al. 2004). We did not observe a change in isolated IKB or IKCa in whole cell current-voltage relationships in goldfish NECs exposed to hypoxia. Although IKCa was not pharmacologically isolated, a lack of response of this dominant current argues against any O2 sensitivity in whole cell recording. Moreover, Vm did not change in response to hypoxia under current-clamp, while hypoxia induced membrane depolarization in zebrafish NECs (Jonz et al. 2004; Qin et al. 2010).
The whole cell patch-clamp technique involves opening of the plasma membrane by suction and dialysis of the cell to replace the cytosol with intracellular solution from the recording electrode. By contrast, during Ca2+ imaging and FM 1-43 uptake experiments, in which NECs responded to hypoxia, the membrane and cytosol are left undisturbed. One interpretation of the results from patch-clamp vs. imaging experiments is that dialyzed whole cell recording may have had a negative impact on, or even eliminated, a critical intracellular signaling mechanism, rendering the cells insensitive to hypoxia. In electrophysiological studies in rat type I cells, O2 sensitivity of KB and KCa channels was lost when inside-out membrane patches were excised from the cell (Buckler et al. 2000; Wyatt and Peers 1995), indicating the involvement of a cytosolic factor or messenger. Likewise, O2-sensitive KB channels from glossopharyngeal neurons (Campanucci et al. 2003), and KCa channels from cortical neurons (Rodgers-Garlick et al. 2013), failed to respond to hypoxia when the cytosol was dialyzed or lost. More recently, evidence was presented in mouse type I cells that hypoxia acts through complex I of the electron transport chain and leads to production of reactive oxygen species and NADH accumulation, both of which may inhibit membrane K+ channels (Fernández-Agüera et al. 2015).
In the case of zebrafish NECs, retention of O2 sensitivity during patch-clamp recording suggests that at least part of the mechanism responsible for mediating hypoxic inhibition of KB channels is membrane delimited (Jonz et al. 2004). Although more recent evidence suggests that H2S may act as an O2 sensor in zebrafish NECs (Porteus et al. 2014), which may require an intact cytosol. In goldfish, a membrane-delimited mechanism may not be involved in O2 sensing. It remains a possibility that application of the perforated-patch technique, which preserves the cytosol and O2 sensitivity in rat type I cells (Buckler et al. 2000; Wyatt and Peers 1995), may permit recording of ion channel inhibition by hypoxia in goldfish NECs; however, our attempts to apply this technique have thus far been unsuccessful due to the high series resistance (Rs) of goldfish NECs under these conditions, which typically reached Rs > 50 MΩ in perforated patches (Zachar P. and Jonz M., unpublished observations).
In Ca2+ imaging experiments, exposure of goldfish NECs to hypoxia led to an increase in R340/380, which is proportional to [Ca2+]i. The profile of the increase in [Ca2+]i in goldfish resembled “type A” responses observed in NECs of trout in response to ammonia (a respiratory gas in fish; Zhang et al. 2011), with a delayed onset and a moderate peak. An increase in [Ca2+]i is characteristic of the response to hypoxia in mammalian type I cells (Buckler 1997; Kumar and Prabhakar 2012; Montoro et al. 1996), but in those studies, onset was rapid and more pronounced compared with goldfish, and [Ca2+]i remained elevated for the duration of the hypoxic exposure. The slow rise in [Ca2+]i in the present experiments may also have been the result of the slow removal of O2 from the recording chamber during perfusion with hypoxic solution.
Vesicular activity also increased in goldfish NECs in response to 2 min of hypoxia, as observed using the fluorescent dye FM 1-43. As the primary mode of uptake of FM 1-43 into the cytosol is through vesicular recycling associated with neurotransmitter release (Betz et al. 1992; Tegenge et al. 2012), this indicates an increase in vesicular activity, and presumably neurosecretion, induced by hypoxia. Furthermore, application of the nonspecific Ca2+ channel blocker Cd2+, as well as the L-type Ca2+ channel blocker nifedipine, abolished the increase in FM 1-43 fluorescence in response to hypoxia. Additionally, we confirmed the presence of Ca2+ channels in goldfish NECs by patch-clamp recording in Ba2+ solution, and NEC depolarization by high K+ solution caused an increase in [Ca2+]i that was similar to that of hypoxia. These data demonstrate that vesicular activity in goldfish NECs is dependent upon extracellular Ca2+ entry, likely through L-type Ca2+ channels. These findings also suggest that the rise in [Ca2+]i observed in our Ca2+ imaging experiments may have been due to influx of extracellular Ca2+.
Implications for oxygen sensing and the physiological significance of goldfish NECs.
We present here a proposed model of O2 sensing in goldfish NECs, based on the present data and previous studies. An O2 sensor detects a drop in Po2, resulting in the inhibition of KB channels and depolarization of the plasma membrane, as inferred from previous studies on fish NECs (Burleson et al. 2006; Jonz et al. 2004; Qin et al. 2010). Once Vm is reduced, L-type Ca2+ channels activate, allowing for influx of Ca2+ and an increase in [Ca2+]i. The increase in [Ca2+]i will facilitate vesicular fusion and release of neurotransmitter (e.g., 5-HT; Jonz and Nurse 2003; Saltys et al. 2006). In addition, Ca2+ ions will activate KCa channels.
We propose that activation of KCa may blunt or diminish the response to hypoxia in goldfish NECs by increasing K+ permeability and repolarizing the plasma membrane. This may account for our observation from Ca2+ imaging experiments, in which reversal of elevated [Ca2+]i occurred before the hypoxic stimulus was removed. Activation of hyperpolarizing K+ current during hypoxic stimulation may have returned Vm to resting levels and led to deactivation of Ca2+ channels and reduced Ca2+ influx. In a similar manner, activation of KCa channels contributes to membrane repolarization in mammalian neurons and vasculature (Alger and Williamson 1988; Lancaster and Nicoll 1987; Roberts et al. 2013), although they are also believed to play a role in the hypoxic response in the carotid body (Peers et al. 2010). In contrast to the present experiments in goldfish, membrane depolarization in zebrafish NECs was maintained for as long as hypoxia was applied (Jonz et al. 2004; Qin et al. 2010), and elevation of [Ca2+]i by sodium sulfide (used to directly stimulate NECs by release of hydrogen sulfide) also persisted for as long as the stimulus was applied (Porteus et al. 2014). Future experiments aimed at further characterizing KCa in NECs may illuminate this aspect of the proposed mechanism and whether these channels may contribute to the delay in the hyperventilatory response to hypoxia in goldfish, which occurs at a relatively depressed Po2 compared with zebrafish (Tzaneva et al. 2011; Vulesevic et al. 2006). Given the evolutionary history of the anoxia-tolerant goldfish and other members of the Cyprinidae family, where prolonged exposure to extreme hypoxia is not uncommon, such a blunting of the hyperventilatory response to acute hypoxia may help to protect NECs from excessive stimulation, depletion of ATP stores, and Ca2+-induced excitotoxicity.
Conclusion.
This study constitutes the first characterization of ion channels and O2 sensitivity in respiratory chemoreceptors of an anoxia-tolerant vertebrate. Unlike NECs of zebrafish, goldfish NECs displayed a membrane current dominated by KCa channels. The Ca2+ imaging and FM 1-43 data suggest that goldfish NECs use an influx of extracellular Ca2+ through L-type Ca2+ channels to trigger neurosecretion during hypoxic stimulation. Future studies may reveal whether Ca2+ sensitivity of KCa may contribute to anoxia tolerance in goldfish and which, if any, membrane ion channels are involved in transduction of the hypoxic stimulus. Goldfish NECs will serve as an important model for understanding the role of peripheral chemoreceptors in the control of ventilation in anoxia-tolerant vertebrates.
GRANTS
This research was supported by the Natural Sciences and Engineering Research Council of Canada (Grant 342303), the Canadian Foundation for Innovation, and the Ontario Research Fund (Grant 16589).
DISCLOSURES
No conflicts of interest, financial or otherwise, are declared by the authors.
AUTHOR CONTRIBUTIONS
P.C.Z. and M.G.J. conceived and designed research; P.C.Z. and W.P. performed experiments; P.C.Z., W.P., and M.G.J. analyzed data; P.C.Z., W.P., and M.G.J. interpreted results of experiments; P.C.Z., W.P., and M.G.J. prepared figures; P.C.Z. and M.G.J. drafted manuscript; P.C.Z., W.P., and M.G.J. edited and revised manuscript; P.C.Z., W.P., and M.G.J. approved final version of manuscript.
REFERENCES
- Abdallah SJ, Jonz MG, Perry SF. Extracellular H+ induces Ca2+ signals in respiratory chemoreceptors of zebrafish. Pflügers Arch 467: 399–413, 2015. doi: 10.1007/s00424-014-1514-2. [DOI] [PubMed] [Google Scholar]
- Alger BE, Williamson A. A transient calcium-dependent potassium component of the epileptiform burst after-hyperpolarization in rat hippocampus. J Physiol 399: 191–205, 1988. doi: 10.1113/jphysiol.1988.sp017075. [DOI] [PMC free article] [PubMed] [Google Scholar]
- Betz WJ, Mao F, Bewick GS. Activity-dependent fluorescent staining and destaining of living vertebrate motor nerve terminals. J Neurosci 12: 363–375, 1992. [DOI] [PMC free article] [PubMed] [Google Scholar]
- Bickler PE, Buck LT. Hypoxia tolerance in reptiles, amphibians, and fishes: life with variable oxygen availability. Annu Rev Physiol 69: 145–170, 2007. doi: 10.1146/annurev.physiol.69.031905.162529. [DOI] [PubMed] [Google Scholar]
- Bright GR, Agani FH, Haque U, Overholt JL, Prabhakar NR. Heterogeneity in cytosolic calcium responses to hypoxia in carotid body cells. Brain Res 706: 297–302, 1996. doi: 10.1016/0006-8993(95)01122-6. [DOI] [PubMed] [Google Scholar]
- Buckler KJ. A novel oxygen-sensitive potassium current in rat carotid body type I cells. J Physiol 498: 649–662, 1997. doi: 10.1113/jphysiol.1997.sp021890. [DOI] [PMC free article] [PubMed] [Google Scholar]
- Buckler KJ. TASK channels in arterial chemoreceptors and their role in oxygen and acid sensing. Pflügers Arch 467: 1013–1025, 2015. doi: 10.1007/s00424-015-1689-1. [DOI] [PMC free article] [PubMed] [Google Scholar]
- Buckler KJ, Williams BA, Honoré E. An oxygen-, acid- and anaesthetic-sensitive TASK-like background potassium channel in rat arterial chemoreceptor cells. J Physiol 525: 135–142, 2000. doi: 10.1111/j.1469-7793.2000.00135.x. [DOI] [PMC free article] [PubMed] [Google Scholar]
- Burgess A, Vigneron S, Brioudes E, Labbé JC, Lorca T, Castro A. Loss of human Greatwall results in G2 arrest and multiple mitotic defects due to deregulation of the cyclin B-Cdc2/PP2A balance. Proc Natl Acad Sci USA 107: 12564–12569, 2010. doi: 10.1073/pnas.0914191107. [DOI] [PMC free article] [PubMed] [Google Scholar]
- Burggren WW. “Air gulping” improves blood oxygen transport during aquatic hypoxia in the goldfish Carrasius auratus. Physiol Zool 55: 327–334, 1982. doi: 10.1086/physzool.55.4.30155860. [DOI] [Google Scholar]
- Burleson ML, Mercer SE, Wilk-Blaszczak MA. Isolation and characterization of putative O2 chemoreceptor cells from the gills of channel catfish (Ictalurus punctatus). Brain Res 1092: 100–107, 2006. doi: 10.1016/j.brainres.2006.03.085. [DOI] [PubMed] [Google Scholar]
- Campanucci VA, Fearon IM, Nurse CA. A novel O2-sensing mechanism in rat glossopharyngeal neurones mediated by a halothane-inhibitable background K+ conductance. J Physiol 548: 731–743, 2003. doi: 10.1113/jphysiol.2002.035998. [DOI] [PMC free article] [PubMed] [Google Scholar]
- Chen X, Yuan LL, Zhao C, Birnbaum SG, Frick A, Jung WE, Schwarz TL, Sweatt JD, Johnston D. Deletion of Kv4.2 gene eliminates dendritic A-type K+ current and enhances induction of long-term potentiation in hippocampal CA1 pyramidal neurons. J Neurosci 26: 12143–12151, 2006. doi: 10.1523/JNEUROSCI.2667-06.2006. [DOI] [PMC free article] [PubMed] [Google Scholar]
- Dunel-Erb S, Bailly Y, Laurent P. Neuroepithelial cells in fish gill primary lamellae. J Appl Physiol Respir Environ Exerc Physiol 53: 1342–1353, 1982. [DOI] [PubMed] [Google Scholar]
- Fernández-Agüera MC, Gao L, González-Rodríguez P, Pintado CO, Arias-Mayenco I, García-Flores P, García-Pergañeda A, Pascual A, Ortega-Sáenz P, López-Barneo J. Oxygen sensing by arterial chemoreceptors depends on mitochondrial complex I signaling. Cell Metab 22: 825–837, 2015. doi: 10.1016/j.cmet.2015.09.004. [DOI] [PubMed] [Google Scholar]
- Golowasch J, Thomas G, Taylor AL, Patel A, Pineda A, Khalil C, Nadim F. Membrane capacitance measurements revisited: dependence of capacitance value on measurement method in nonisopotential neurons. J Neurophysiol 102: 2161–2175, 2009. doi: 10.1152/jn.00160.2009. [DOI] [PMC free article] [PubMed] [Google Scholar]
- González C, Almaraz L, Obeso A, Rigual R. Carotid body chemoreceptors: from natural stimuli to sensory discharges. Physiol Rev 74: 829–898, 1994. [DOI] [PubMed] [Google Scholar]
- Hoffman DA, Magee JC, Colbert CM, Johnston D. K+ channel regulation of signal propagation in dendrites of hippocampal pyramidal neurons. Nature 387: 869–875, 1997. doi: 10.1038/43119. [DOI] [PubMed] [Google Scholar]
- Jonz MG. Oxygen Sensing (4th ed.). In: The Physiology of Fishes, edited by Evans D, Claiborne JB, Currie S. Boca Raton, FL: CRC Press, 2014. [Google Scholar]
- Jonz MG, Fearon IM, Nurse CA. Neuroepithelial oxygen chemoreceptors of the zebrafish gill. J Physiol 560: 737–752, 2004. doi: 10.1113/jphysiol.2004.069294. [DOI] [PMC free article] [PubMed] [Google Scholar]
- Jonz MG, Nurse CA. Neuroepithelial cells and associated innervation of the zebrafish gill: a confocal immunofluorescence study. J Comp Neurol 461: 1–17, 2003. doi: 10.1002/cne.10680. [DOI] [PubMed] [Google Scholar]
- Jonz MG, Nurse CA. Oxygen-sensitive neuroepithelial cells in the gills of aquatic vertebrates. In: Airway Chemoreceptors in the Vertebrates, edited by Zaccone G, Cutz E, Adriawnsen D, Nurse CA, Mauceri A. Enfield, NH: Science Publishers, 2009, p. 1–30. doi: 10.1201/b10181-3. [DOI] [Google Scholar]
- Jonz MG, Zachar PC, Da Fonte DF, Mierzwa AS. Peripheral chemoreceptors in fish: a brief history and a look ahead. Comp Biochem Physiol A Mol Integr Physiol 186: 27–38, 2015. doi: 10.1016/j.cbpa.2014.09.002. [DOI] [PubMed] [Google Scholar]
- Kumar P, Prabhakar NR. Peripheral chemoreceptors: function and plasticity of the carotid body. Compr Physiol 2: 141–219, 2012. [DOI] [PMC free article] [PubMed] [Google Scholar]
- Lancaster B, Nicoll RA. Properties of two calcium-activated hyperpolarizations in rat hippocampal neurones. J Physiol 389: 187–203, 1987. doi: 10.1113/jphysiol.1987.sp016653. [DOI] [PMC free article] [PubMed] [Google Scholar]
- López-Barneo J, López-López JR, Ureña J, González C. Chemotransduction in the carotid body: K+ current modulated by Po2 in type I chemoreceptor cells. Science 241: 580–582, 1988. doi: 10.1126/science.2456613. [DOI] [PubMed] [Google Scholar]
- López-Barneo J, Macías D, Platero-Luengo A, Ortega-Sáenz P, Pardal R. Carotid body oxygen sensing and adaptation to hypoxia. Pflugers Arch 468: 59–70, 2016. doi: 10.1007/s00424-015-1734-0. [DOI] [PubMed] [Google Scholar]
- López-López JR, De Luis DA, Gonzalez C. Properties of a transient K+ current in chemoreceptor cells of rabbit carotid body. J Physiol 460: 15–32, 1993. doi: 10.1113/jphysiol.1993.sp019456. [DOI] [PMC free article] [PubMed] [Google Scholar]
- López-López JR, González C, Pérez-García MT. Properties of ionic currents from isolated adult rat carotid body chemoreceptor cells: effect of hypoxia. J Physiol 499: 429–441, 1997. doi: 10.1113/jphysiol.1997.sp021939. [DOI] [PMC free article] [PubMed] [Google Scholar]
- Milsom WK, Burleson ML. Peripheral arterial chemoreceptors and the evolution of the carotid body. Respir Physiol Neurobiol 157: 4–11, 2007. doi: 10.1016/j.resp.2007.02.007. [DOI] [PubMed] [Google Scholar]
- Mojet MH, Mills E, Duchen MR. Hypoxia-induced catecholamine secretion in isolated newborn rat adrenal chromaffin cells is mimicked by inhibition of mitochondrial respiration. J Physiol 504: 175–189, 1997. doi: 10.1111/j.1469-7793.1997.175bf.x. [DOI] [PMC free article] [PubMed] [Google Scholar]
- Montoro RJ, Ureña J, Fernández-Chacón R, Alvarez de Toledo G, López-Barneo J. Oxygen sensing by ion channels and chemotransduction in single glomus cells. J Gen Physiol 107: 133–143, 1996. doi: 10.1085/jgp.107.1.133. [DOI] [PMC free article] [PubMed] [Google Scholar]
- Peers C. Hypoxic suppression of K+ currents in type I carotid body cells: selective effect on the Ca2+-activated K+ current. Neurosci Lett 119: 253–256, 1990. doi: 10.1016/0304-3940(90)90846-2. [DOI] [PubMed] [Google Scholar]
- Peers C, O’Donnell J. Potassium currents recorded in type I carotid body cells from the neonatal rat and their modulation by chemoexcitatory agents. Brain Res 522: 259–266, 1990. doi: 10.1016/0006-8993(90)91470-2. [DOI] [PubMed] [Google Scholar]
- Peers C, Wyatt CN, Evans AM. Mechanisms for acute oxygen sensing in the carotid body. Respir Physiol Neurobiol 174: 292–298, 2010. doi: 10.1016/j.resp.2010.08.010. [DOI] [PubMed] [Google Scholar]
- Perry SF, Jonz MG, Gilmour KM. Oxygen sensing and the hypoxic ventilatory response. In: Fish Physiology, edited by Richards JG, Farrell AP, Brauner CJ. New York, NY: Academic, 2009, vol. 27. [Google Scholar]
- Piskuric NA, Nurse CA. Effects of chemostimuli on [Ca2+]i responses of rat aortic body type I cells and endogenous local neurons: comparison with carotid body cells. J Physiol 590: 2121–2135, 2012. doi: 10.1113/jphysiol.2012.229468. [DOI] [PMC free article] [PubMed] [Google Scholar]
- Porteus CS, Abdallah SJ, Pollack J, Kumai Y, Kwong RW, Yew HM, Milsom WK, Perry SF. The role of hydrogen sulphide in the control of breathing in hypoxic zebrafish (Danio rerio). J Physiol 592: 3075–3088, 2014. doi: 10.1113/jphysiol.2014.271098. [DOI] [PMC free article] [PubMed] [Google Scholar]
- Qin Z, Lewis JE, Perry SF. Zebrafish (Danio rerio) gill neuroepithelial cells are sensitive chemoreceptors for environmental CO2. J Physiol 588: 861–872, 2010. doi: 10.1113/jphysiol.2009.184739. [DOI] [PMC free article] [PubMed] [Google Scholar]
- Roberts OL, Kamishima T, Barrett-Jolley R, Quayle JM, Dart C. Exchange protein activated by cAMP (Epac) induces vascular relaxation by activating Ca2+-sensitive K+ channels in rat mesenteric artery. J Physiol 591: 5107–5123, 2013. doi: 10.1113/jphysiol.2013.262006. [DOI] [PMC free article] [PubMed] [Google Scholar]
- Rodgers-Garlick CI, Hogg DW, Buck LT. Oxygen-sensitive reduction in Ca2+-activated K+ channel open probability in turtle cerebrocortex. Neuroscience 237: 243–254, 2013. doi: 10.1016/j.neuroscience.2013.01.046. [DOI] [PubMed] [Google Scholar]
- Saltys HA, Jonz MG, Nurse CA. Comparative study of gill neuroepithelial cells and their innervation in teleosts and Xenopus tadpoles. Cell Tissue Res 323: 1–10, 2006. doi: 10.1007/s00441-005-0048-5. [DOI] [PubMed] [Google Scholar]
- Sanchez D, López-López JR, Pérez-García MT, Sanz-Alfayate G, Obeso A, Ganfornina MD, González C. Molecular identification of Kvalpha subunits that contribute to the oxygen-sensitive K+ current of chemoreceptor cells of the rabbit carotid body. J Physiol 542: 369–382, 2002. doi: 10.1113/jphysiol.2002.018382. [DOI] [PMC free article] [PubMed] [Google Scholar]
- Schoenmakers TJ, Visser GJ, Flik G, Theuvenet AP. CHELATOR: an improved method for computing metal ion concentrations in physiological solutions. Biotechniques 12: 870–874, 1992. [PubMed] [Google Scholar]
- Solaro CR, Prakriya M, Ding JP, Lingle CJ. Inactivating and noninactivating Ca2+- and voltage-dependent K+ current in rat adrenal chromaffin cells. J Neurosci 15: 6110–6123, 1995. [DOI] [PMC free article] [PubMed] [Google Scholar]
- Solsona C, Innocenti B, Fernández JM. Regulation of exocytotic fusion by cell inflation. Biophys J 74: 1061–1073, 1998. doi: 10.1016/S0006-3495(98)74030-5. [DOI] [PMC free article] [PubMed] [Google Scholar]
- Tegenge MA, Böhnel H, Gessler F, Bicker G. Neurotransmitter vesicle release from human model neurons (NT2) is sensitive to botulinum toxin A. Cell Mol Neurobiol 32: 1021–1029, 2012. doi: 10.1007/s10571-012-9818-2. [DOI] [PMC free article] [PubMed] [Google Scholar]
- Tzaneva V, Gilmour KM, Perry SF. Respiratory responses to hypoxia or hypercapnia in goldfish (Carassius auratus) experiencing gill remodelling. Respir Physiol Neurobiol 175: 112–120, 2011. doi: 10.1016/j.resp.2010.09.018. [DOI] [PubMed] [Google Scholar]
- Vulesevic B, McNeill B, Perry SF. Chemoreceptor plasticity and respiratory acclimation in the zebrafish Danio rerio. J Exp Biol 209: 1261–1273, 2006. doi: 10.1242/jeb.02058. [DOI] [PubMed] [Google Scholar]
- Wilkie MP, Pamenter ME, Alkabie S, Carapic D, Shin DS, Buck LT. Evidence of anoxia-induced channel arrest in the brain of the goldfish (Carassius auratus). Comp Biochem Physiol C Toxicol Pharmacol 148: 355–362, 2008. doi: 10.1016/j.cbpc.2008.06.004. [DOI] [PubMed] [Google Scholar]
- Wyatt CN, Peers C. Ca2+-activated K+ channels in isolated type I cells of the neonatal rat carotid body. J Physiol 483: 559–565, 1995. doi: 10.1113/jphysiol.1995.sp020606. [DOI] [PMC free article] [PubMed] [Google Scholar]
- Zachar PC, Jonz MG. Neuroepithelial cells of the gill and their role in oxygen sensing. Respir Physiol Neurobiol 184: 301–308, 2012. doi: 10.1016/j.resp.2012.06.024. [DOI] [PubMed] [Google Scholar]
- Zhang L, Nurse CA, Jonz MG, Wood CM. Ammonia sensing by neuroepithelial cells and ventilatory responses to ammonia in rainbow trout. J Exp Biol 214: 2678–2689, 2011. doi: 10.1242/jeb.055541. [DOI] [PubMed] [Google Scholar]


