Abstract.
There is an increasing demand for imaging tools in clinical dermatology that can perform in vivo wide-field morphological and functional examination from surface to deep tissue regions at various skin sites of the human body. The conventional spectral-domain optical coherence tomography-based angiography (SD-OCTA) system is difficult to meet these requirements due to its fundamental limitations of the sensitivity roll-off, imaging range as well as imaging speed. To mitigate these issues, we demonstrate a swept-source OCTA (SS-OCTA) system by employing a swept source based on a vertical cavity surface-emitting laser. A series of comparisons between SS-OCTA and SD-OCTA are conducted. Benefiting from the high system sensitivity, long imaging range, and superior roll-off performance, the SS-OCTA system is demonstrated with better performance in imaging human skin than the SD-OCTA system. We show that the SS-OCTA permits remarkable deep visualization of both structure and vasculature (up to penetration) with wide field of view capability (up to ), enabling a more comprehensive assessment of the morphological features as well as functional blood vessel networks from the superficial epidermal to deep dermal layers. It is expected that the advantages of the SS-OCTA system will provide a ground for clinical translation, benefiting the existing dermatological practice.
Keywords: optical coherence tomography, medical and biological imaging, imaging systems, functional monitoring and imaging
1. Introduction
Based on the principle of Michelson interferometry, optical coherence tomography (OCT) is developed for obtaining in vivo cross sectional and volumetric images of biological tissue with micron-scale resolution in real-time.1,2 In addition, OCT is a noncontact and noninvasive imaging modality, making it a preferred technology for biomedical imaging applications. Since the eye is highly optically transparent and easily accessible for optical imaging, OCT has shown unique advantages as a diagnostic and monitoring tool for ophthalmology. In dermatology, the gold standard method for clinical assessment is skin biopsy, which is, however, invasive and may cause many side effects including pain, bleeding, scarring, and risk of infection.3 It is difficult for follow-up studies in order to monitor the skin changes and evaluate the treatment effects. In this regard, the OCT may be an excellent alternative for dermatological applications. The first OCT skin imaging was reported in 1997, demonstrating impressive visualization of the skin structures, such as stratum corneum, stratum lucidum, living epidermis, papillary dermis, and sweat duct.4 Early dermatological OCT studies were focused on the morphological information,5,6 which are often not sufficient for understanding the pathology of many skin diseases.
Recently, the introduction of OCT-based angiography (OCTA)7–10 has allowed the in vivo visualization of three-dimensional (3-D) vascular networks by measuring the dynamic changes resulted from the moving blood cells in functional blood vessels. Due to its fast, noninvasive, safe, and cost-effective characteristics, the modality of OCTA has rapidly made its way to clinical translation in the field of ophthalmology for the diagnosis and evaluation of various diseases, such as glaucoma, diabetic retinopathy, and age-related macular degeneration.11,12 Compared to the relatively optical transparent ocular tissue, skin tissue is however highly optical scattering to the incoming OCT beam. This high optical scattering property limits the penetration of light into deeper skin layers, which perhaps is an important factor that restricts the current clinical translation of OCTA to dermatology. Moreover, the skin diseases could happen at any location of human body and may occupy a large area, often with uneven surface topology. In this scenario, to further expand the applications of OCTA in dermatology, it requires sophisticated systems with the capacities of high sensitivity, fast speed, long imaging range, wide field of view (FOV) as well as flexible access to different skin sites.
Compared to the first generation of OCT, i.e., time-domain OCT (TD-OCT), which generates interferogram by scanning reference arm, the Fourier-domain OCT (FD-OCT) with stationary reference arm has been proven to possess significant advantages in its sensitivity and imaging speed,13,14 accelerating the development of OCT technology for many practical applications. The techniques of FD-OCT can be generally categorized into two types. One is the spectral-domain OCT (SD-OCT), which employs a broadband light source and spatially samples the spectral interferogram by a linear array of detectors, e.g., a linear scan camera.15 The other is swept-source OCT (SS-OCT) which utilizes wavelength scanning laser and temporally detects the spectral interferogram by photodetectors.16 Currently, SD-OCT is the most widely used system, mainly due to the matured technology in broadband superluminescent source and fast line-scan camera. The excellent stability in both amplitude and phase also makes it more popular for functional visualization and statistical analysis. However, there are several drawbacks of SD-OCT that limit its potential development in clinical dermatology.
First of all, due to the pixel width of camera and line density of optical grating, the spectral resolution of the spectrometer in SD-OCT is relatively poor, which leads to rapid sensitivity drop-off within a few millimeters. The skin with uneven surface may experience the variant OCT sensitivity at different spatial locations, leading to the visualization of information at deep axial positions not uniform. Second, the pixel number of the commercial line-scan camera is relatively small, providing only a few thousand sampling points (typically 1 to 2 k) to record the spectrum. Thus, the imaging range is limited within a few millimeters, which often requires the imaging region of interest to be a flat and smooth skin area. Moreover, the imaging speed of SD-OCT is difficult to be further improved due to the fundamental limitation of the camera. To the best of our knowledge, the fastest speed of the commercial line-scan InGaAs cameras is . For functional skin imaging, it is time-consuming and hard to provide sufficient sampling for wide FOV.17 On the other hand, the development of swept source demonstrates great potential to overcome these limitations. The instantaneous line width of swept source is the key parameter to determine the coherence length as well as the roll-off performance in SS-OCT. Many swept-source techniques such as amplified optical time-stretch, Fourier-domain mode-locked lasers, and polygon scanner-based filter have sufficient narrow line width to achieve more than 20-mm coherence length.18–20 The vertical-cavity surface-emitting laser (VCSEL) and akinetic swept source are operated in single longitudinal mode, generating unprecedented coherence length and sensitivity roll-off over tens centimeter or even in meter range.21,22 In addition, benefiting from the telecommunication technology, the photodetectors and digitizers are now capable of achieving ultrahigh speed data acquisition in excess of GHz or even tens GHz bandwidth.21–23 The large amount of sampling points for interferogram in SS-OCT permits extremely long imaging range (over multicentimeter range), favorable for skin imaging applications that require wide FOV. As for imaging speed, the techniques of swept source have achieved significant developments over the past decade, improving the sweeping rate from hundreds kHz24–26 to multi-MHz.18,27–32 These high-speed SS-OCT systems is of great potential to reduce the acquisition time and increase the sampling density over a large imaging area. In addition, the implementation of dual balanced detection in SS-OCT is of more compact size, providing higher sensitivity as well as dynamic range by suppressing the common mode noise.
In this study, we report our newly developed SS-OCTA that employs a VCSEL swept laser, with an ultimate aim for translating it to the field of dermatology. A handheld scanning probe is utilized for easy access to different skin sites on human. To demonstrate its advantages, a series of comparisons between the SS-OCTA and conventional SD-OCTA has been made, including basic sensitivity roll-off performance, detailed assessment of normal and abnormal skin sites, and bulk skin tissue with uneven surfaces.
2. Material and Methods
2.1. Experimental Setup of SS-OCTA System for Dermatology
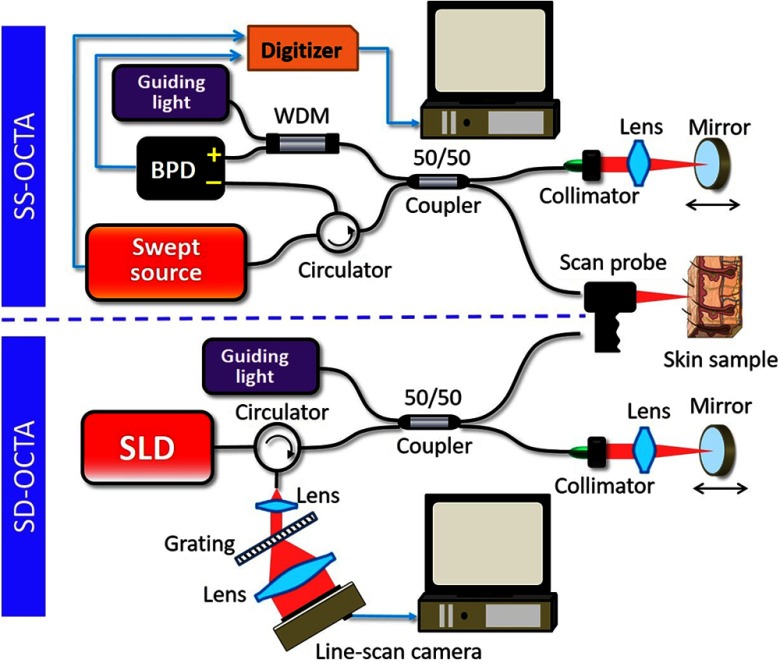
The schematic of SS-OCTA system for dermatology is illustrated in the top panel of Fig. 1. We employed a high-speed broadband VCSEL swept laser (SL1310V1-20048, Thorlabs, Inc.) based on microelectromechanical systems (MEMS) technology, which is capable of 200 kHz sweeping rate with a wavelength tuning range centered at 1300 nm. This swept source also provided a precise A-line trigger and optical clock for linear -space sampling, generated by a built-in Mach–Zehnder interferometer (MZI) with 48 mm delay. The light from the laser was delivered into a fiber-based Michelson interferometer via an optical fiber circulator. A broadband 50:50 fiber coupler split the beam into the reference arm and sample arm. In the reference arm, the light was focused on the reference mirror by the lens and then coupled back into the fiber through a collimator. The lens and mirror were mounted on a precision translation stage so that the optical path length difference can be fine-tuned between the reference and sample arms. A compact handheld scan probe was used to capture the OCT images of skin, which was convenient and flexible to access different parts of human body. The incident power on the sample was 5 mW, which is below the FDA safe limit for skin imaging. A guiding light with 635 nm wavelength was also coupled in the interferometer by a wavelength-division multiplexing (WDM) to provide the aiming beam for OCT scanning. The backreflected and backscattered light from the reference arm and sample arm were combined to generate spectral interferometric fringes and then detected by a balanced photodetector with 400 MHz bandwidth. A high-speed digitizer (ATS9360, AlazarTech, Inc.) was utilized to record the OCT signals, which provided 12-bit resolution with up to sampling rate. The OCT interferogram data were transmitted to a host computer through eight-lane PCI-Express Gen2 interface.
Fig. 1.
Experimental setup of the SS-OCTA system and the SD-OCTA system for dermatology imaging applications. BPD, balanced photodetector; WDM, wavelength-division multiplexing; and SLD, superluminescent diode.
In order to show the advantages of SS-OCTA in skin imaging, we also purposely established an SD-OCT system for imaging performance comparison. The bottom panel of Fig. 1 shows the setup of the SD-OCTA system used in this study. The light source was a broadband superluminescent diode (SLD) with 85-nm full-width at half-maximum bandwidth centered at 1310 nm, which is similar to that of the swept laser in the SS-OCTA system. To make a fair comparison, we also kept the incident power on the sample at 5 mW by controlling the current value of the SLD. The configuration of fiber-based Michelson interferometer was the same as the SS-OCTA system, except for the detection part as well as the light source. In the spectrometer, an InGaAs line-scan camera (GL2048R, Sensors Unlimited) with 2048 pixel-array was utilized to capture the OCT interferometric fringes, capable of running at different line rates up to 147 kHz. The raw OCT data were streamed to a host computer by a Camera Link® interface. To ensure the consistent imaging region and imaging condition, the SD-OCTA system and SS-OCTA system shared the same handheld scan probe by simply switching the fiber in the sample arm. Both the SD-OCTA system and SS-OCTA system were automatically controlled on LabVIEW platform.
2.2. Imaging Protocols and Algorithms
For all of the OCTA images in this paper, we adopted the ultrahigh sensitive optical microangiography (OMAG) scanning protocol as described in Refs. 33 and 34, where four repeated B-scans were taken at the same B-scan position to extract the dynamic change of blood flow from static tissue. The galvo scanner situated in the handheld probe was driven by a saw tooth waveform with 80% duty circle in the fast axis ( direction) and a step function waveform in the slow axis ( direction). The B frame rate of both SD-OCTA system and SS-OCTA system was set at 160 Hz, providing the same time interval of 6.3 ms to achieve high flow sensitivity down to capillary level. After the imaging acquisition, we processed the OCT data offline on the platform of MATLAB®. To construct the blood flow image, we applied the algorithm of complex OMAG,33 which performed a differential operation of the complex OCT information between the repeated B frames. Since the algorithm of complex OMAG is phase sensitive and the MEMS-VCSEL swept source has severe phase noise due to unstable wavelength sweeping and the synchronization time jitter, an additional fully automatic and numerical technique based on phase gradient algorithm was utilized to compensate the phase error for the SS-OCTA data processing.35 The imaging FOV, A-line speed of the SD-OCTA system and the objective lens in the handheld probe are variable for the requirements of different dermatological examinations.
The OCTA imaging of human skin by the home-built systems was reviewed and approved by the Institutional Review Board of University of Washington, and the informed consent was obtained from all subjects before imaging. This study followed the tenets of the Declaration of Helsinki and was conducted in compliance with the Health Insurance Portability and Accountability Act.
3. Results
3.1. Sensitivity Roll-Off Performance
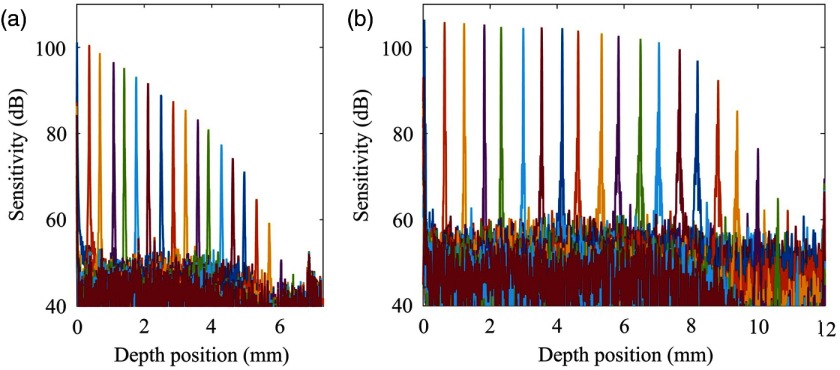
By tuning the optical delay using the translation stage in the reference arms, we generated the system sensitivity roll-off curves for the SD-OCTA system and SS-OCTA system, respectively, the results of which are shown in Fig. 2. With the full spectral span of centered at 1310 nm wavelength and 2048 pixel-array in the line-scan camera, the imaging range of the SD-OCTA system was 7.3 mm. The spectral resolution of the SD-OCTA system was , which is determined by the configuration of the spectrometer, such as the pixel width of the line-scan camera, the line density of the dispersive grating, and the waist and incident angel of the optical beam. With 5-mW optical power in the sample arm and 147 kHz A-line rate, the measured sensitivity of the SD-OCTA system was at the position close to zero-delay line. However, as shown in Fig. 2(a), the increase of the depth position makes the OCT sensitivity to drop quickly, largely due to the relatively limited spectral resolution in the spectrometer. Although the A-line speed of SS-OCTA system was 200 kHz (higher than the SD-OCTA system), the measured sensitivity was 105 dB near the zero-delay line, which is still better than SD-OCTA system. This is largely attributed to the high efficiency of the dual balanced photodetector, fast acquisition speed of the A/D card, and the narrow line width of the laser. The digitizer was run at external clock mode using the optical clock from the swept laser to provide linear sampling. The optical clock was generated by the built-in MZI with 48-mm optical delay, resulting in 12 mm imaging range with 2560 sampling points per spectrum. Since the MEMS-VCSEL laser is operated in single longitudinal mode, the instantaneous linewidth is extremely narrow (),36 leading to an ultralong coherence length. As shown in Fig. 2(b), the sensitivity is maintained at within the depth range of 8 mm. The sudden sensitivity drop beyond the distance of 8 mm is due to the bandwidth limitation of the balanced photodetector that was only 400 MHz, which can be still further improved if a higher bandwidth of balanced detector is employed.21,37 The comparison between the two systems as shown in Fig. 2 demonstrates that the SS-OCTA system has a longer imaging range with higher sensitivity and better roll-off performance, which would greatly benefit the wide-field imaging of human skin (see below).
Fig. 2.
Comparison of system sensitivity roll-off between (a) SD-OCT system and (b) SS-OCT system.
3.2. OCTA Imaging and Comparison on Normal Skin
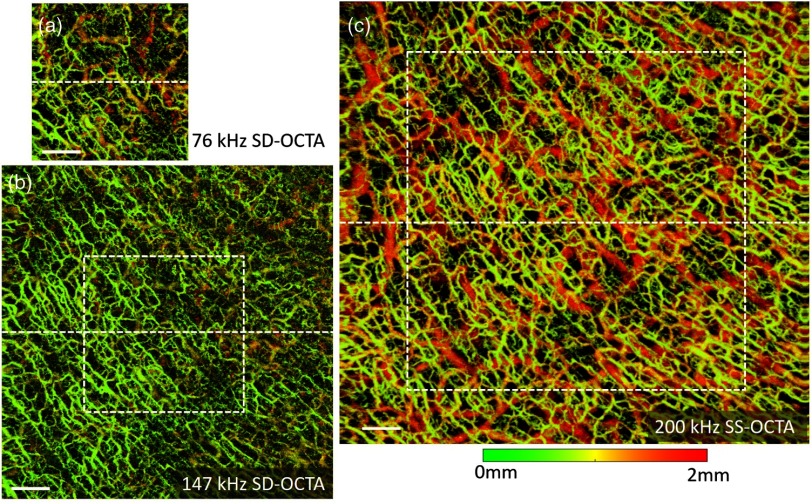
After the assessment of the system sensitivity roll-off, we further compared the in vivo dermatological OCTA imaging between these two systems. We first performed the dermatological OCTA imaging on a normal skin sample. Here, the palm skin of a healthy volunteer’s right hand was selected. To enhance the optical penetration, a drop of glycerol solution covered with a thin glass slide was applied on the human skin for refractive-index matching.38 Figure 3 shows the en face maximum intensity projections (MIPs) of the vascular networks, color coded by depth, captured by the SD-OCTA system and the SS-OCTA system, respectively. In the handheld probe, we employed an objective lens with 36-mm focal length, which provided lateral resolution. The sampling spacing of these images was in and directions for a fine visualization of both the structure and vasculature of human skin. Since the line-scan camera is capable of running at different speed, we set two imaging A-line rates for the SD-OCTA system. One imaging speed was 76 kHz as shown in Fig. 3(a), which is a typical imaging speed for most SD-OCT systems for skin imaging. The other imaging speed was 147 kHz as shown in Fig. 3(b), which is the highest speed for a commercially available line-scan camera. With 160-Hz B frame rate and 80% fast scanning duty circle, the en face blood flow image [Fig. 3(a)] captured by 76 kHz A-line rate contains in and directions, covering an FOV of . While the 147-kHz SD-OCTA has more sampling pixels (), permitting a wider FOV () [Fig. 3(b)]. Although the lower A-line rate results in smaller FOV, it has longer integration time to collect more OCT photons emerging from the skin tissue. Thus, the 76-kHz SD-OCTA has higher sensitivity and better visualization of the deep blood vessels, compared with the 147-kHz SD-OCTA [comparing between Figs. 3(a) and 3(b)]. On the other hand, the SS-OCTA system was run at 200-kHz swept rate, which permitted the highest imaging speed in this study. With the same B frame rate and sampling spacing, the blood flow image [Fig. 3(c)] captured by this SS-OCTA system contained , providing a wide FOV of . Furthermore, due to the higher OCT sensitivity and better roll-off performance, the SS-OCTA system delivered impressive information about vascular networks, where not only the small blood vessels located at the superficial layer (in green color) are observed but also the big vessels permeating the deep dermal layers (in red color) are visualized.
Fig. 3.
The en face OCTA images with color coded by depth in the region of human palm (right hand), scanned by SD-OCT and SS-OCT, respectively. (a) The vascular image taken by the SD-OCTA system running at 76 kHz with FOV. (b) The vascular image taken by the SD-OCTA system running at 147 kHz with FOV. (c) The image taken by the SS-OCTA system with 200 kHz A-line rate and FOV. The white dashed box in (b) corresponds to imaging area in (a), while the white dashed box in (c) corresponds to the imaging area in (b). The white scale bar is 1 mm.
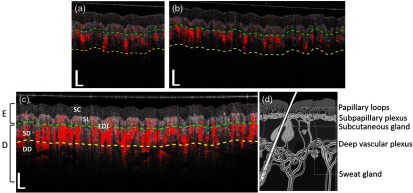
Figure 4 shows the representative cross sectional images of both the structure (gray color) and vasculature (red color) at the position indicated by the white dashed lines in Fig. 3. The top two images [Figs. 4(a) and 4(b)] were taken by the SD-OCTA system with 76- and 147-kHz A-line rate, respectively, whereas the bottom one [Fig. 4(c)] was from the SS-OCTA system. In these images, the physiological structures of stratum corneum, stratum lucidum, epidermal–dermal junction, and dermal tissue are clearly observed. The green dashed line separates the epidermis from dermis. We also draw a yellow dashed line, which is deeper than the green dashed line. The structure and the blood flows under the yellow dashed line are almost invisible for the 147-kHz SD-OCTA system. With lower imaging speed, the 76-kHz SD-OCTA system has slightly better visualization in this deeper region. Due to the much higher system sensitivity in deep axial position (Fig. 2), the SS-OCTA system demonstrates remarkable penetration depth in the skin [Fig. 4(c)], giving more internal details where we are able to clearly identify the tissue structure as well as functional blood vessels innervating the deep dermal layer. For comparison, Fig. 4(d) is a schematic diagram of skin, illustrating the structure and vasculature at different depths of the skin. The cover glass in Fig. 4(c) looks blurred and thicker than that in SD-OCT images, which is due to the side-lobe artifact in the point spread function of the SS-OCT system, resulting from the top-hat-shaped spectrum of VCSEL laser.
Fig. 4.
Typical cross sectional B-scans of OCT structure (gray) overlaid with blood flow signals (red). Shown are the B-scans obtained at the location indicated by the white dashed lines in Figs. 3(a) and 3(b) are from SD-OCT running at (a) 76 and (b) 147 kHz, respectively. (c) is from SS-OCT running at 200 kHz. (d) Schematic drawing of the structure and vasculature of skin. E, epidermis; D, dermis; SC, stratum corneum; SL, stratum lucidum; EDJ, epidermal–dermal junction; SD, superficial dermis; and DD, deep dermis. The white vertical and horizontal scale bars are 0.5 mm.
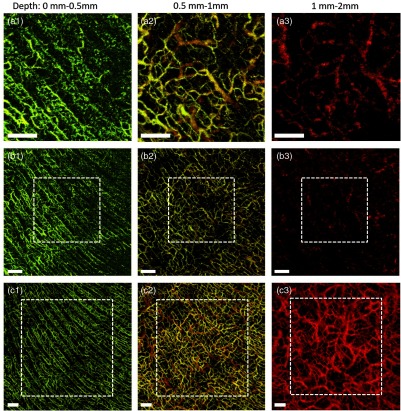
We further generated the blood perfusion maps of the human palm for different depth layers (Fig. 5). In doing so, we used a proprietary automatic segmentation software39 to segment the 3-D images into depth resolved physiological layers. The images list from top to bottom in Fig. 5 correspond to the 76-kHz SD-OCTA, 147-kHz SD-OCTA, and 200-kHz SS-OCTA, respectively. They have different FOVs as described in Fig. 3, which are also indicated by the white dashed boxes here. The images of Fig. 5 listed from left to right demonstrate the vascular networks in three-depth layers. The first layer is from 0 to 0.5 mm measured from skin surface, which represents the epidermis layer above the green dashed line in Fig. 4. Both the SD-OCTA system and SS-OCTA system can show the rich epidermal vascular plexus, including capillary loops permeating this layer. The vessel diameter is relatively small and the vascular pattern coincides well with the palm print of the volunteer. The second layer is from 0.5 to 1 mm, which depicts the superficial dermis layer between the green dashed line and yellow dashed line in Fig. 4. The vessels in the superficial dermis layer are mainly the interconnecting vessels, which are clearly visualized by these OCTA systems. But the image brightness generated by the SD-OCTA system is weaker than that by the SS-OCTA system. The third layer is the deep dermal layer from 1 to 2 mm, which is under the yellow line in Fig. 4. The blood vessels in this deep region are termed as deep vascular plexus, which have relatively larger diameter to supply nutrition for skin metabolism. The image taken by 147-kHz SD-OCTA system [Fig. 5(b3)] is difficult to identify the deep vascular plexus. With slower imaging speed that improved the sensitivity, the 76-kHz SD-OCTA system has better image quality for these large vessels [Fig. 5(a3)] but still is not sufficient to provide good visualization for them. Using the 200-kHz SS-OCTA system, we are able to achieve superior OCT sensitivity in the deep axial position, resulting in the best visualization for the deep vascular plexus as shown in Fig. 5(c3). The large vessels as well as some interconnecting vessels are clearly observed, providing more comprehensive vascular information that may be useful to understand skin pathology for clinical applications. The comparison of the vascular networks in different skin layers demonstrates the advantages of the SS-OCTA system over the SD-OCTA system in imaging skin blood perfusion, providing a potential opportunity for dermatological diseases diagnosis and treatment monitoring.
Fig. 5.
The en face OCTA images of the human palm displayed for different depth layers. The top images (a1–a3), middle images (b1–b3), and bottom images (c1–c3) correspond to Figs. 3(a)–3(c), respectively. The left images (a1–c1) are the blood perfusion maps of the depth layer from 0 to 0.5 mm, while the middle images (a2–c2) are from 0.5 to 1 mm and the right images (a3–c3) are from 1 to 2 mm, respectively. The white .
3.3. OCTA Imaging and Comparison on Benign Nevus
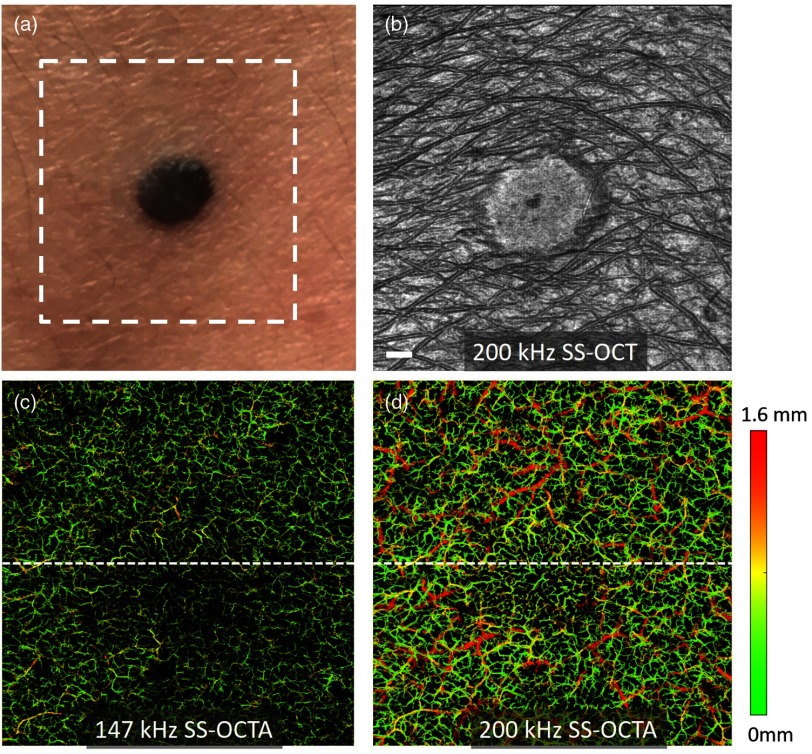
An examination of the abnormal skin site was also conducted by the two OCTA systems. Figure 6(a) shows the photograph of a black nevus with diameter on the dorsal forearm of a volunteer. The white dashed box in this figure is the region of interest to perform the OCTA imaging, which has an FOV of . To cover this large area, the SD-OCTA system was running at 147 kHz. The imaging protocol including the B frame rate, repetition number, sampling points, refractive-index matching for skin, and scanning lens in the handheld probe was the same as described above. Figure 6(b) is the en face structural image taken by the SS-OCTA system, where we can clearly observe the position and boundary of the nevus, the curves of the epidermal ridges as well as the hair on the skin. The SD-OCTA system delivered very similar results for the en face structural image, thus not presented here. Figures 6(c) and 6(d) are the en face vascular networks at this skin site measured by both SD-OCTA and SS-OCTA. With the color coded by depth, the vascular imaging capabilities of the two systems are different. The SD-OCTA can identify the blood vessels in the superficial skin layer from 0 to , where the green color is dominated in Fig. 6(c). On the contrary, the SS-OCTA has better visualization of deep vasculature, where the small vessels in the superficial skin layer as well as the large vessels in deep dermal layer are delineated by the color from green to red as shown in Fig. 6(d). It is interesting to observe that the blood vessels in the nevus have less density and different vascular patterns compared to the surrounding normal skin region, indicating that the nevus is a living skin tissue but with less metabolic activities.
Fig. 6.
OCTA images the microvascular networks permeating a benign nevus. (a) The photograph of the skin with a nevus. (b) The en face structural image by the SS-OCTA system for the skin area indicated by the white dashed box in (a). (c) and (d) are the en face vascular images with color coded in depth of the same skin area by the SD-OCTA and SS-OCTA, respectively. The . The FOV of the OCTA images is .
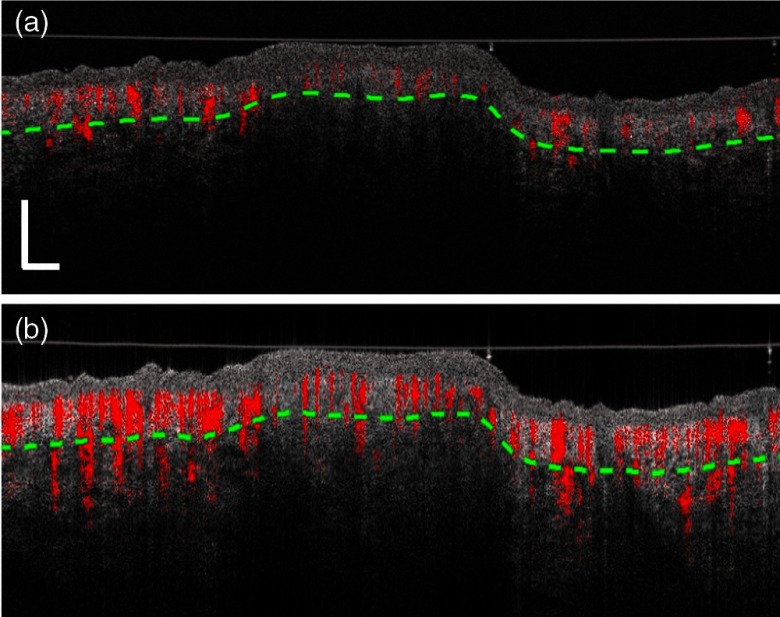
Figure 7 shows the two-dimensional (2-D) B-scan images of the structure (gray) combined with the vasculature (red) measured by the two systems at the position indicated by the white dashed lines in Fig. 6. Compared to the skin of the human palm as shown in Fig. 4, the stratum corneum is thinner in the dorsal forearm. The bump in the middle part of the images is the black benign nevus. Although there are rich pigments in the nevus, both systems are able to visualize the dermis tissue within the nevus. As expected, the SD-OCTA has less penetration into the deep region of the skin [shown in Fig. 7(a)], while the SS-OCTA has much stronger OCT signals, resulting in better visualization in the deep dermal layer for both the normal skin part and the nevus area [shown in Fig. 7(b)]. The imaging capability of the blood vessels is also greatly affected by the strength of OCT signals. Thus, the blood flow signals in the nevus region are weaker and the vessels in the deep dermal layer are more difficult to be observed in the SD-OCTA, whereas the SS-OCTA provides much better imaging quality.
Fig. 7.
Typical 2-D cross sectional B-scan images of the skin structure (gray) overlaid with blood vessels (red) captured by (a) SD-OCTA and (b) SS-OCTA, respectively. The vertical and horizontal scale bars are 1 mm.
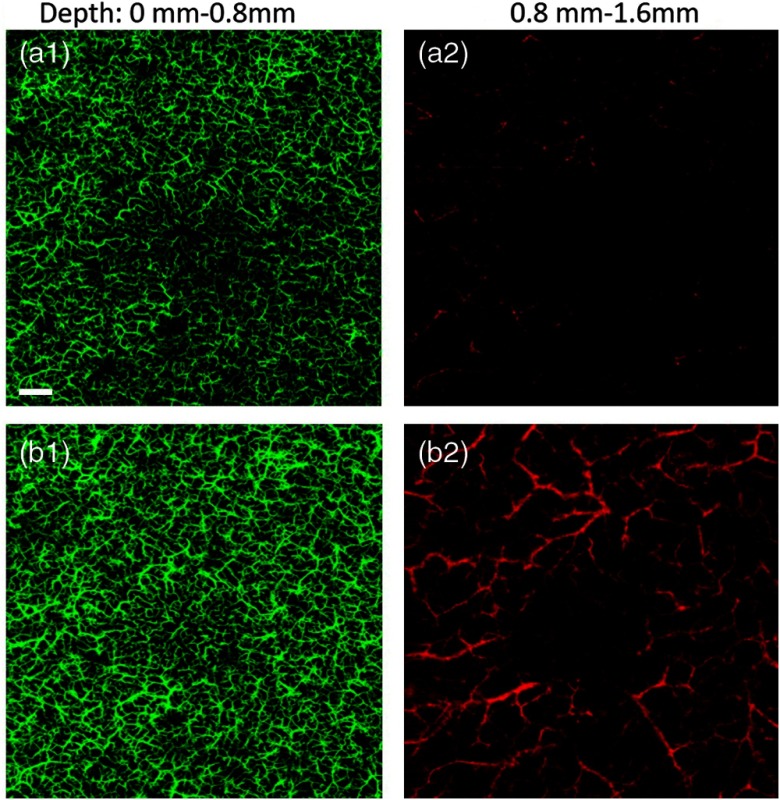
We also generated the en face blood perfusion maps of the nevus by the two systems at different depth layers as shown in Fig. 8. The skin was separated into two layers by the green dashed lines in Fig. 7: the superficial skin layer from 0 to 0.8 mm depth and the deep dermal layer from 0.8 to 1.6 mm. The blood vessels in the first layer are given in green color, and the vessels in the second layer are shown in red color. Both SD-OCTA and SS-OCTA are capable of seeing rich superficial vascular plexus within the first skin layer albeit the SS-OCTA has better image contrast and clarity. As for the deep dermal vascular plexus, the SS-OCTA demonstrates better visualization than the SD-OCTA. The networks of large blood vessels are clearly identified by the SS-OCTA [shown in Fig. 8(b2)], whereas they are barely visualized with low contrast and SNR by the SD-OCTA system [shown in Fig. 8(a2)]. The segmentation of the blood vessels in different layers of the skin provides insightful information of the cutaneous circulation in nevus, where the SS-OCTA demonstrates obvious advantages in skin assessments over the SD-OCTA system.
Fig. 8.
The en face vascular networks of the skin with a benign nevus for the superficial layer from 0 to 0.8 mm (a1 and b1) and the deep layer from 0.8 to 1.6 mm (a2 and b2), respectively. The top panel: SD-OCTA. Bottom panel: SS-OCTA. The .
3.4. OCTA Imaging and Comparison on Human Finger
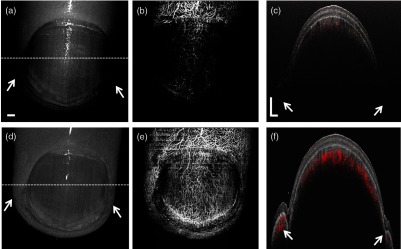
To further illustrate the advantage of the SS-OCTA, we also conducted comparison between the two systems for a human finger, which is more complex in terms of its topological features, i.e., uneven surface. The depth locations of the finger skin could vary by several millimeters or even centimeter range that challenges OCTA imaging if the system ranging distance is limited. In this case, the SD-OCTA system was running at its maximum speed of 147 kHz to generate more sampling points. The B frame rate, number of repetition, and data size are the same as described above. A long focal length (110 mm) lens with wide diameter was used in the handheld scan probe, providing a lateral resolution of . The imaging FOV was to cover the area of the whole fingertip. The top images in Fig. 9 are taken by the 147-kHz SD-OCTA system while the bottom images are captured by the 200-kHz SS-OCTA system. The en face structural images (left column) help us identify different parts of the fingertip including the nail plate, lunula, cuticle, eponychium, and proximal nail fold. Pointed by the yellow arrows, the lateral nail folds are clearly presented by the SS-OCTA system; however, they are invisible by the SD-OCTA system due to its rapid sensitivity roll-off along the depth and limited ranging distance. The brightness of finger structure in Fig. 9(d) is relatively uniform, but some parts in Fig. 9(a) are dark, which may result in misleading information when interpreting the fingertip morphology. The middle column images are the en face MIPs of the vascular networks of the fingertip. The SD-OCTA system is able to see the blood vessels in the area of proximal nail fold, where it is relatively flat and close to the zero-depth position. But the vessels under the nail plate are partly or barely observed due to the relatively poor OCT signals. Using the SS-OCTA system, the entire cutaneous circulation networks of the dorsal fingertip are visualized in a single scan [shown in Fig. 9(e)], including the vessels under thick nail plate, in the lateral nail fold, and the distal edge. The 2-D cross sectional images on the right column also verify the imaging capabilities of these two systems well. The lateral nail folds, as indicated by the white arrows, are located in deep axial position, where it is almost invisible by the SD-OCTA system. The nail plate has a thickness of thickness, which also attenuates the OCT light, leading to relatively weak blood flow signal in the SD-OCTA system. As shown in Fig. 9(f), the profile of the fingertip is visualized from the top of the nail plate to the bottom of lateral nail folds, which has depth range. The blood vessels in the skin dermis under the thick nail as well as in the lateral nail folds at deep positions are also well identified. This improvement of the visualization for both morphology and functional vasculature promises the SS-OCTA as a useful tool for clinical translation, since the human finger is an important health indicator that relates to many diseases, such as diabetes, anemia, thyroid, malnutrition, etc.17,40
Fig. 9.
The images of human fingertip captured by SD-OCTA system (top) and SS-OCTA system (bottom), respectively. (a) and (d) show the en face MIPs of the structure. The middle images (b and e) show the en face vascular networks. (c) and (f) are the cross sectional images of structure (gray) overlaid with blood vessels (red) at the position indicated by the white dashed lines in (a) and (d), respectively. The FOV is . The vertical and horizontal scale bars are 1 mm.
4. Discussion and Conclusions
We have conducted a series of imaging at various skin sites for comparison of performances between SD-OCTA and SS-OCTA systems. Employing one of the most advanced commercial line-scan cameras in the spectrometer, the SD-OCTA system has achieved good imaging performance among this type of system. However, it is still difficult to meet the requirements for various dermatological applications. Note that the current SD-OCTA system employed an SLD light source with wider spectral bandwidth that gives a better axial resolution than our previous SD-OCTA system reported in Ref. 17. The configuration of the spectrometer was modified to cover such a broadband spectrum, making the spectral resolution worse () in the current setup. Particularly, the system was designed with an intention to extend the ranging distance (7.3 mm) to serve our purpose of comparing to SS-OCTA for wide field imaging. These factors together led to degraded roll-off performance when compared with our previous SD-OCTA setup where the ranging distance was merely about 3 mm.
The proposed SS-OCTA system has demonstrated distinct advantages over the SD-OCTA system in terms of the A-line rate, system sensitivity, roll-off performance, and imaging range. Moreover, the SS-OCTA system has great potential to be further improved through practical implementations. For example, the -clock sampling points could be increased for a longer imaging range by extending the delay distance in the MZI. A faster balanced photodetector as well as higher-speed digitizer would also benefit the sensitivity roll-off and the imaging range for the SS-OCTA system so that the sensitivity would not have a sudden drop at depth position in this study (Fig. 2). The recent work has shown an unprecedented imaging range with superior roll-off performance over multiple centimeters or even in meter range.21,22,41 The MEMS-VCSEL swept laser has been reported to achieve higher imaging speed,27,42 which could provide more sampling points for wide-field OCTA imaging. It should be noted that the light source of the MEMS-VCSEL swept laser was used for our demonstration of the SS-OCTA advantages. It was selected due to the availability of this light source in the lab. There are other alternative swept laser sources, for example, insight digitally swept laser sources21,26,41 that would equally deliver the same advantages as we demonstrated here.
We adopted a phase-sensitive algorithm of complex OMAG that utilized both the magnitude and phase to extract the blood flow information from static tissue. The system phase reproducibility is important to create high-quality blood flow images. While the SD-OCTA system is inherently phase stable, the SS-OCTA system based on MEMS-VCSEL swept source suffers from severe sweeping instability and synchronization time jitter. A number of techniques have been proposed to improve the SS-OCT stability including using a common path interferometer43 or implementing a phase reference arm44,45 for phase compensation, building an MZI-based optical clock to resample the interferogram in linear space and introducing a fixed wavenumber reference signal to correct the time jitter.46,47 In this study, we applied a fully numerical technique based on phase gradient algorithm without additional hardware implementation, which is a robust method to greatly reduce the phase noise in generic SS-OCT systems. With the continuous advancements in the development of a stable swept laser, it is expected that any phase compensation methods would become redundant for the future implementation of SS-OCTA systems.
This study has shown high-quality structural and vascular images for human skin tissue. Due to the high sensitivity over multiple millimeter range, the SS-OCTA system can achieve deeper visualization compared to the SD-OCTA system. Note that penetration depth in tissue is still fundamentally limited by the optical scattering and absorption of skin tissue, resulting in a practical imaging depth of in the skin for the SS-OCTA imaging. The swept laser with longer wavelengths or more advanced optical clearing techniques48,49 might be helpful to further increase the imaging depth. The multimodal system that combines the OCTA with other imaging modalities such as photoacoustic imaging, ultrasound, and magnetic resonance imaging would be promising to show complementary information of tissue physiology from the surface down to deep skin regions, which can be of great value in the disease diagnosis and therapeutic treatment.50–52 Nevertheless, the SS-OCTA system provides a detailed examination of human skin for up to imaging depth, containing not only the morphological information but also the functional blood flow information. The cutaneous circulation system is valuable in the estimation of the metabolic activities within the skin tissue. More future analysis of the OCT data, such as attenuation assessment, vessels tracking, and vessels quantification of density, diameter, and connectivity, would be also of great value for the diagnosis of skin disease pathology and treatment monitoring.
In summary, we have implemented a high-performance SS-OCTA system for human skin imaging. The light source we selected here was an MEMS-VCSEL swept laser centered at 1300 nm with 100 nm spectrum bandwidth, providing as fast as 200-kHz A-line rate with narrow instantaneous linewidth. We also established a conventional SD-OCTA system for imaging performance comparison. Per the assessment of system roll-off curves, the SS-OCTA system can achieve 12 mm imaging range with more than 100-dB sensitivity over depth position, much better than the SD-OCTA system. We also performed practical imaging using these two systems on the normal and abnormal skins with a benign nevus, where we have shown that the SS-OCTA system permitted more comprehensive structural and vascular examination from the superficial skin layer to deep dermal layer for up to 2 mm in depth. The imaging of a whole fingertip further demonstrated the advantages of SS-OCTA for large-volume skin imaging with uneven surface topology over the SD-OCTA system. The superior performance delivered by the SS-OCTA system is promising to benefit the clinical applications in dermatology.
Acknowledgments
This work was supported in part by grants from the National Heart, Lung, and Blood Institute (R01 HL093140), the National Eye Institute (R01 EY024158) and an unrestricted grant from the Research to Prevent Blindness, Inc., New York, NY. The content is solely the responsibility of the authors and does not necessarily represent the official views of grant-giving bodies.
Biography
Biographies for the authors are not available.
Disclosures
At the current stage, the authors declare no financial conflict of interest.
References
- 1.Huang D., et al. , “Optical coherence tomography,” Science 254, 1178–1181 (1991). 10.1126/science.1957169 [DOI] [PMC free article] [PubMed] [Google Scholar]
- 2.Tomlins P. H., Wang R., “Theory, developments and applications of optical coherence tomography,” J. Phys. D 38, 2519–2535 (2005). 10.1088/0022-3727/38/15/002 [DOI] [Google Scholar]
- 3.Welzel J., “Optical coherence tomography in dermatology: a review,” Skin Res. Technol. 7, 1–9 (2001). 10.1034/j.1600-0846.2001.007001001.x [DOI] [PubMed] [Google Scholar]
- 4.Welzel J., et al. , “Optical coherence tomography of the human skin,” J. Am. Acad. Dermatol. 37, 958–963 (1997). 10.1016/S0190-9622(97)70072-0 [DOI] [PubMed] [Google Scholar]
- 5.Sattler E., Kästle R., Welzel J., “Optical coherence tomography in dermatology,” J. Biomed. Opt. 18, 061224 (2013). 10.1117/1.JBO.18.6.061224 [DOI] [PubMed] [Google Scholar]
- 6.Gambichler T., Jaedicke V., Terras S., “Optical coherence tomography in dermatology: technical and clinical aspects,” Arch. Dermatol. Res. 303, 457–473 (2011). 10.1007/s00403-011-1152-x [DOI] [PubMed] [Google Scholar]
- 7.Wang R. K., “Optical microangiography: a label-free 3-D imaging technology to visualize and quantify blood circulations within tissue beds in vivo,” IEEE J. Sel. Top. Quantum Electron. 16, 545–554 (2010). 10.1109/JSTQE.2009.2033609 [DOI] [PMC free article] [PubMed] [Google Scholar]
- 8.Zhang A. Q., et al. , “Methods and algorithms for optical coherence tomography-based angiography: a review and comparison,” J. Biomed. Opt. 20, 100901 (2015). 10.1117/1.JBO.20.10.100901 [DOI] [PMC free article] [PubMed] [Google Scholar]
- 9.Gao S. S., et al. , “Optical coherence tomography angiographyoptical coherence tomography angiography,” Invest. Ophthalmol. Visual Sci. 57, OCT27–OCT36 (2016). 10.1167/iovs.15-19043 [DOI] [PMC free article] [PubMed] [Google Scholar]
- 10.Chen C.-L., Wang R. K., “Optical coherence tomography based angiography,” Biomed. Opt. Express 8, 1056–1082 (2017). 10.1364/BOE.8.001056 [DOI] [PMC free article] [PubMed] [Google Scholar]
- 11.Roisman L., et al. , “Optical coherence tomography angiography of asymptomatic neovascularization in intermediate age-related macular degeneration,” Ophthalmology 123, 1309–1319 (2016). 10.1016/j.ophtha.2016.01.044 [DOI] [PMC free article] [PubMed] [Google Scholar]
- 12.Zhang Q. Q., et al. , “Wide-field optical coherence tomography based microangiography for retinal imaging,” Sci. Rep. 6, 22017 (2016). 10.1038/srep22017 [DOI] [PMC free article] [PubMed] [Google Scholar]
- 13.Choma M. A., et al. , “Sensitivity advantage of swept source and Fourier domain optical coherence tomography,” Opt. Express 11, 2183–2189 (2003). 10.1364/OE.11.002183 [DOI] [PubMed] [Google Scholar]
- 14.Leitgeb R., Hitzenberger C. K., Fercher A. F., “Performance of Fourier domain vs. time domain optical coherence tomography,” Opt. Express 11, 889–894 (2003). 10.1364/OE.11.000889 [DOI] [PubMed] [Google Scholar]
- 15.Hausler G., Lindner M. W., “‘Coherence radar’ and ‘spectral radar’-new tools for dermatological diagnosis,” J. Biomed. Opt. 3, 21–31 (1998). 10.1117/1.429899 [DOI] [PubMed] [Google Scholar]
- 16.Lexer F., et al. , “Wavelength-tuning interferometry of intraocular distances,” Appl. Opt. 36, 6548–6553 (1997). 10.1364/AO.36.006548 [DOI] [PubMed] [Google Scholar]
- 17.Xu J., et al. , “Scalable wide-field optical coherence tomography-based angiography for in vivo imaging applications,” Biomed. Opt. Express 7, 1905–1919 (2016). 10.1364/BOE.7.001905 [DOI] [PMC free article] [PubMed] [Google Scholar]
- 18.Xu J., et al. , “High-performance multi-megahertz optical coherence tomography based on amplified optical time-stretch,” Biomed. Opt. Express 6, 1340–1350 (2015). 10.1364/BOE.6.001340 [DOI] [PMC free article] [PubMed] [Google Scholar]
- 19.Adler D. C., et al. , “Extended coherence length Fourier domain mode locked lasers at 1310 nm,” Opt. Express 19, 20930–20939 (2011). 10.1364/OE.19.020930 [DOI] [PubMed] [Google Scholar]
- 20.Bräuer B., et al. , “Simple and versatile long range swept source for optical coherence tomography applications,” J. Opt. 17, 125301 (2015). 10.1088/2040-8978/17/12/125301 [DOI] [Google Scholar]
- 21.Song S. Z., Xu J. J., Wang R. K. K., “Long-range and wide field of view optical coherence tomography for in vivo 3D imaging of large volume object based on akinetic programmable swept source,” Biomed. Opt. Express 7, 4734–4748 (2016). 10.1364/BOE.7.004734 [DOI] [PMC free article] [PubMed] [Google Scholar]
- 22.Wang Z., et al. , “Cubic meter volume optical coherence tomography,” Optica 3, 1496–1503 (2016). 10.1364/OPTICA.3.001496 [DOI] [PMC free article] [PubMed] [Google Scholar]
- 23.Wang Z., et al. , “Silicon photonic integrated circuit swept-source optical coherence tomography receiver with dual polarization, dual balanced, in-phase and quadrature detection,” Biomed. Opt. Express 6, 2562–2574 (2015). 10.1364/BOE.6.002562 [DOI] [PMC free article] [PubMed] [Google Scholar]
- 24.Oh W. Y., et al. , “ repetition rate wavelength-swept laser and application to high-speed optical frequency domain imaging,” Opt. Lett. 35, 2919–2921 (2010). 10.1364/OL.35.002919 [DOI] [PMC free article] [PubMed] [Google Scholar]
- 25.Huber R., Wojtkowski M., Fujimoto J. G., “Fourier domain mode locking (FDML): a new laser operating regime and applications for optical coherence tomography,” Opt. Express 14, 3225–3237 (2006). 10.1364/OE.14.003225 [DOI] [PubMed] [Google Scholar]
- 26.Bonesi M., et al. , “Akinetic all-semiconductor programmable swept-source at 1550 nm and 1310 nm with centimeters coherence length,” Opt. Express 22, 2632–2655 (2014). 10.1364/OE.22.002632 [DOI] [PubMed] [Google Scholar]
- 27.Tsai T. H., et al. , “Ultrahigh speed endoscopic optical coherence tomography using micromotor imaging catheter and VCSEL technology,” Biomed. Opt. Express 4, 1119–1132 (2013). 10.1364/BOE.4.001119 [DOI] [PMC free article] [PubMed] [Google Scholar]
- 28.Wieser W., et al. , “Multi-megahertz OCT: high quality 3D imaging at 20 million A-scans and 4.5 GVoxels per second,” Opt. Express 18, 14685–14704 (2010). 10.1364/OE.18.014685 [DOI] [PubMed] [Google Scholar]
- 29.Xu J., et al. , “Megahertz all-optical swept-source optical coherence tomography based on broadband amplified optical time-stretch,” Opt. Lett. 39, 622–625 (2014). 10.1364/OL.39.000622 [DOI] [PubMed] [Google Scholar]
- 30.Fechtig D. J., et al. , “Line-field parallel swept source MHz OCT for structural and functional retinal imaging,” Biomed. Opt. Express 6, 716–735 (2015). 10.1364/BOE.6.000716 [DOI] [PMC free article] [PubMed] [Google Scholar]
- 31.Tozburun S., Siddiqui M., Vakoc B. J., “A rapid, dispersion-based wavelength-stepped and wavelength-swept laser for optical coherence tomography,” Opt. Express 22, 3414–3424 (2014). 10.1364/OE.22.003414 [DOI] [PMC free article] [PubMed] [Google Scholar]
- 32.Huo T., et al. , “Ultrahigh-speed optical coherence tomography utilizing all-optical 40 MHz swept-source,” J. Biomed. Opt. 20, 030503 (2015). 10.1117/1.JBO.20.3.030503 [DOI] [PubMed] [Google Scholar]
- 33.An L., Qin J., Wang R. K., “Ultrahigh sensitive optical microangiography for in vivo imaging of microcirculations within human skin tissue beds,” Opt. Express 18, 8220–8228 (2010). 10.1364/OE.18.008220 [DOI] [PMC free article] [PubMed] [Google Scholar]
- 34.Wang R. K., et al. , “Depth-resolved imaging of capillary networks in retina and choroid using ultrahigh sensitive optical microangiography,” Opt. Lett. 35, 1467–1469 (2010). 10.1364/OL.35.001467 [DOI] [PMC free article] [PubMed] [Google Scholar]
- 35.Song S., et al. , “Robust numerical phase stabilization for long-range swept-source optical coherence tomography,” J. Biophotonics 10, 1398–1410 (2017). 10.1002/jbio.201700034 [DOI] [PMC free article] [PubMed] [Google Scholar]
- 36.Halbritter H., et al. , “Linewidth and chirp of MEMS-VCSELs,” IEEE Photonics Technol. Lett. 18, 2180–2182 (2006). 10.1109/LPT.2006.884239 [DOI] [Google Scholar]
- 37.Zhang X., et al. , “Optical computing for optical coherence tomography,” Sci. Rep. 6, 37286 (2016). 10.1038/srep37286 [DOI] [PMC free article] [PubMed] [Google Scholar]
- 38.Wang R. K. K., et al. , “Concurrent enhancement of imaging depth and contrast for optical coherence tomography by hyperosmotic agents,” J. Opt. Soc. Am. B Opt. Phys. 18, 948–953 (2001). 10.1364/JOSAB.18.000948 [DOI] [Google Scholar]
- 39.Yin X., Chao J. R., Wang R. K., “User-guided segmentation for volumetric retinal optical coherence tomography images,” J. Biomed. Opt. 19, 086020 (2014). 10.1117/1.JBO.19.8.086020 [DOI] [PMC free article] [PubMed] [Google Scholar]
- 40.Williams M., “Examining the fingernails when evaluating presenting symptoms in elderly patients,” (2009), https://www.medscape.com/viewarticle/712251 (2 October 2017).
- 41.Xu J., et al. , “Wide field and highly sensitive angiography based on optical coherence tomography with akinetic swept source,” Biomed. Opt. Express 8, 420–435 (2017). 10.1364/BOE.8.000420 [DOI] [PMC free article] [PubMed] [Google Scholar]
- 42.Jayaraman V., et al. , “High-sweep-rate 1310 nm MEMS-VCSEL with 150 nm continuous tuning range,” Electron. Lett. 48, 867–869 (2012). 10.1049/el.2012.1552 [DOI] [PMC free article] [PubMed] [Google Scholar]
- 43.Adler D. C., Huber R., Fujimoto J. G., “Phase-sensitive optical coherence tomography at up to 370,000 lines per second using buffered Fourier domain mode-locked lasers,” Opt. Lett. 32, 626–628 (2007). 10.1364/OL.32.000626 [DOI] [PubMed] [Google Scholar]
- 44.Vakoc B. J., et al. , “Phase-resolved optical frequency domain imaging,” Opt. Express 13, 5483–5493 (2005). 10.1364/OPEX.13.005483 [DOI] [PMC free article] [PubMed] [Google Scholar]
- 45.Baumann B., et al. , “Total retinal blood flow measurement with ultrahigh speed swept source/Fourier domain OCT,” Biomed. Opt. Express 2, 1539–1552 (2011). 10.1364/BOE.2.001539 [DOI] [PMC free article] [PubMed] [Google Scholar]
- 46.Manapuram R., Manne V. G., Larin K., “Development of phase-stabilized swept-source OCT for the ultrasensitive quantification of microbubbles,” Laser Phys. 18, 1080–1086 (2008). 10.1134/S1054660X08090144 [DOI] [Google Scholar]
- 47.Choi W., et al. , “Phase-sensitive swept-source optical coherence tomography imaging of the human retina with a vertical cavity surface-emitting laser light source,” Opt. Lett. 38, 338–340 (2013). 10.1364/OL.38.000338 [DOI] [PMC free article] [PubMed] [Google Scholar]
- 48.Xu X., Wang R. K., “The role of water desorption on optical clearing of biotissue: studied with near infrared reflectance spectroscopy,” Med. Phys. 30, 1246–1253 (2003). 10.1118/1.1576228 [DOI] [PubMed] [Google Scholar]
- 49.Wang R. K., et al. , “Investigation of optical clearing of gastric tissue immersed with hyperosmotic agents,” IEEE J. Sel. Top. Quantum Electron. 9, 234–242 (2003). 10.1109/JSTQE.2003.813300 [DOI] [Google Scholar]
- 50.Yang Y., et al. , “Integrated optical coherence tomography, ultrasound and photoacoustic imaging for ovarian tissue characterization,” Biomed. Opt. Express 2, 2551–2561 (2011). 10.1364/BOE.2.002551 [DOI] [PMC free article] [PubMed] [Google Scholar]
- 51.Liu M., et al. , “Combined multi-modal photoacoustic tomography, optical coherence tomography (OCT) and OCT angiography system with an articulated probe for in vivo human skin structure and vasculature imaging,” Biomed. Opt. Express 7, 3390–3402 (2016). 10.1364/BOE.7.003390 [DOI] [PMC free article] [PubMed] [Google Scholar]
- 52.Liang C.-P., et al. , “Concurrent multiscale imaging with magnetic resonance imaging and optical coherence tomography,” J. Biomed. Opt. 18, 046015 (2013). 10.1117/1.JBO.18.4.046015 [DOI] [PMC free article] [PubMed] [Google Scholar]


