

An interaction-based fragmentation scheme for solving the issue of scalability in quantum refinement has been developed, implemented in the Q|R software and validated on an amyloid cross-β spine (PDB entry 2oNA).
Keywords: quantum refinement, fragmentation, graph clustering, Q|R#1
Abstract
Accurately refining biomacromolecules using a quantum-chemical method is challenging because the cost of a quantum-chemical calculation scales approximately as nm, where n is the number of atoms and m (≥3) is based on the quantum method of choice. This fundamental problem means that quantum-chemical calculations become intractable when the size of the system requires more computational resources than are available. In the development of the software package called Q|R, this issue is referred to as Q|R#1. A divide-and-conquer approach has been developed that fragments the atomic model into small manageable pieces in order to solve Q|R#1. Firstly, the atomic model of a crystal structure is analyzed to detect noncovalent interactions between residues, and the results of the analysis are represented as an interaction graph. Secondly, a graph-clustering algorithm is used to partition the interaction graph into a set of clusters in such a way as to minimize disruption to the noncovalent interaction network. Thirdly, the environment surrounding each individual cluster is analyzed and any residue that is interacting with a particular cluster is assigned to the buffer region of that particular cluster. A fragment is defined as a cluster plus its buffer region. The gradients for all atoms from each of the fragments are computed, and only the gradients from each cluster are combined to create the total gradients. A quantum-based refinement is carried out using the total gradients as chemical restraints. In order to validate this interaction graph-based fragmentation approach in Q|R, the entire atomic model of an amyloid cross-β spine crystal structure (PDB entry 2oNA) was refined.
1. Introduction
Crystallography is the dominant method for obtaining the atomic structure of a protein; however, it has recently been reported that a cryo-EM revolution is under way (Egelman, 2016 ▸; Kühlbrandt, 2014 ▸; Callaway, 2015 ▸). These two methods share a lot in common: for example, atomic model refinement is one of the common steps. Refinement is a process in which an approximate atomic model is made to match the experimentally measured data. Refinement uses a priori knowledge that is referred to as restraints. Refinement typically treats the data from diffraction or cryo-EM experiments (experimental data or data in the following) as being of primary importance. Restraints are only treated as a secondary concern used to compensate for the lack of data quality (such as finite resolution). In some (rather rare) cases the data quality may be sufficiently high that restraints are not used at all (for example, ultra-high-resolution data). In general, many iterations are required for refinement owing to the high dimensionality of biomacromolecules and often very approximate initial atomic models. This means that the computational cost of refining even moderately large systems can become an issue. The currently used parameterized restraints (Engh & Huber, 1991 ▸; Grosse-Kunstleve et al., 2004 ▸; Vagin et al., 2004 ▸) are often insufficient to maintain (or obtain) an accurate atomic model (Zheng, Reimers et al., 2017 ▸). Therefore, more accurately refining protein structures is an ongoing challenge, and deriving more accurate restraints is highly desirable.
Quantum-based refinement (QR) uses information directly from quantum-mechanical (QM) calculations, and is a promising alternative to standard refinement that uses static (library-based) parameterized restraints. This is especially true when only low-resolution data derived from experiments are available. A number of different approaches have already been reported, and a number of different implementations are available. Ryde and coworkers (Ryde, 2003 ▸; Ryde & Nilsson, 2003a ▸,b ▸; Nilsson et al., 2004 ▸), Merz and coworkers (Yu, Hayik et al., 2006 ▸; Yu, Li et al., 2006 ▸; Li et al., 2012 ▸; Fu et al., 2013 ▸; Borbulevych et al., 2014 ▸; Yu et al., 2005 ▸) and ourselves (Zheng, Reimers et al., 2017 ▸) have all developed quantum-based refinement programs. The method of Ryde and coworkers adds a molecular-mechanics (MM) description of the environment: a so-called hybrid QM/MM-based approach, which enables one to focus the computational resources around a site of interest. The approach of Merz and coworkers has been more focused on semiempirical methods, owing to semiempirical methods having inherently better scalability than ab initio quantum-chemical methods. Recently, we have initiated a fully ab initio quantum-refinement approach, in which we have showed the potential to improve an atomic model (albeit on a toy problem).
A major stumbling block towards the adoption of QR is the issue of computational scalability that is inherent in quantum-chemical methods (Titov et al., 2013 ▸). Performing an accurate and efficient quantum-chemical calculation for macromolecules remains one of the main challenges in computational chemistry. Fragmentation methods can provide an efficient route to effectively model large and complex molecular systems (Kitaura et al., 1999 ▸; He et al., 2014 ▸; Gordon et al., 2012 ▸; Fedorov & Kitaura, 2007 ▸). In order to use fragmentation methods, one needs a robust and computationally efficient method to partition a given system. In principle, any large system can be divided into smaller fragments, which can then be efficiently treated by quantum-mechanical methods. The structure of the entire system can be reconstructed by recombining the individual fragments (Canfield et al., 2006 ▸; Goerigk & Reimers, 2013 ▸). Therefore, we sought to develop a fragmentation-based approach in order to solve the scalability issue of quantum refinement.
2. Methods
In order to perform quantum-based crystallographic refinement of biomacromolecules, we recently developed a software package called Q|R (Zheng, Reimers et al., 2017 ▸). Q|R interfaces to the cctbx open-source project (Grosse-Kunstleve et al., 2002 ▸) to compute the various quantities needed for refinement. Q|R also interfaces to the ASE package (Bahn & Jacobsen, 2002 ▸) that contains wrappers to many modern quantum-chemical packages.
The procedure of our quantum refinement starts with a refined model using classic refinement [for example, phenix.refine (Afonine et al., 2012 ▸)] and experimental data, then we complete the model by adding any missing atoms and finally we perform quantum refinement of atomic coordinates in Q|R. The model-completion stage is essential because QM restraints cannot be obtained using models that have missing atoms. Our current implementation of Q|R does not perform any B-factor refinement. All B factors were refined using phenix.refine (Afonine et al., 2012 ▸) and then were kept unchanged during quantum refinement.
In order to validate the fragmentation-based quantum refinement, PDB entry 2oNA 1 (Sawaya et al., 2007 ▸) was chosen as a tractable test model. The selection criteria included small size (158 non-H atoms), medium resolution (2.03 Å), only amino acids in the macromolecule, space group P1 and potential for improvement (e.g. high clashscore or large R free–R work gap). The 2oNA model also contains strong crystal-packing effects, and we therefore refined this model to validate our fragmentation method.
2.1. Model preparation
QM calculations require a complete and correctly protonated atomic model. This may seem a trivial requirement; however, it is a matter of fact that most crystallographic models in the PDB (Berman et al., 2000 ▸; Bernstein et al., 1978 ▸) are atom-incomplete (for example, lacking H atoms, missing some side chains or parts thereof). H atoms are often missing in protein crystallographic models since their contribution to the scattering power is about six times smaller than the contribution from protein atoms (e.g. C, N, O), and the data quality (i.e. resolution) is almost always insufficient to provide experimental evidence for their positions. This is used as an argument to not include H atoms in atomic models. Also, low-resolution data may not allow some of the residue side chains to be resolved, particularly those located on the surface of the macromolecule or in flexible loops. Often such side chains are also not included in the atomic model. While including H atoms is advantageous (Chen et al., 2010 ▸; Afonine & Adams, 2012 ▸) but not mission-critical in standard protein refinement at most resolutions (a riding model can be used to account for H atoms implicitly; Sheldrick & Schneider, 1997 ▸), it is critical in quantum refinement. The addition of H atoms was achieved using Reduce (Word et al., 1999 ▸). The model requirements for QM are more stringent than for standard refinement, prompting the development of further tools. These requirements include the treatment of protein chain breaks, the handling of dangling bonds and the curation of N-termini.
Chain breaks can be owing to missing residues. In standard refinement there is no need to consider the protonation states of the end moieties. However, in a QM calculation a naked terminal N atom would have unpaired electrons that would significantly change the characteristics of the terminal moieties and possibly prevent convergence of the QM energy calculation. In this case, a choice must be made between a charged N-terminal moiety with three H atoms or a neutral terminus, both of which are coded into the model-completion tool. This treatment of terminal groups is also important when treating the dangling bonds in fragments of a model, as discussed in §2.5. Curation of the N-termini involves adding H atoms to amino acids not treated by Reduce.
The H atoms that were added by Reduce at standard nuclear distances were included in the atomic model refinement. The H atoms were not constrained or restrained in the quantum refinement (the hydrogen riding model was not used). Furthermore, hydrogen positions are refined using QM gradients, and therefore their positions are at least partially a result of the hydrogen-bonding network. H atoms are only used to obtain the QM restraints and are not included in the experimental data term (see §2.6 for definition) by setting the occupancy to zero.
2.2. Interaction-based graph
Noncovalent interactions (NCIs) are of paramount importance owing to their ubiquity and versatility, and they play a critical role in stabilizing biomacromolecules. Density-based interaction descriptors have been developed to reveal the NCIs based on topological analysis of the model-calculated electron density [ρ(r)]. This can be obtained from an independent-atom model or a quantum-chemical calculation. The NCI index is used to detect noncovalent interactions within a molecular system by using the reduced density gradient (RDG),
For more information about the NCI index, please see Johnson et al. (2010 ▸).
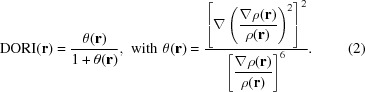
The Density Overlap Region Indicator (DORI; de Silva & Corminboeuf, 2014 ▸) is another density-based descriptor to simultaneously identify covalent and noncovalent interactions within an atomic model,
 |
Networks come from the well established mathematical discipline of graph theory. They are constructed from a collection of n nodes joined by m edges. Residues (e.g. amino acids, ligands or ordered water molecules) are represented as nodes, and the presence of (non)covalent interactions is represented as edges. A list of interacting pairs of residues is obtained from the DORI analysis as implemented in Yoink (Zheng, Kuriappan et al., 2017 ▸). The interaction list is used to construct an interaction-based graph representation of the atomic model (see Fig. 1b ▸).
Figure 1.

The interaction-based fragmentation process for 2oNA. (a) The structure shown in ball-and-stick representation is coloured by residue name. (b) The structure of 2oNA is represented by an interaction-based graph with all nodes located on the Cα atoms of amino-acid residues or O atoms of waters. (c) The structure of 2oNA is coloured by cluster assignment. (d) The interaction-based graph is clustered by the edge-betweenness algorithm, which assigns the nodes to a set of clusters.
2.3. Graph clustering
We need to partition the atomic model into a set of smaller pieces in order to perform a set of quantum-chemical calculations on each piece separately. We used the edge-betweeness algorithm (Fortunato, 2010 ▸; Girvan & Newman, 2002 ▸) to cluster the interaction-based graph, as implemented in the graph module of cctbx. The edge-betweeness centrality threshold value was set to 4. This procedure allows nodes with many interconnecting edges to stay together in a subgraph. This translates to residues (nodes) that interact with one another being placed into the same cluster (subgraph) for QM calculation. The interaction graph of 2oNA is divided into eight clusters (see Figs. 1c and 1 ▸ d).
2.4. Periodicity
PDB entry 2oNA (Fig. 2 ▸ a) has strong interactions with neighbouring unit cells. A super-cell containing the molecule translated by a unit-cell period in all directions is constructed to account for periodicity. This generates 26 copies around the central 2oNA model, which results in 9342 atoms in the super-cell (see Fig. 2 ▸ b). When atoms from periodic copies are far away from atoms in the unit cell, their contribution is negligible. All residues with a closest atom distance to the central unit cell of less than 10 Å are used to define a region that we term the ‘super-sphere’ (see Fig. 2 ▸ c). The super-sphere is used to reduce the number of atoms considered in subsequent calculations.
Figure 2.

Periodic treatment of 2oNA. (a) P1 unit cell with 30 residues (346 atoms including H atoms). (b) Super-cell with 810 residues (9342 atoms including H atoms). (c) Super-sphere with 223 residues (2472 atoms including H atoms).
2.5. Fragments
In order to include the effect of a cluster on the immediate environment, a buffer region is defined surrounding each individual cluster. If, and only if, any residue in the super-sphere makes a noncovalent interaction with a cluster, it will be added to the buffer region surrounding that particular cluster (Zheng & Waller, 2016 ▸; Zheng, Kuriappan et al., 2017 ▸). Similarly, a second layer of the buffer region is defined as any molecule interacting with the first layer of the buffer. We then define a fragment as being a cluster plus the buffer region (the total size of the fragment is typically tens of residues, including H atoms). When creating fragments, one often needs to cut through a covalent bond; however, QM methods require that the valences of individual atoms be satisfied and therefore capping atoms (typically H atoms) are introduced. This is a standard procedure in QM/MM methods (Senn & Thiel, 2009 ▸). These capping H atoms do not contribute to the scattering and calculation of crystallographic entities (for example, structure factors). An intensive hydrogen-bond network exists in the 2oNA structure, so a two-layer buffer is defined for each fragment, and the remainder of the super-sphere is represented by a set of atom-centred point charges, as shown in Fig. 3 ▸.
Figure 3.

The system setup for QM calculation. (a) Cluster coloured pink. (b) Buffer region coloured green. (c) The remaining atoms in the supersphere are coloured grey.
2.6. QM gradients
In this work, we chose to use TeraChem (Ufimtsev & Martinez, 2009 ▸), a graphical processing unit (GPU)-based quantum-chemical code using the HF/6-31G quantum-mechanical method with dispersion corrections (Grimme et al., 2010 ▸). A single gradient evaluation is performed for each fragment. The energy of each fragment can be obtained; however, the total energy cannot be obtained by simple summation over the individual fragments, since the QM energy contains many-body terms (non-additive; Hodges et al., 1997 ▸). The computed gradients for each cluster are combined together; the gradients for the buffer regions and capping atoms are discarded.
In standard optimization or refinement both the energy and gradient are required; however, only the gradient is defined for our fragmentation procedure. The gradients are used in the minimization process throughout refinement. The standard L-BFGS minimizer available in cctbx was modified to enable a gradient-only line search (Snyman, 2005 ▸). The relative weight, denoted w in target (3),
is initially taken as the ratio of the gradient norm of the restraint and data terms, and is scaled up or down using a heuristic approach (Afonine et al., 2011 ▸).
3. Results
In order to evaluate the quantum refinement of 2oNA, the model was first completed using cctbx utilities and then refined using phenix.refine (Afonine et al., 2012 ▸). Four types of calculations were then executed in Q|R: (i) cctbx refinement, (ii) cctbx optimization, (iii) fragment-based QM refinement and (iv) fragment-based QM optimization. The refinements constituted several macrocycles of minimization of target (3), performed until convergence. The convergence is determined by monitoring atomic shifts and R factors: the process terminates when no significant changes occur between macro-cycles. Optimization is termed as the minimization of target (3) without including T data. The resulting data from those four calculations are listed in Table 1 ▸. The interaction-based fragmentation QM refinement took around 10 days to refine on four GPU-based nodes, where each node has four NVIDIA 1080Ti cards. This interaction graph-based fragmentation method enables larger systems to be studied. Without this fragmentation approach this is not possible, because the inherent scalability of quantum-chemical methods prevents larger systems from being studied.
Table 1. Model and model-to-data fit statistics shown for the original 2oNA model and for 2oNA re-refined and optimized using QM and cctbx restraints.
| Re-refinement | Optimization | ||||
|---|---|---|---|---|---|
| Metric | 2oNA † | cctbx | QM | cctbx | QM |
| R factors (%) | |||||
| R work | 20.25 | 27.36 | 23.16 | 35.80 | 35.23 |
| R free | 29.64 | 30.60 | 23.86 | 33.22 | 35.21 |
| R free − R work | 9.39 | 3.24 | 0.70 | −2.47 | −0.02 |
| R.m.s.d.‡ | |||||
| Bonds (Å) | 0.010 | 0.001 | 0.018 | 0.001 | 0.019 |
| Angles (°) | 1.39 | 0.49 | 2.18 | 0.42 | 1.99 |
| R.m.s.d. (X—H only) | |||||
| Bonds (Å) | n/a | 0.001 | 0.014 | 0.000 | 0.014 |
| Angles (°) | n/a | 0.44 | 2.24 | 0.42 | 2.16 |
| Ramachandran plot (%) | |||||
| Favoured | 100 | 93.75 | 100 | 93.75 | 100 |
| Allowed | 0 | 6.25 | 0 | 6.25 | 0 |
| Outliers | 0 | 0 | 0 | 0 | 0 |
| Rotamer outliers§ (%) | 6.25 (1) | 0 | 12.50 (2) | 0 | 12.50 (2) |
| Clashscore | 15.24 | 9.15 | 6.10 | 3.06 | 0 |
| Cβ deviations | 0 | 0 | 0 | 0 | 0 |
Statistics calculated using the model and data from the PDB.
Does not include H atoms.
The number of rotamer outliers is shown in parentheses.
The 2oNA column in Table 1 ▸ reports statistics for the model and data extracted from the Protein Data Bank. Except for the R free, these values match the values provided in the validation report for this PDB entry. The discrepancy in the R factors is not unexpected and may originate for reasons that have previously been described (Afonine et al., 2010 ▸). The next two columns report the statistics from the cctbx and QM refinements. The last two columns are devoted to the results of geometry optimization using either cctbx or QM. Classical refinement reduces overfitting by reducing the gap between R work and R free at the cost of increasing both. QM-based refinement shows the best model-to-data fit (lowest R work and R free) and minimal overfitting (lowest R free − R work value).
The r.m.s.d. calculations for bonds and angles use ideal values from a library. The refinement using cctbx reduces both the bond and angle r.m.s.d. values. For the QM refinement, the r.m.s.d. values are within the expected range. The r.m.s.d. values for the optimized geometries are also within the expected range.
Because Q|R refines the positions of the H atoms, the r.m.s.d. values for only bonds and angles that contain at least one H atom are also included in Table 1 ▸. The values are almost identical to the heavy-atom-only r.m.s.d. results.
For both the Ramachandran and side-chain rotamer metrics, the cctbx refinements have zero outliers. The QM refinement also has no Ramachandran outliers and has 0% in the ‘allowed’ region, compared with 6.25% for the cctbx-refined structure. The QM-refined structure has two rotamer outliers that are discussed below. The optimized structures are, once again, similar.
The clashscore improves on moving from deposited to cctbx to QM. The two clashes in the QM model are discussed below. Interestingly, there is one clash in the cctbx model that is large (0.8) compared with the others. This clash is absent from the QM model and is maintained in the cctbx optimized geometry while all other clashes are removed in the optimized structures. The reason for the absence of the clash in the Q|R model is discussed in detail below, illustrating that the added flexibility of the QM model to use hydrogen-bonding networks to offset the geometry deformations is beneficial.
3.1. Angle outliers
There is one angle outlier in the MolProbity (Chen et al., 2010 ▸) report, i.e. the N—Cα—Cβ angle of Met residue 1 in chain B for the QM-refined model of 2oNA. It is 103.0°, with a Z-score of 4.4 from the ideal 110.5°. This is below the Z = 5 value recommended by the Validation Task Force (Read et al., 2011 ▸) but merits attention. In this case, we attribute this large deviation to the formation of two hydrogen bonds in the QM structure, each with a different periodic copy (Fig. 4 ▸). Both of the acid groups in the periodic copies are moved towards the ideal positions to form the hydrogen-bonding network. The strain in the N-terminal amino acid could be balanced by the creation of this network.
Figure 4.

Angle outlier from MolProbity (Met residue 1 in chain A) after cctbx (a) and QM (b) refinement. Note the improved hydrogen-bond configuration after QM refinement. (c) Side-chain OMIT mF obs − DF model map showing a better fit of the QM-refined model (pink C atoms) compared with the cctbx-refined model (green C atoms).
3.2. Side-chain rotamer outliers
There are two rotamer outliers in the QM-refined structure compared with zero rotamer outliers in the cctbx-refined structure. Interestingly, one rotamer outlier does not have density for the side chain, whilst the other does. The former is the terminal amino acid in chain D: Val6. The rotamer in the cctbx-refined structure is in the ‘favoured’ region. The classifications are based on the probability score (Hintze et al., 2016 ▸), with a score of better than 2% being ‘favoured’, a score of below 0.3% being an ‘outlier’ and the remainder being ‘allowed’. The probability score for Val6 in the cctbx-refined structure is 4.4%. This is quite low, indicating that it is on the border of the valid region. The χ1 value for the allowed rotamer is 192°, whilst the outlier value is 208°. In both cases, the side chain is interacting with periodicity-related copies of the model. In the cctbx refinement, the dihedral is restrained to 180°. With no such restriction, the QM refinement moves away from the clashes to a larger angle.
The rotamer outlier with density for the side chain, Met1 in chain A (Fig. 4 ▸), is similar to the previous case in that the probability score in the cctbx-refined structure is low, only being in the allowed region. The N-terminus is also similar to the case of Met1 in chain B (Fig. 5 ▸); there is a large movement driven by the formation of a hydrogen-bonding network (Figs. 5 ▸ a and 5 ▸ b). This displaces the Cα atom by 0.36 Å, thus displacing the side chain. Both the χ2 and χ3 values change greatly, allowing the side chain in the QM-refined structure to better fit the density (Fig. 4 ▸ c). This arrangement also removes a large clash that is present in the cctbx-refined model.
Figure 5.

Side-chain rotamer outlier from MolProbity (Met residue 1 in chain B) after cctbx (a) and QM (b) refinement. Note the improved hydrogen-bond configuration after QM-based refinement.
3.3. Clashscore
The QM-refined model of 2oNA has two clashes in the MolProbity analysis: one is between residue Val6 in chain A and Val2 in chain C, and the other is located between Val6 in chain C and Met1 in chain D. The overlap value is approximately 0.5 Å for both. This indicates that the van der Waals radii associated with each atom are overlapping by this value. The minimum value for reporting is 0.4 Å, so these clashes are not large.
We analysed these clashes using the NCIPLOT program (Contreras-García et al., 2011 ▸). NCI analysis has been widely utilized to identify and visualize noncovalent interactions. The type of interaction ranges from repulsive to attractive, and this is visually represented by the colour of the isosurface changing from red (strongly repulsive) to green (weakly attractive) to blue (strongly attractive). Here, a B3LYP/6-31G(d) wavefunction was used in NCIPLOT to perform the analysis and produce the isosurface shown in Fig. 6 ▸. Therefore, based on the colour and volume of the isosurfaces found for the two clashes, we can rationalize these outliers from the MolProbity clashscore as weak noncovalent-type interactions that stabilize the structure.
Figure 6.

Two clashes in MolProbity (green C atoms) after QM refinement. (a) MolProbity Probe dots indicating steric clashes between Val6 in chain A and Val2 in chain C. (b) MolProbity Probe dots indicating steric clashes between Val6 in chain C and Met1 in chain D. A three-dimensional isosurface plot (cyan C atoms) is generated using NCIPLOT for the two MolProbity clashes, which is used to provide qualitative information about individual NCIs. (c) Noncovalent interaction isosurface between Val6 in chain A and Val2 in chain C and (d) noncovalent interaction isosurface between Val6 in chain C and Met1 in chain D. A green isosurface indicates weak attractive noncovalent interaction according to an NCI analysis, which supports the presence of these two short intermolecular contacts.
4. Conclusions
Standard quantum-chemical methods such as Hartree–Fock or density-functional theory are intractable for proteins. We have developed a divide-and-conquer approach that fragments the atomic model into small manageable pieces in order to refine a protein using quantum-based restraints. Quantum-based restraints for proteins can now be computed by obtaining sufficient computing resources to process all of the fragmented pieces. This is our solution to the scalability issue for quantum-based refinement, which we have referred to as Q|R#1.
We have applied our fragmentation approach to refine the atomic model of the 2oNA crystal structure. In the particular case of 2oNA, the QM-refined model shows an improvement (using standard validation metrics) over classic refinement using cctbx restraints. The model better fits the data, as indicated by a lower R work, R free and R free–R work gap, as well as an improved local model-to-map fit. The 2oNA model geometry is also improved as indicated by MolProbity scores, an ameliorated hydrogen-bond network and NCI analysis for investigating close atomic contacts.
The potential of quantum-based refinement for crystallography and cryo-EM will be investigated in ongoing work. In future work, we seek to address the next two issues related to symmetry (Q|R#2) and static disorder (alternative conformations; Q|R#3). We are working on developing solutions to these challenges for quantum refinement, and our progress will be published in due course.
Acknowledgments
We acknowledge Gabor Bunkóczi for assistance with the graph library in cctbx.
Funding Statement
This work was funded by Deutsche Forschungsgemeinschaft grant SFB858 to Min Zheng and Mark P. Waller. Shanghai Eastern Scholar Program grant to Mark P. Waller. National Institutes of Health grant GM063210 to Pavel V. Afonine and Nigel W. Moriarty. Phenix Industrial Consortium grant to Pavel V. Afonine and Nigel W. Moriarty.
Footnotes
For the PDB code naming convention used in this article, please see Moriarty (2015 ▸).
References
- Afonine, P. V. & Adams, P. D. (2012). Comput. Crystallogr. Newsl. 3, 18–21. https://www.phenix-online.org/newsletter/CCN_2012_01.pdf.
- Afonine, P. V., Echols, N., Grosse-Kunstleve, R. W., Moriarty, N. W. & Adams, P. D. (2011). Comput. Crystallogr. Newsl. 2, 99–103. https://www.phenix-online.org/newsletter/CCN_2011_01.pdf.
- Afonine, P. V., Grosse-Kunstleve, R. W., Chen, V. B., Headd, J. J., Moriarty, N. W., Richardson, J. S., Richardson, D. C., Urzhumtsev, A., Zwart, P. H. & Adams, P. D. (2010). J. Appl. Cryst. 43, 669–676. [DOI] [PMC free article] [PubMed]
- Afonine, P. V., Grosse-Kunstleve, R. W., Echols, N., Headd, J. J., Moriarty, N. W., Mustyakimov, M., Terwilliger, T. C., Urzhumtsev, A., Zwart, P. H. & Adams, P. D. (2012). Acta Cryst. D68, 352–367. [DOI] [PMC free article] [PubMed]
- Bahn, S. R. & Jacobsen, K. W. (2002). Comput. Sci. Eng. 4, 56–66.
- Berman, H. M., Westbrook, J., Feng, Z., Gilliland, G., Bhat, T. N., Weissig, H., Shindyalov, I. N. & Bourne, P. E. (2000). Nucleic Acids Res. 28, 235–242. [DOI] [PMC free article] [PubMed]
- Bernstein, F. C., Koetzle, T. F., Williams, G. J., Meyer, E. F., Brice, M. D., Rodgers, J. R., Kennard, O., Shimanouchi, T. & Tasumi, M. (1978). Arch. Biochem. Biophys. 185, 584–591. [DOI] [PubMed]
- Borbulevych, O. Y., Plumley, J. A., Martin, R. I., Merz, K. M. & Westerhoff, L. M. (2014). Acta Cryst. D70, 1233–1247. [DOI] [PMC free article] [PubMed]
- Callaway, E. (2015). Nature (London), 525, 172–174. [DOI] [PubMed]
- Canfield, P., Dahlbom, M. G., Hush, N. S. & Reimers, J. R. (2006). J. Chem. Phys. 124, 024301. [DOI] [PubMed]
- Chen, V. B., Arendall, W. B., Headd, J. J., Keedy, D. A., Immormino, R. M., Kapral, G. J., Murray, L. W., Richardson, J. S. & Richardson, D. C. (2010). Acta Cryst. D66, 12–21. [DOI] [PMC free article] [PubMed]
- Contreras-García, J., Johnson, E. R., Keinan, S., Chaudret, R., Piquemal, J.-P., Beratan, D. N. & Yang, W. (2011). J. Chem. Theory Comput. 7, 625–632. [DOI] [PMC free article] [PubMed]
- Egelman, E. H. (2016). Biophys. J. 110, 1008–1012. [DOI] [PMC free article] [PubMed]
- Engh, R. A. & Huber, R. (1991). Acta Cryst. A47, 392–400.
- Fedorov, D. G. & Kitaura, K. (2007). J. Phys. Chem. A, 111, 6904–6914. [DOI] [PubMed]
- Fortunato, S. (2010). Phys. Rep. 486, 75–174.
- Fu, Z., Li, X., Miao, Y. & Merz, K. M. (2013). J. Chem. Theory Comput. 9, 1686–1693. [DOI] [PMC free article] [PubMed]
- Girvan, M. & Newman, M. E. J. (2002). Proc. Natl Acad. Sci. USA, 99, 7821–7826. [DOI] [PMC free article] [PubMed]
- Goerigk, L. & Reimers, J. R. (2013). J. Chem. Theory Comput. 9, 3240–3251. [DOI] [PubMed]
- Gordon, M. S., Fedorov, D. G., Pruitt, S. R. & Slipchenko, L. V. (2012). Chem. Rev. 112, 632–672. [DOI] [PubMed]
- Grimme, S., Antony, J., Ehrlich, S. & Krieg, H. (2010). J. Chem. Phys. 132, 154104. [DOI] [PubMed]
- Grosse-Kunstleve, R. W., Afonine, P. V. & Adams, P. D. (2004). IUCr Comm. Crystallogr. Comput. Newsl. 4, 19–36. https://www.iucr.org/resources/commissions/crystallographic-computing/newsletters/4.
- Grosse-Kunstleve, R. W., Sauter, N. K., Moriarty, N. W. & Adams, P. D. (2002). J. Appl. Cryst. 35, 126–136.
- He, X., Zhu, T., Wang, X., Liu, J. & Zhang, J. Z. H. (2014). Acc. Chem. Res. 47, 2748–2757. [DOI] [PubMed]
- Hintze, B. J., Lewis, S. M., Richardson, J. S. & Richardson, D. C. (2016). Proteins, 84, 1177–1189. [DOI] [PMC free article] [PubMed]
- Hodges, M. P., Stone, A. J. & Xantheas, S. S. (1997). J. Phys. Chem. A, 101, 9163–9168.
- Johnson, E. R., Keinan, S., Mori-Sánchez, P., Contreras-García, J., Cohen, A. J. & Yang, W. (2010). J. Am. Chem. Soc. 132, 6498–6506. [DOI] [PMC free article] [PubMed]
- Kitaura, K., Ikeo, E., Asada, T., Nakano, T. & Uebayasi, M. (1999). Chem. Phys. Lett. 313, 701–706.
- Kühlbrandt, W. (2014). Science, 343, 1443–1444. [DOI] [PubMed]
- Li, X., Fu, Z. & Merz, K. M. (2012). J. Comput. Chem. 33, 301–310. [DOI] [PMC free article] [PubMed]
- Moriarty, N. W. (2015). Comput. Crystallogr. Newsl. 6, 26. https://www.phenix-online.org/newsletter/CCN_2016_07.pdf.
- Nilsson, K., Hersleth, H. P., Rod, T. H., Andersson, K. K. & Ryde, U. (2004). Biophys. J. 87, 3437–3447. [DOI] [PMC free article] [PubMed]
- Read, R. J. et al. (2011). Structure, 19, 1395–1412. [DOI] [PMC free article] [PubMed]
- Ryde, U. (2003). Curr. Opin. Chem. Biol. 7, 136–142. [DOI] [PubMed]
- Ryde, U. & Nilsson, K. (2003a). J. Mol. Struct. Theochem, 632, 259–275.
- Ryde, U. & Nilsson, K. (2003b). J. Am. Chem. Soc. 125, 14232–14233. [DOI] [PubMed]
- Sawaya, M. R., Sambashivan, S., Nelson, R., Ivanova, M. I., Sievers, S. A., Apostol, M. I., Thompson, M. J., Balbirnie, M., Wiltzius, J. J., McFarlane, H. T., Madsen, A. O., Riekel, C. & Eisenberg, D. (2007). Nature (London), 447, 453–457. [DOI] [PubMed]
- Senn, H. M. & Thiel, W. (2009). Angew. Chem. Int. Ed. 48, 1198–1229. [DOI] [PubMed]
- Sheldrick, G. M. & Schneider, T. R. (1997). Methods Enzymol. 277, 319–343. [PubMed]
- Silva, P. de & Corminboeuf, C. (2014). J. Chem. Theory Comput. 10, 3745–3756. [DOI] [PMC free article] [PubMed]
- Snyman, J. (2005). Int. J. Numer. Methods Eng. 62, 72–82.
- Titov, A. V., Ufimtsev, I. S., Luehr, N. & Martinez, T. J. (2013). J. Chem. Theory Comput. 9, 213–221. [DOI] [PubMed]
- Ufimtsev, I. S. & Martinez, T. J. (2009). J. Chem. Theor. Comput. 5, 2619–2628. [DOI] [PubMed]
- Vagin, A. A., Steiner, R. A., Lebedev, A. A., Potterton, L., McNicholas, S., Long, F. & Murshudov, G. N. (2004). Acta Cryst. D60, 2184–2195. [DOI] [PubMed]
- Word, J. M., Lovell, S. C., Richardson, J. S. & Richardson, D. C. (1999). J. Mol. Biol. 285, 1735–1747. [DOI] [PubMed]
- Yu, N., Hayik, S. A., Wang, B., Liao, N., Reynolds, C. H. & Merz, K. M. (2006). J. Chem. Theory Comput. 2, 1057–1069. [DOI] [PMC free article] [PubMed]
- Yu, N., Li, X., Cui, G. L., Hayik, S. A. & Merz, K. M. (2006). Protein Sci. 15, 2773–2784. [DOI] [PMC free article] [PubMed]
- Yu, N., Yennawar, H. P. & Merz, K. M. (2005). Acta Cryst. D61, 322–332. [DOI] [PubMed]
- Zheng, M., Kuriappan, J. A. & Waller, M. P. (2017). Int. J. Quantum Chem. 117, e25336.
- Zheng, M., Reimers, J. R., Waller, M. P. & Afonine, P. V. (2017). Acta Cryst. D73, 45–52. [DOI] [PMC free article] [PubMed]
- Zheng, M. & Waller, M. P. (2016). WIREs Comput. Mol. Sci. 6, 369–385.