Abstract
In the context of Alzheimer’s disease (AD), the production of HO• by copper–amyloid beta (Aβ) in the presence of ascorbate is known to be deleterious for the Aβ peptide itself and also for the surrounding molecules, thus establishing a direct link between AD and oxidative stress. The metal-catalyzed oxidation (MCO) of Aβ primarily targets the residues involved in copper coordination during HO• production. In the present work, we demonstrate that the oxidative damage undergone by Aβ during MCO lead to a change in copper coordination, with enhanced catalytic properties that increases the rates of ascorbate consumption and HO• production, and the amount of HO• released by the system. This phenomenon is observed after the peptide has been sufficiently oxidized.
Introduction
In 2012, 36 million people suffered from Alzheimer’s disease (AD), the widespread neurodegenerative disease. A hallmark of this disease is the presence of senile plaques in the brain,1 mainly composed of the amyloid-β peptide (Aβ)2 in an aggregated form. The peptide is also found in a soluble form in healthy brains.3 A high concentration of metals, such as copper, zinc and iron, are also found in the plaques.4–6 Cu and Zn are bound directly to the Aβ peptide. Among them, copper is redox-active and can catalyze the production of Reactive Oxygen Species (ROS) when bound to Aβ.7–9 In the presence of dioxygen and a reductant such as ascorbate, the Cu–Aβ system can produce the superoxide anion (O2•−), hydrogen peroxide (H2O2) and the hydroxyl radical (HO•) in vitro.8,10,11 The latter is the most reactive and can cause oxidative damage to the surrounding biomolecules, such as lipids, nucleic acids and proteins (with the rate constant usually ranging from 109 to 1010 L mol−1 s−112), including Aβ itself, which is found to be oxidized in amyloid plaques in vivo.13 The link between AD and oxidative stress is also supported by DNA oxidation, proteins and lipid peroxidation, as evidenced in the brain of AD patients.14,15
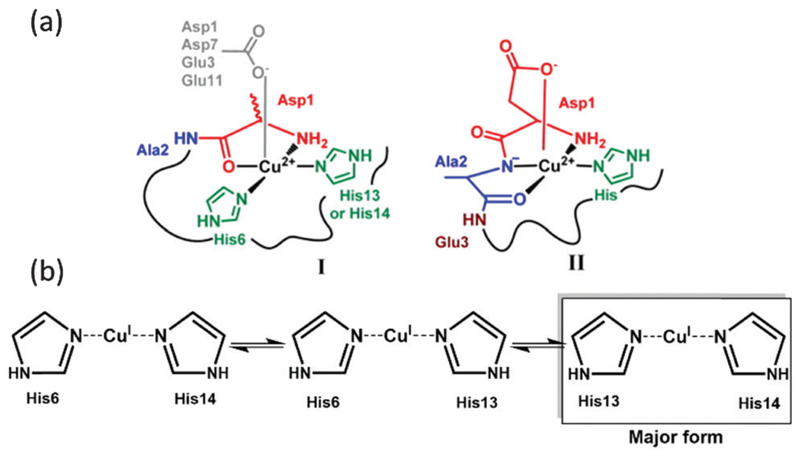
The coordination mode of copper with Aβ is of interest for a better understanding of the metal-catalyzed ROS production. At physiological pH, two coordination modes with a square-planar geometry were identified for the Cu(ii)–Aβ complex, called components I and II (Fig. 1a),16,17 involving in particular Asp1 and the His residues His6, 13 and 14. The two forms are in pH-dependent equilibrium with a pKa value of 7.8.18 In addition, dynamic exchange between ligands on a given binding position is also observed.19 Cu(i) is linked to Aβ in a linear fashion by two of the three His residues present in the Aβ sequence, in a fast dynamic exchange between ligands.19,20 The major form involves His13 and His14 (Fig. 1b).
Fig. 1.
(a) Cu(ii) coordination and (b) Cu(i) coordination to the Aβ peptide.16, 20
To catalyze the ROS production, copper has to cycle between its two redox states. As the coordination of Cu(i) and Cu(ii) with Aβ is very different, the direct electron transfer between those two states (called the resting states) is too slow, due to the high requirement of rearrangement energy. The electron transfer rather proceeds via a low-populated redox-competent state, called the “in-between” state, for which Cu(i) and Cu(ii) coordination with Aβ is close enough to allow minimal energy for reorganization.21,22
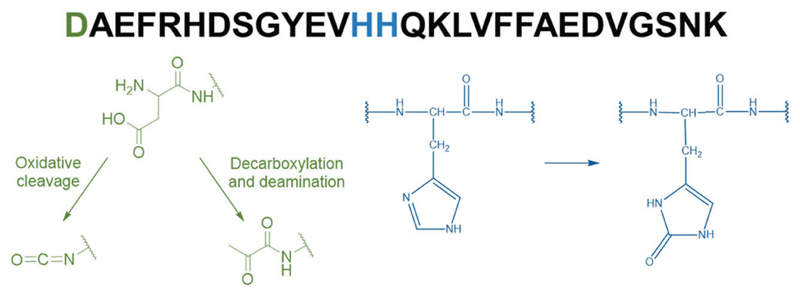
The metal-catalyzed oxidation (MCO) of Aβ by the Cu–Aβ/ascorbate/O2 system has been previously studied.21,23,24 Because ROS are produced at the metal center, the Aβ peptide residues are the preferential targets for an HO• attack. In line with their involvement in copper coordination in the “in-between” state of Cu–Aβ,21 Asp1, His13 and His14 are the major oxidized residues (Fig. 2). Asp1 oxidation was proposed to lead to the formation of either an isocyanate or a pyruvate function via oxidative cleavage or decarboxylation and deamination, respectively,21,25 while His13 and 14 are found to be oxidized into 2-oxohistidines.21,23,24 The oxidation of Asp1 was found to be three times higher than the oxidation of histidine, with decarboxylation/deamination as a preferential mechanism (5 times higher than the oxidative cleavage).
Fig. 2.
Amino acid sequence of the Aβ28 peptide (top) along with the main targeted amino acid residues (in color) and the chemical structure of the oxidation products (bottom). Asp1 oxidation leads to the formation of either an isocyanate or a pyruvate function21,25 (green) and His13 and His14 oxidation reactions lead to the formation of 2-oxohistidines21,23,24 (blue).
Thus, the oxidation of the major ligands leading to the oxidized Aβ peptide (Aβox as named below), could have an impact on the coordination sites of copper with Aβ. The impact could be different for the two oxidation degrees of both the resting and “in-between” states of Cu–Aβ. These structural changes might result in a modification of the catalytic properties of the complex.
Thus, in the present study, we report first on the consequence of the oxidation of the Aβ peptide on the coordination of Cu(i) and Cu(ii) resting states by X-ray absorption near edge spectroscopy (XANES) and electron paramagnetic resonance (EPR). Then we analyze the impact of Aβ oxidation on the Cu-induced ROS production by mass spectrometry, UV-visible and fluorescence spectroscopies.
Experimental
Chemicals
The Cu(ii) used was from CuSO4·5(H2O) and purchased from Sigma. A stock solution of Cu(ii) (10 mM) was prepared in ultrapure water. Phosphate buffer was bought from Sigma-Aldrich and dissolved in ultrapure water to reach a 100 mM concentration and pH 7.4. HEPES buffer was bought from Sigma and dissolved in ultrapure water to reach a 0.5 M concentration and pH 7.1. Ascorbate solutions were freshly prepared a few minutes prior to each experiment by dissolving sodium l-ascorbate (Sigma) in ultrapure water. Hydrogen peroxide (H2O2) solutions were freshly prepared from a 30 wt% H2O solution purchased from Sigma-Aldrich. A stock solution of coumarin-3-carboxylic acid (CCA) 1 mM (from Sigma) was prepared in phosphate buffer (0.1 M, pH 7.4) at room temperature. Ethylene diamine tetraacetic acid (EDTA) was purchased from Sigma-Aldrich and dissolved in ultrapure water to reach a concentration of 40 mM. Sodium dithionite was bought from Sigma-Aldrich and dissolved in ultrapure water a few minutes prior to each experiment.
Peptides
All the synthetic peptides were bought from GeneCust (Dudelange, Luxembourg), with a purity grade of >95%. Stock solutions of Aβ28 (sequence DAEFRHDSGYEVHHQKLVFFAEDVGSNK), AcAβ28 (sequence Ac-DAEFRHDSGYEVHHQKLVFFAEDVGSNK), Aβ7 (sequence DAEFRHD), Aβ16 (sequence DAEFRHDSGYEVHHQK), AcAβ16 (Ac-DAEFRHDSGYEVHHQK) and D7H–Aβ16 (sequence DAEFRHHSGYEVHHQK) peptides were prepared by dissolving the powder in ultrapure water (resulting pH ≈ 2). The peptide concentration was then determined by UV-visible absorption of Tyr10 considered as free tyrosine (at pH 2, (ε276 – ε296) = 1410 M−1 cm−1). For Aβ7, the absorption of Phe ((ε258 – ε280) = 190 M−1 cm−1) was used.
Oxidation of the Aβ peptide
The Aβ28 peptide (60 μM) was oxidized in a phosphate buffered solution (50 mM, pH 7.4) containing Cu(ii) (50 μM) and ascorbate (0.5 mM) for 30 min. Then, the solution was concentrated with a Amicon Ultra 3 kDa membrane (Millipore), washed with EDTA (10 equiv.) to remove copper, then with water and finally with NaOH (50 mM, pH ≈ 13). The oxidized peptide solution was recovered and the concentration of the oxidized Aβ peptide was then determined through the UV-visible absorption of Tyr10, considered as free tyrosine ((ε293 – ε360) = 2400 M−1 cm−1) in NaOH (50 mM, resulting pH ≈ 13).
As the oxidized peptide solution has a background absorbance at 293 nm, the curve is fitted to subtract the absorbance due to the tailing (see Fig. S1, ESI†) from the Tyr absorption. The Aβ28 peptide was used for technical reasons (membrane cut-off of 3 kDa).
HO• production monitoring
Fluorescence experiments were performed on a multi-plate reader FLUOstar Optima 96-well plate reader system (BMG Labtech) at 25 °C. Two automatic injectors were used to add ascorbate and hydrogen peroxide solutions into the wells during experiments. Coumarin-3-carboxylic acid (CCA) was used as a probe to detect HO•, as it reacts with CCA to form 7-hydroxycoumarin-3-carboxylic acid (7-OH-CCA), which is fluorescent at 452 nm upon excitation at 395 nm. The intensity of the fluorescence signal is proportional to the number of 7-OH-CCA molecules formed, which in turn is proportional to the HO• radicals released.26 A fixed volume of 2 μL of ascorbate (2 mM) and 2 μL of hydrogen peroxide (5 mM) were added every 15 min for 2 hours to 200 μL of phosphate buffered (pH 7.4, 50 mM) solutions containing CCA (0.5 mM) and Cu(ii) (20 μM) with or without the Aβ peptide (Aβ16, Aβ7, AcAβ16, D7H–Aβ16, Aβ28, AcAβ28, or Aβ40) (25 μM). The fluorescence was monitored every 30 s.
Ascorbate consumption experiments
UV-Vis spectra were recorded on an Agilent 8453 UV-visible spectrophotometer at 25 °C. The intensity of the ascorbate (Asc) absorption band at λ = 265 nm (ε = 14 500 M−1 cm−1) was monitored as a function of time, in 50 mM phosphate buffer, pH 7.4 containing 10 μM of Cu(ii), 12 μM of peptide and 100 μM of Asc.
EPR measurements
EPR spectra were recorded on a Bruker Elexsys E500 spectrometer equipped with a continuous flow cryostat (Oxford). Analysis was performed using an aqueous solution containing 10% of glycerol, 65Cu (450 μM) and peptide (500 μM). The pH was adjusted to 12.5 with NaOH (1 M). Experimental parameters were set as follows: T = 120 K, ν = 9.5 GHz, microwave power = 20.5 mW, amplitude modulation = 10.0 G, and modulation frequency = 100 kHz.
Mass spectrometry
High Performance Liquid Chromatography/High Resolution Mass Spectrometry (HPLC/HRMS) analysis was performed on a LTQ-Orbitrap XL mass spectrometer (Thermo Fisher Scientific, Les Ulis, France), equipped with an electrospray ionization source, and coupled to an Ultimate 3000 LC System (Dionex, Voisins-le-Bretonneux, France). The sample (10 μL) was injected onto the column (Phenomenex, Synergi Fusion RP-C18, 250 × 1 mm, 4 μm) at room temperature. Gradient elution was carried out with formic acid 0.1% (mobile phase A) and acetonitrile/water (80/20 v/v) formic acid 0.1% (mobile phase B) at a flow-rate of 50 μL min−1. The mobile phase gradient was programmed with the following time course: 12% mobile phase B at 0 min, held for 3 minutes, linear increase to 100% B at 15 min, held for 4 min, and linear decrease to 12% B at 20 min and held for 5 min. The mass spectrometer was used as a detector, working in the full scan positive mode between 50 and 2000 Da. The Orbitrap cell was operated in the full-scan mode at a resolution power of 60 000. HPLC/HRMS was also used to check for digestion efficiency, systematically found close to 100% (non-digested peptides were not detected).
Proteolytic digestion
The solution of Aβ was filtered using an Amicon 3 kDa centrifugal device (Millipore) by centrifugation for 15 min at 13 500 rpm, then washed and centrifuged twice with 200 μL sodium hydrogenocarbonate (100 mM, pH 8). The concentrated sample (approx. 50 μL) was recovered and transferred to an Eppendorf ProteinLoBind 1.5 mL vial. Trypsin (0.05 ng μL−1 in formic acid 0.1%) was added to obtain an Aβ/trypsin ratio of 20/1 (w/w) and digestion was carried out at 37 °C for 3 h in a Thermomixer (Eppendorf), with 10 s mixing at 750 rpm every min.
Cu K-edge X-ray absorption measurements
The copper-containing Aβ (Aβ28, Aβ28ox or Aβ7) solutions were injected into sample holders in between two Kapton windows (3 M, cat. #1205; Minneapolis, MN) and immediately frozen in liquid nitrogen. All samples were maintained at 10–20 K throughout data collection using a helium cryostat. Cu K-edge XANES (X-ray absorption near edge structure) spectra were recorded at the BM30B (FAME) French CRG beamline at the European Synchrotron Radiation Facility (ESRF, Grenoble, France).27 The storage ring was operated in a uniform mode at 6 GeV with a 200 mA current. The beam energy was selected using an Si(220) N2 cryocooled double-crystal monochromator with an experimental resolution of ~0.5 eV.28 The beam spot on the sample was approximately 200 × 100 μm2 (H × V, FWHM). The spectra were collected in a fluorescence mode using a 30-element Ge solid-state fluorescence detector (Canberra). The energy was calibrated with Cu metallic foils, such that the maximum energy of the first derivative was set at 8979 eV. Cu data were collected from 8830 to 8960 eV using 5 eV step and 2 s counting time, from 8960 to 9020 eV using 0.5 eV step and 3 s counting time, and from 9020 to 9300 eV with a k-step of 0.05 Å−1 and the counting time increasing from 2 to 10 s.
For each sample, three spectra were averaged and the resulting XANES spectra were background-corrected by linear regression through the pre-edge region and a polynomial through the post-edge region and normalized to the edge jump. The beam was moved to a different position on the sample for each scan to avoid potential Cu photoreduction. All spectra were individually inspected prior to data averaging to ensure that beam damage was not occurring.
Cu(i) samples were prepared under a continuous flow of N2 by direct addition (10 equiv.) of fresh made sodium dithionite (Na2S2O4) stock solution (0.1 M) into the sample holder containing CuSO4 (0.9 mM) and the peptide (1 mM) in the presence of 10% glycerol as a cryoprotectant with the pH adjusted to 7.1. The sample was immediately frozen in liquid nitrogen. Under such conditions, no significant pH drift due to the addition of Na2S2O4 was measured.
Results
Introductory remarks
This study focused on two peptides, Aβ16 and Aβ28, as valuable counterparts of the full-length peptides. These two short peptides are: (i) valuable models for studying copper coordination and ROS production since copper binds to the N-terminal part of Aβ (16 first residues)29–32 and (ii) easier to handle than the full-length peptide (Aβ40/42), which is more prone to aggregation.
In the first three parts of the paper, where oxidized Aβ (Aβox) is under focus, the Aβ28 peptide was used as well as the truncated Aβ7 peptide and the acetylated Aβ28 peptide (AcAβ28). Aβ7 only bears one histidine residue, and is thus a valuable model to mimic His13 and His14 oxidation reactions. AcAβ28 has a blocked N-terminal moiety and is an appropriate model to mimic Asp1 oxidation, as its N-terminal amine is not involved anymore in Cu(ii) coordination.
In the last part describing the evolution of HO• release during Aβ oxidation, the Aβ16 peptide is used for comparison with the truncated Aβ7 peptide, the acetylated Aβ16 (AcAβ16) and the mutated D7H–Aβ16. The latter is a familial AD mutation resulting in a peptide with 1 His more than Aβ16, thus its study is both of mechanistic and biological interest.
Aβox refers to a mixture of biologically oxidized species (see Fig. S2, ESI†). Complete elucidation of the nature as well as the proportion of various oxidized species might be of interest. However, for the present study, knowing the main oxidation reactions that have been previously reported21 is sufficient.
Coordination of copper to Aβox
As previously shown,21,23,24 the HO• radicals produced by the Cu/Aβ/ascorbate/O2 system are deleterious for the Aβ peptide itself. Because they are generated at the metal center, several residues of Aβ involved in Cu(i) and Cu(ii) coordination (namely Asp1, His13 and His14) are oxidized, leading to Aβox. The oxidation of Aβ leads to the formation of a mixture of peptides with different oxidation sites. The experimental conditions for peptide oxidation have been previously studied.33 In the present study, the Aβ28 peptide was oxidized in the presence of 0.8 equiv. of copper and 8 equiv. of ascorbate, in order to ensure that 80% of the peptide is oxidized (at least one amino acid residue is oxidized) (Fig. S3, ESI†). At the end of the reaction, the oxidized peptide (Aβox) was purified using membrane filtration to completely remove any remaining copper bound to the peptide (see the Experimental section), then quantified by UV-Vis and Cu was added again to Aβox or Aβ28 for the spectroscopic studies of Cu(i) and Cu(ii) coordination.
Cu(i) coordination to Aβox
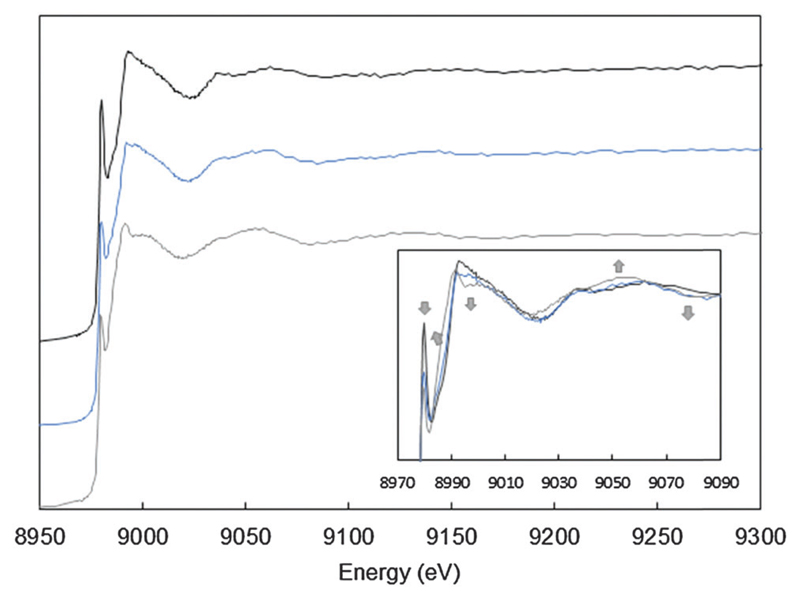
X-ray absorption near edge spectroscopy (XANES) is a very sensitive tool to probe the Cu(i) environment. It has been successfully applied to the spectroscopy of silent metal ions bound to flexible peptides. The XANES spectra of the three Cu(i) samples were collected: Cu(i) coordinated to the non-oxidized Aβ peptide, to the oxidized Aβ peptide (Aβox) and to the truncated Aβ7 peptide (Fig. 3). Aβ7, bearing only the His at position 6, was chosen as a model for Cu(i)-binding to the oxidized peptide since His13 and His14 are the primary targets of oxidation and thus supposed to lose their efficiency in Cu coordination. Single His mutants were not studied since it is anticipated that the oxidation of one of the three His does not affect the coordination much. Indeed, Cu(i) coordination requires only two His residues, as proved by NMR studies20,34 or by affinities of single His–Ala mutation of the Aβ peptide.34–36 In Fig. 3, the pre-edge feature at 8982 eV, assigned to the 1s → 4p electric dipole allowed transition, is visible. Its intensity is characteristic of a Cu(i) species coordinated to 2 ligands in a linear fashion in Aβ–Cu(i),37 as previously reported.20,32,38,39 The intensity is lower for Aβ7, indicating an increment of the number of ligands,37 likely one His of the peptide and 2 or 3 ligands from the solvent. In the case of the Cu(i)–Aβox species, this pre-edge signature tends to be closer to that obtained for Cu(i)–Aβ7. At a higher energy, in particular around 8985, 8995, 9050 and 9075 eV (arrows in the inset of Fig. 3), the XANES spectrum of Aβ28ox shows features that are intermediate between the ones of Cu(i)–Aβ28 and the ones of Cu(i)–Aβ7 (Fig. 3). A linear combination fitting of the XANES provides the relative contribution of the two possible coordination modes: 40% of Cu(i) is coordinated as in Cu(i)–Aβ7 (Fig. S4, ESI†), and the other part of Cu(i) is coordinated to the peptide as in Cu(i)–Aβ, with 2 His. This is consistent with the oxidative damage undergone by both His13 and His14 residues during Aβ oxidation21 that would disrupt the normal coordination of copper in Aβ–Cu(i), known to involve the same residues.20
Fig. 3.
Cu XANES K-edge X-ray absorption spectra of Aβ28–Cu(i) (black curve), Aβox–Cu(i) (blue curve) and Aβ7–Cu(i) (grey curve). The conditions were as follows: 0.9 mM Cu(ii), 1 mM peptide, and 10 mM dithionite in a HEPES buffer (0.1 M, pH 7.1) solution. Arrows indicate the evolution of the Aβox–Cu(i) signature compared with the Aβ28–Cu(i) signature. Inset: zoom of the 8970–9090 eV range.
Cu(ii) coordination to Aβox
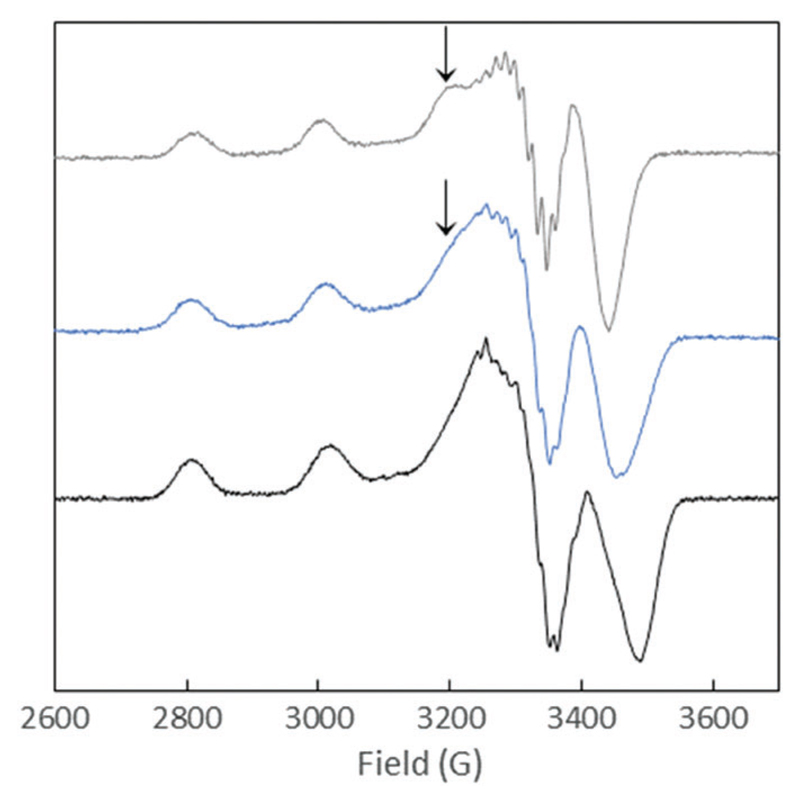
The potential change in the coordination of Cu(ii) to Aβox was studied by Electron Paramagnetic Resonance (EPR). The comparison of the signature of Cu(ii)–Aβox and Cu(ii)–Aβ28 at pH 7.4 shows a coordination change of a part of the Cu, however interpretation is not conclusive (Fig. S5, ESI†). Hence to probe the Cu(ii) environment inside Aβox and the integrity of the N-terminal amine, we also performed EPR studies at a higher pH. At pH 12.5, the EPR spectrum of Cu(ii)–Aβox is indeed different to the one of Cu(ii)–Aβ28 and somehow reminiscent to the one of Cu(ii)–AcAβ2835,36,40 (Fig. 4), where AcAβ28 is the N-terminal acetylated counterpart of Aβ28. The fingerprint is actually an intermediate between those of Cu(ii)–Aβ28 and Cu(ii)–AcAβ28. It was fitted through a linear combination (Fig. S6, ESI†) with 40% of Cu(ii)–AcAβ28 and 60% of Cu(ii)–Aβ28. This shows that for 40% of the Aβox species in solution, the terminal –NH2 is no longer involved in Cu(ii) coordination in line with the Asp1 oxidative damage of the peptide previously described.21,24,25 Probing the impact of His oxidation by EPR is hazardous since at pH 7.4 only a modification in the repartition between components I and II are expected, while at pH 12.5 the His residues are not involved anymore in Cu(ii)–Aβ28.30
Fig. 4.
EPR spectra of Cu(ii)–Aβox (blue curve), Cu(ii)–Aβ28 (black curve) and Cu(ii)–AcAβ28 (grey curve) at pH 12.5. Aqueous solution with 10% of glycerol containing 65Cu (450 μM) and peptide (500 μM). T = 120 K, ν = 9.5 GHz, microwave power = 20.5 mW, amplitude modulation = 10.0 G, and modulation frequency = 100 kHz.
In brief, our data are in line with the interpretation that Cu(ii)–Aβox complexes include a significant proportion of binding sites similar to those of Cu(ii)–AcAβ28 due to Asp1 oxidation, while His oxidation reactions induce the formation of Cu(i)–Aβ7 like species.
HO• production by Cu–Aβox
The metal-catalyzed oxidation of Aβ leads to a change in both Cu(ii) and Cu(i) coordination sites that would impact Cu(i) and Cu(ii) affinities both in the resting and “in-between” states. Regarding Cu(i) binding, it has been previously shown that a single His–Ala mutation does not change the affinity significantly34–36 while a double His–Ala mutation induces a decrease of about two orders of magnitude.35 For Cu(ii), the prevention of N-terminal amine binding also leads to a decrease of about two orders of magnitude35,40,41 while two His–Ala mutations have only a slight impact.35 Hence the oxidation of the Aβ peptide induces a general decrease in the Cu(i) or Cu(ii) affinity although it is not possible to quantify it for the “in-between” state. As a consequence, the oxidation of the Aβ peptide and the resulting modification of the Cu sites could (i) increase the rate of ROS production as a direct impact and (ii) result in a contribution of free Cu in the global ROS production as an indirect effect due to the decrease of Cu affinity for Aβox.
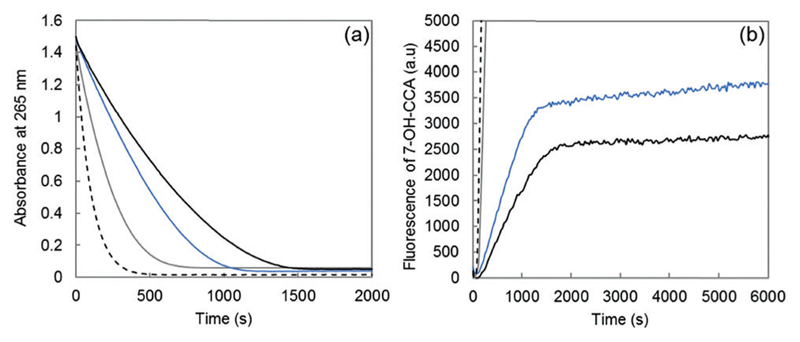
In the present work, the production of HO• was studied by both ascorbate oxidation, monitored by UV-visible spectroscopy, and the fluorescence of 7-OH-CCA, an oxidation product of CCA resulting from HO• scavenging. The 7-OH-CCA fluorescence is proportional to the HO• quantity trapped by CCA.33 The production of HO• was compared between Cu–Aβ28, Cu–Aβbox and Cu–Aβ7 (Fig. 5).
Fig. 5.
(a) Ascorbate consumption by Cu–Aβ28 (black curve), Cu–Aβox (blue curve), Cu–Aβ7 (grey curve) and free Cu (dashed curve) measured using UV spectrophotometry (λ = 265 nm) as a function of the reaction time; phosphate buffered solution (50 mM, pH 7.4), Cu(ii) 10 μM, peptide 12 μM and ascorbate 100 μM. (b) Fluorescence as a function of the time of 7-OH-CCA resulting from the oxidation of CCA obtained for Cu–Aβ28 (black curve), Cu–Aβox (blue curve), Cu–Aβ7 (grey curve) and free Cu (dashed curve); phosphate buffered solution (50 mM, pH 7.4), Cu(ii) 50 μM, peptide 60 μM (oxidized or non-oxidized), ascorbate 500 μM and CCA 500 μM.
The rate of both ascorbate oxidation and 7-OH-CCA formation is much higher for free copper than for Cu–Aβ, in line with the literature.8,42–45 Then, the rate of ascorbate consumption has the following order: Aβ7 > Aβox > Aβ28 (Fig. 5a). A similar trend is obtained for the rate (gradient of the curve) of HO• production (Fig. 5b). In particular, Cu bound to the oxidized peptide reacts to consume ascorbate and produce HO• faster than Cu linked to the non-oxidized peptide. The catalytic behavior of copper bound to Aβox is between Cu–Aβ28 and Cu–Aβ7, in line with the binding mode of Cu(i) to Aβox which includes peptide with two oxidation reactions on the His residues and with the lower affinity of Aβox for copper. Thus, the binding mode of copper to Aβ is affected by Aβ oxidation, which in turn increases its catalytic activity for the production of ROS. As shown above by XANES and EPR experiments, the coordination of copper in the resting states is modified upon Aβ oxidation. The higher catalytic activity of Cu–Aβox and the resulting faster HO• production show that the coordination of Cu(i) and Cu(ii) within the “in-between” state (the only redox-competent species) is also modified.
The quantity of ROS released by the Cu–peptide system (corresponding to the HO• available for the oxidative damage of exogenous molecules) has also been evaluated. It is given by the fluorescence value at the plateau. The total amount of HO• trapped by CCA follows the trend: Aβ7 ≫ Aβox > Aβ28 (Fig. 5b, plateau of the curve), in line with a partial decrease of the Aβox ability to trap HO•.
Effect of H2O2 on Aβ oxidation and ascorbate consumption
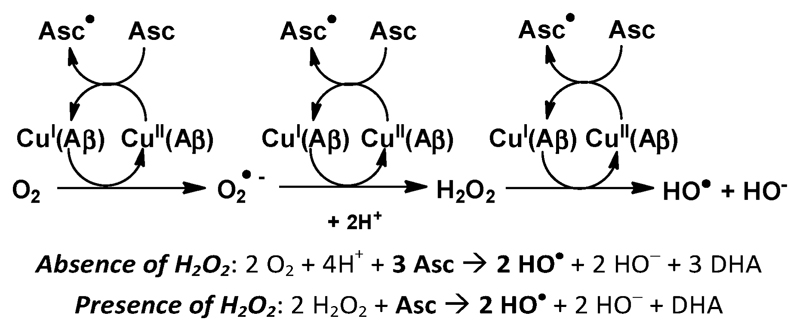
In the above studies, Aβ oxidation was induced by the ROS produced by the Cu–Aβ/ascorbate system, in the presence of molecular oxygen. The hydroxyl radical (HO•) produced by the Fenton-like reaction catalyzed by copper (Scheme 1) is the most reactive one and thus supposed to be mainly responsible for the oxidation of the Aβ residues. The other two ROS produced by the system, hydrogen peroxide and the superoxide anion, may react in some cases with a specific target, for instance with methionine residues in peptides and proteins, to form methionine sulfoxide. However, they are much less reactive than the hydroxyl radical. We were interested in comparing the behavior of the system, in terms of Aβ oxidation and ascorbate consumption, in the presence or absence of hydrogen peroxide, in order to evaluate the catalytic properties of the system and identify the targeted residues under these experimental conditions. As hydroxyl radicals are the sole species produced in the presence of H2O2, such a comparison should also provide information on the reactivity of O2 and O2•− with Aβ during MCO.
Scheme 1.
Metal-catalyzed Reactive Oxygen Species (ROS) production in the presence of the amyloid-β peptide (Aβ); Asc = ascorbate, DHA = dehydroascorbate.
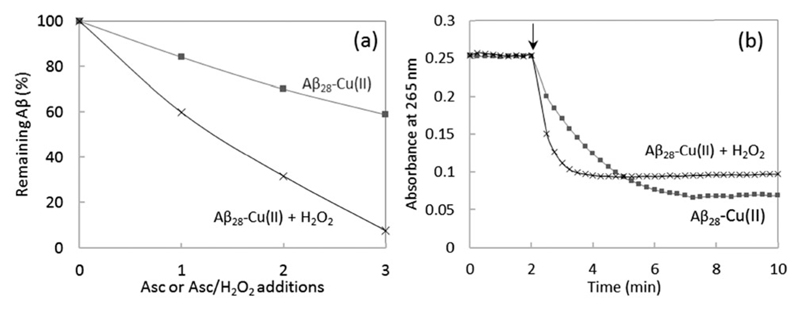
The MCO of Aβ was compared after 1, 2 or 3 successive additions of ascorbate or ascorbate and H2O2. The presence of H2O2 in solution leads to a 3 times higher oxidation of Aβ compared to the absence of H2O2 (Fig. 6a). This is in line with the expectation that Aβ oxidation is mainly due to HO•, based on the known mechanism of ROS production by Cu–Aβ for which the production of HO• is 3 times higher in the presence of H2O2 compared to the absence of H2O2 (Scheme 1). Indeed, in the absence of H2O2, 3 electrons (and hence 1.5 ascorbate) are needed to form one HO•. In the presence of H2O2 only one electron is needed to produce one HO•. There is no remaining non-oxidized Aβ peptide after 3 successive additions of ascorbate and H2O2, meaning that at least one amino acid residue of Aβ is oxidized. At the same time, the ascorbate consumption rate is also higher in the presence of hydrogen peroxide (Fig. 6b). The first electron transfer from Cu(i) to O2 is the rate limiting step of ROS production by Cu–Aβ;46 adding H2O2 eliminates this step and thus increases the ascorbate consumption rate.
Fig. 6.
(a) Remaining non-oxidized Aβ28 after successive additions of ascorbate (4 nmol, final conc. 20 μM) or ascorbate/H2O2 (4/10 nmol, final conc. 20/50 μM). Aβ28 25 μM and Cu2+ 20 μM, phosphate buffered pH 7.4 (50 mM). Ordinate: ratio between the peak area of non-oxidized Aβ28 and the reference peak area of non-ox Aβ28 (no addition of ascorbate nor H2O2). HPLC/HRMS, m/z 1087.8503, 816.1397, 653.1133 ([M + nH]n+, n = 3, 4, 5), 5 ppm accuracy. (b) Ascorbate consumption measured at 265 nm as a function of the reaction time; Aβ28 25 μM, Cu2+ 20 μM, phosphate buffered pH 7.4 (50 mM), ascorbate 20 μM, with or without H2O2 50 μM.
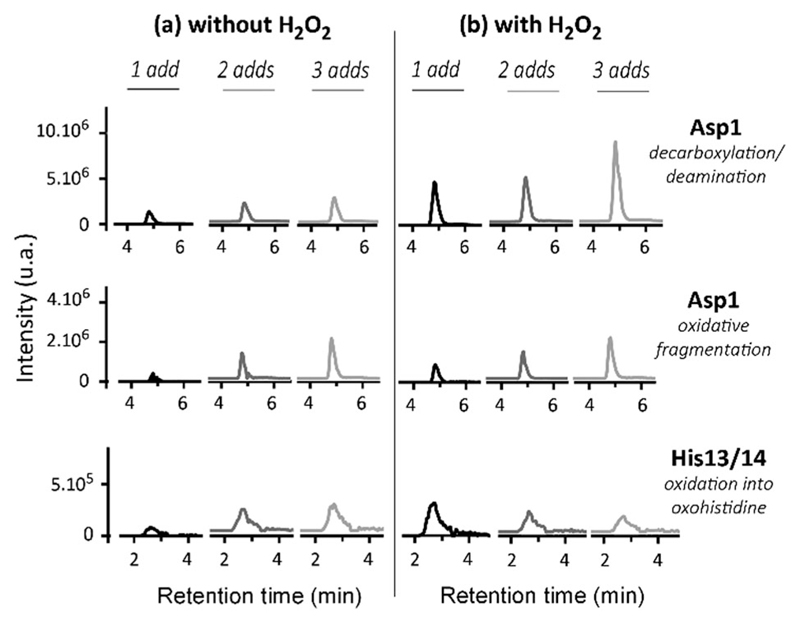
The oxidative damage on Aβ has been characterized using HPLC/HRMS after MCO in the presence or absence of H2O2 (Fig. 7). As expected, the oxidative damage undergone by Aβ is the same in the presence or absence of H2O2. This tends to indicate that the hydroxyl radical is mainly responsible for them. Asp1, His13 and His14 are the three major targets of HO• attack during metal-catalyzed oxidation. Their generation is dependent on the amount of ascorbate and H2O2 added in the solution: the higher the number of additions of ascorbate or ascorbate/H2O2, the higher the level of Aβ oxidation. Moreover, the presence of H2O2 exacerbates the effect (Fig. 7b) as the chromatographic peaks reach a higher level than in the absence of H2O2 (Fig. 7a) for a given [Asc]. This is in line with the higher degradation of Aβ in the presence of H2O2 (Fig. 7a). Thus, the presence of H2O2 (1) leads to the same oxidative damage of Aβ and (2) achieves a higher degradation state of Aβ per oxidized ascorbate. In other words, it is possible to achieve the same Aβ degradation state with 3 times less successive additions of ascorbate in the presence of H2O2, because the system is more efficient in producing HO• radicals.
Fig. 7.
Oxidation of Aβ in the absence or presence of H2O2. Trace chromatograms obtained by HPLC/HRMS of the Aβ oxidized tryptic peptides DAEFRdd (decarboxylation and deamination of Asp1), DAEFRox (oxidative fragmentation of Asp1), and HDSGYEVHHQK + 16 after 1 (black curve), 2 (dark grey curve) or 3 (light grey curve) additions of ascorbate (4 nmol, final conc. 20 μM; left panel) or ascorbate/H2O2 (4/10 nmol, final conc. 20/50 μM; right panel). Aβ28 25 μM and Cu(ii) 20 μM, phosphate buffered pH 7.4 (50 mM). Mass tolerance set at 5 ppm; m/z ratios used for the detection are specified in Table S1 (ESI†). The corresponding raw chromatograms are given in Fig. S7–S9 (ESI†). The oxidized residues were identified by HR-MS (Asp1 oxidation, see Table S2, ESI†) and by MS/MS (His13 and His14 oxidation reactions, see Fig. S10 and S11, ESI†).
Evolution of HO• release by Cu–Aβ upon oxidation
The above studies done with Aβox have been carried out after 80% of the peptide is oxidized. We also aim to understand how the oxidation of the peptide impacts the HO• release for different oxidation states of the peptide. The native Aβ16 peptide as well as the truncated or mutated peptides Aβ7, AcAβ16 and D7H–Aβ16 were studied and compared (see the Introductory remarks for more details on the peptides).
In order to study the HO• release by Cu–Aβ at increasing degrees of peptide oxidation, successive fixed amounts of ascorbate and hydrogen peroxide were added to the solution containing the Cu–Aβ complex. Based on the observation that with or without H2O2 the same damage occurs (Fig. 7), we used the system with H2O2 due to practical reasons (to avoid excessive dilution and HO• trapping at a very high ascorbate concentration33). The fluorescence intensity was measured at the end of the reaction (at the plateau) and thus provided information on the total amount of HO• trapped by CCA for each addition of ascorbate and H2O2 (fluorescence curves are given in the ESI,† Fig. S12).
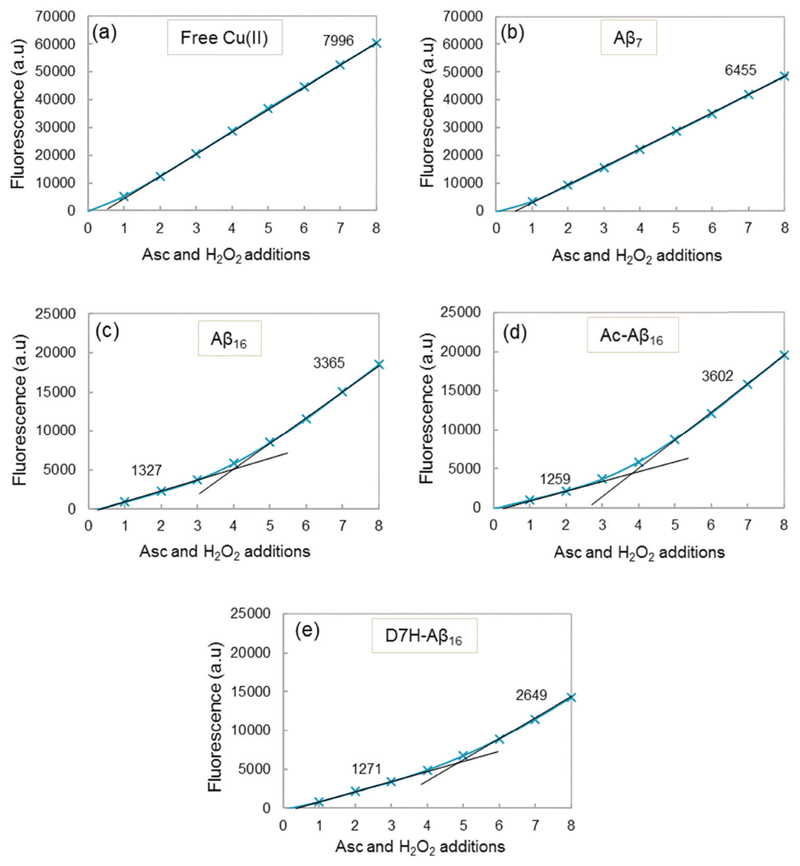
Fig. 8 shows the fluorescence at the plateau as a function of the number of ascorbate and H2O2 additions for free Cu (Fig. 8a) and for Cu coordinated to the peptides (Fig. 8b–e). The highest fluorescence was obtained with free copper (Fig. 8a) because the maximum HO• radicals are trapped by CCA (no peptide in solution). A similar result is obtained when copper is coordinated to Aβ7 (Fig. 8b), with a slightly lower gradient of the curve. This indicates that with Aβ7, only a small quantity of HO• is trapped by the peptide and therefore only a small fraction of Cu is bound to Aβ7 under these conditions (i.e. very diluted compared to spectroscopic studies). Copper, when coordinated to Aβ16, AcAβ16 or D7H–Aβ16, exhibits a strongly different behavior regarding the total amount of the HO• trapped by CCA (Fig. 8c–e). The total fluorescence after each addition of ascorbate and H2O2 is much lower than that of free copper, resulting in much lower gradients. As the HO• are produced at the metal center and because the peptide is coordinated to Cu, Aβ is the first target for the radical attack. This results in a strong decrease in the HO• radicals directly trapped by CCA.
Fig. 8.
Cu–Aβ induced HO• trapped by CCA. Fluorescence intensity at the plateau of phosphate buffered solution (50 mM) containing Cu (20 μM), peptide (25 μM), and CCA (0.5 mM) as a function of the number of ascorbate and H2O2 additions. A total of 8 additions of 2 μL ascorbate (2 mM) and 2 μL hydrogen peroxide (5 mM) are realized, i.e. 4 and 10 nmol for each addition respectively (initial concentrations reaching 20 and 50 μM for the first addition, respectively). Gradients of the linear parts of the curves are indicated in black. The gradient and determination coefficients of fits for each curve are given in the ESI,† Table S3.
In addition, the curves exhibit two different linear parts, the first one with a low gradient is obtained for the 3–4 first additions of ascorbate and H2O2, and the second one with a higher gradient is obtained after several additions of ascorbate and H2O2. The modification of the N-terminal part of the peptide does not appear to affect the HO• release, as the gradients are similar for Cu–Aβ16 and Cu–AcAβ16 (Fig. 8c and d). A comparable gradient is also obtained for Cu–(D7H–Aβ16) (Fig. 8e), for the first part of the curve. A similar behavior is observed with the longer Aβ28 and Aβ40 peptides (ESI,† Fig. S13).
The higher gradients observed in the second part of the fluorescence curves (Fig. 8c–e) can be linked to a change in copper coordination due to peptide oxidation by HO•. The increase in the slopes is observed after 3 additions of ascorbate and H2O2 for Aβ (Fig. 8c), i.e. after the peptide has been mostly oxidized at least once (Fig. 6a). The break of the curve for D7H–Aβ16 (Fig. 8e) occurs after 4 additions of ascorbate and H2O2 instead of 3 additions for Aβ16 (Fig. 8c). D7H–Aβ16 has one more His residue than Aβ16 and thus one additional target for HO• and one supplementary position for copper coordination. Supplementary addition of ascorbate and H2O2 is thus needed so that the peptide is sufficiently oxidized and the quantity of HO• scavenged by CCA increases.
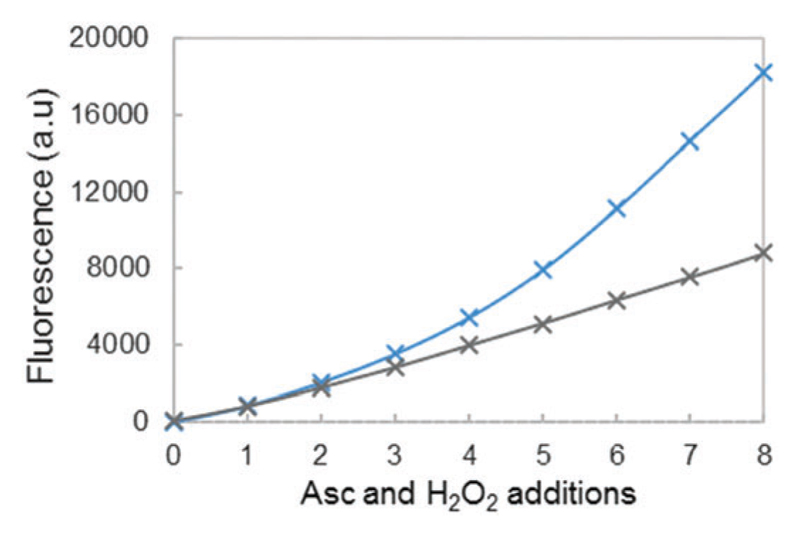
This is in line with data shown in Fig. 9, where fluorescence was compared at different Aβ/Cu ratios: 12/10 (blue curve) and 20/10 (grey curve). The break of the curve is no longer observed at the highest ratio 20/10, indicating that throughout the 8 successive additions of ascorbate and hydrogen peroxide, the total amount of HO• trapped by CCA remains constant. The Aβ peptide is still oxidized and it would lose its efficiency in coordinating copper. However, the resulting loosely bound copper would be further coordinated by the part of the non-oxidized Aβ peptide that remains in solution.
Fig. 9.
Fluorescence intensity at the plateau of phosphate buffered solution (50 mM) containing 20 μM of Cu, 25 μM (blue curve) or 50 μM (grey curve) of the Aβ16 peptide, and CCA (0.5 mM) as a function of the number of ascorbate and H2O2 additions. A total of 8 additions of 2 μL ascorbate (2 mM) and 2 μL hydrogen peroxide (5 mM) are realized, i.e. 4 and 10 nmol for each addition respectively (initial concentrations reaching 20 and 50 μM for the first addition, respectively). Gradients of the linear parts of the curves are indicated in black. The gradient and determination coefficients of fits for each curve are given in the ESI,† Table S3
By comparison of the fluorescence gradients after 3 additions of ascorbate and hydrogen peroxide (Fig. 8c, first and second gradients), it appears that the Aβ peptide is oxidized to the point of being two to three times less efficient in HO• scavenging but still two times more efficient than the Aβ7 peptide (Fig. 8b). This is in line with a Cu center mainly bound to the Aβox peptide but not to the Aβ7 peptide.
Concluding remarks
As shown above, the metal catalyzed oxidation of the Aβ peptide leads to a change in copper coordination for both the Cu(i) and Cu(ii) resting states as probed, respectively, by XANES and EPR and it is anticipated that this is also true for the catalytic species involved in ROS production, the “in-between” state. Indeed, it was previously described that the production of HO• radicals by the Aβ-copper system proceeds via an “in-between” state involving Asp1, His13 and His14 in the coordination sphere of copper.21 A similar oxidative protein and its consequences on the Cu binding site and on the enzyme activity have been recently reported for the Cu, Zn SOD, in the presence of H2O247 and in the presence of Cu/asc/O2 as a model system.48
Such coordination modifications impact the rate of HO• production via two additive mechanisms: (i) a direct one due to a different binding site in the “in-between” state that has faster kinetics and (ii) an indirect one, relying on a decrease in Cu binding affinities for Aβox. This latter mechanism leads to a significant amount of free Cu under diluted conditions that would contribute to enhanced ROS production. In addition, the oxidation of the Aβ peptide induces a less efficient scavenging of the HO• that could be due to a different Cu coordination site as discussed above or/and to a lower number of potential targets on the peptide. It was indeed previously shown that the oxidation of the Aβ residues stops after a certain reaction time, showing that HO• is no longer trapped by Aβ.21
In a more biological environment, Aβ oxidation by the Cu–Aβ complex triggers a positive feedback loop that leads to a more deleterious oxidative stress due to both an enhanced ROS production rate and a decreased HO• scavenging ability.
Supplementary Material
† Electronic supplementary information (ESI) available: Monoisotopic masses of the peptide, mass spectrometric data, fluorescence curves, linear combination fitting, UV-vis data, HPLC-UV data, and EPR data. See 10.1039/c6mt00150e
Acknowledgements
The authors acknowledge L. Debrauwer and E. Jamin for providing the Orbitrap mass spectrometer (MetaToul-AXIOM, INRA, UMR1331 Toxalim, Toulouse, France) and the ESRF for provision of synchrotron radiation on the FAME beamline (Proposal 30-02-1099). L. Rechignat is acknowledged for EPR experiments and M. Jones is acknowledged for the preparation of oxidized peptide and the UV-Vis spectra. This work was supported by the French National Agency of Research (ANR-13-BSV5-0016). C. H. thanks the ERC aLzINK – Contract no. 638712 for their financial support.
Notes and references
- 1.Selkoe DJ. Science. 2002;298:789. doi: 10.1126/science.1074069. [DOI] [PubMed] [Google Scholar]
- 2.Glenner GG, Wong CW. Biochem Biophys Res Commun. 1984;120:885. doi: 10.1016/s0006-291x(84)80190-4. [DOI] [PubMed] [Google Scholar]
- 3.Haass C, Schlossmacher MG, Hung AY, Vigo-Pelfrey C, Mellon A, Ostaszewski BL, Lieberburg I, Koo EH, Schenk D, Teplow DB, Selkoe DJ. Nature. 1992;359:322. doi: 10.1038/359322a0. [DOI] [PubMed] [Google Scholar]
- 4.Lovell MA, Robertson JD, Teesdale WJ, Campbell JL, Markesbery WR. J Neurol Sci. 1998;158:47. doi: 10.1016/s0022-510x(98)00092-6. [DOI] [PubMed] [Google Scholar]
- 5.Miller LM, Wang Q, Telivala TP, Smith RJ, Lanzirotti A, Miklossy J. J Struct Biol. 2006;155:30. doi: 10.1016/j.jsb.2005.09.004. [DOI] [PubMed] [Google Scholar]
- 6.Leskovjan AC, Lanzirotti A, Miller LM. NeuroImage. 2009;47:1215. doi: 10.1016/j.neuroimage.2009.05.063. [DOI] [PMC free article] [PubMed] [Google Scholar]
- 7.Huang X, Atwood CS, Hartshorn MA, Multhaup G, Goldstein LE, Scarpa RC, Cuajungco MP, Gray DN, Lim J, Moir RD. Biochemistry. 1999;38:7609. doi: 10.1021/bi990438f. [DOI] [PubMed] [Google Scholar]
- 8.Hureau C, Faller P. Biochimie. 2009;91:1212. doi: 10.1016/j.biochi.2009.03.013. [DOI] [PubMed] [Google Scholar]
- 9.Opazo C, Huang X, Cherny RA, Moir RD, Roher AE, White AR, Cappai R, Masters CL, Tanzi RE, Inestrosa NC, Bush AI. J Biol Chem. 2002;277:40302. doi: 10.1074/jbc.M206428200. [DOI] [PubMed] [Google Scholar]
- 10.Smith DG, Cappai R, Barnham KJ. Biochim Biophys Acta, Biomembr. 2007;1768:1976. doi: 10.1016/j.bbamem.2007.02.002. [DOI] [PubMed] [Google Scholar]
- 11.Reybier K, Ayala S, Alies B, Rodrigues JV, Bustos Rodriguez S, La Penna G, Collin F, Gomes CM, Hureau C, Faller P. Angew Chem, Int Ed. 2016;55:1085. doi: 10.1002/anie.201508597. [DOI] [PubMed] [Google Scholar]
- 12.Farhataziz RA, Ross A. Hydroxyl radical and perhydroxyl radical and their radical ions, NSRDS-NBS. 1977;59 [Google Scholar]
- 13.Näslund J, Schierhorn A, Hellman U, Lannfelt L, Roses AD, Tjernberg LO, Silberring J, Gandy SE, Winblad B, Greengard P. Proc Natl Acad Sci U S A. 1994;91:8378. doi: 10.1073/pnas.91.18.8378. [DOI] [PMC free article] [PubMed] [Google Scholar]
- 14.Barnham KJ, Masters CL, Bush AI. Nat Rev Drug Discovery. 2004;3:205. doi: 10.1038/nrd1330. [DOI] [PubMed] [Google Scholar]
- 15.Sayre LM, Perry G, Smith MA. Chem Res Toxicol. 2008;21:172. doi: 10.1021/tx700210j. [DOI] [PubMed] [Google Scholar]
- 16.Hureau C. Coord Chem Rev. 2012;256:2164. [Google Scholar]
- 17.Migliorini C, Porciatti E, Luczkowski M, Valensin D. Coord Chem Rev. 2012;256:352. [Google Scholar]
- 18.Hureau C, Dorlet P. Coord Chem Rev. 2012;256:2175. [Google Scholar]
- 19.Hureau C, Coppel Y, Dorlet P, Solari PL, Sayen S, Guillon E, Sabater L, Faller P. Angew Chem, Int Ed. 2009;48:9522. doi: 10.1002/anie.200904512. [DOI] [PubMed] [Google Scholar]
- 20.Hureau C, Balland V, Coppel Y, Solari PL, Fonda E, Faller P. JBIC, J Biol Inorg Chem. 2009;14:995. doi: 10.1007/s00775-009-0570-0. [DOI] [PubMed] [Google Scholar]
- 21.Cassagnes L-E, Hervé V, Nepveu F, Hureau C, Faller P, Collin F. Angew Chem, Int Ed. 2013;52:11110. doi: 10.1002/anie.201305372. [DOI] [PubMed] [Google Scholar]
- 22.Balland V, Hureau C, Saveant J-M. Proc Natl Acad Sci U S A. 2010;107:17113. doi: 10.1073/pnas.1011315107. [DOI] [PMC free article] [PubMed] [Google Scholar]
- 23.Inoue K, Garner C, Ackermann BL, Oe T, Blair IA. Rapid Commun Mass Spectrom. 2006;20:911. doi: 10.1002/rcm.2395. [DOI] [PubMed] [Google Scholar]
- 24.Kowalik-Jankowska T, Ruta M, Wiśniewska K, Łankiewicz L, Dyba M. J Inorg Biochem. 2004;98:940. doi: 10.1016/j.jinorgbio.2004.03.001. [DOI] [PubMed] [Google Scholar]
- 25.Inoue K, Nakagawa A, Hino T, Oka H. Anal Chem. 2009;81:1819. doi: 10.1021/ac802162n. [DOI] [PubMed] [Google Scholar]
- 26.Manevich Y, Held KD, Biaglow JE. Radiat Res. 1997;148:580. [PubMed] [Google Scholar]
- 27.Proux O, Biquard X, Lahera E, Menthonnex JJ, Prat A, Ulrich O, Soldo Y, Trevisson P, Kapoujyan G, Perroux G, Taunier P, et al. Phys Scr, T. 2005;115:970. [Google Scholar]
- 28.Proux O, Nassif V, Prat A, Ulrich O, Lahera E, Biquard X, Menthonnex JJ, Hazemann JL. J Synchrotron Radiat. 2006;13:59. doi: 10.1107/S0909049505037441. [DOI] [PubMed] [Google Scholar]
- 29.Minicozzi V, Stellato F, Comai M, Serra MD, Potrich C, Meyer-Klaucke W, Morante S. J Biol Chem. 2008;283:10784. doi: 10.1074/jbc.M707109200. [DOI] [PubMed] [Google Scholar]
- 30.Hureau C. Coord Chem Rev. 2012;256:2164. [Google Scholar]
- 31.Syme CD, Nadal RC, Rigby SEJ, Viles JH. J Biol Chem. 2004;279:18169. doi: 10.1074/jbc.M313572200. [DOI] [PubMed] [Google Scholar]
- 32.Shearer J, Szalai VA. J Am Chem Soc. 2008;130:17826. doi: 10.1021/ja805940m. [DOI] [PMC free article] [PubMed] [Google Scholar]
- 33.Cheignon C, Collin F, Faller P, Hureau C. Dalton Trans. 2016;45:12627. doi: 10.1039/c6dt01979j. [DOI] [PMC free article] [PubMed] [Google Scholar]
- 34.Alies B, Badei B, Faller P, Hureau C. Chem – Eur J. 2012;18:1161. doi: 10.1002/chem.201102746. [DOI] [PubMed] [Google Scholar]
- 35.Young TR, Kirchner A, Wedd AG, Xiao Z. Metallomics. 2014;6:505. doi: 10.1039/c4mt00001c. [DOI] [PubMed] [Google Scholar]
- 36.Feaga HA, Maduka RC, Foster MN, Szalai VA. Inorg Chem. 2011;50:1614. doi: 10.1021/ic100967s. [DOI] [PubMed] [Google Scholar]
- 37.Kau LS, Spira-Solomon DJ, Penner-Hahn JE, Hodgson KO, Solomon EI. J Am Chem Soc. 1987;109:6433. [Google Scholar]
- 38.Himes RA, Park GY, Siluvai GS, Blackburn NJ, Karlin KD. Angew Chem, Int Ed. 2008;47:9084. doi: 10.1002/anie.200803908. [DOI] [PMC free article] [PubMed] [Google Scholar]
- 39.Himes RA, Park GY, Barry AN, Blackburn NJ, Karlin KD. J Am Chem Soc. 2007;129:5352. doi: 10.1021/ja0708013. [DOI] [PubMed] [Google Scholar]
- 40.Alies B, Bijani C, Sayen S, Guillon E, Faller P, Hureau C. Inorg Chem. 2012;51:12988. doi: 10.1021/ic302097d. [DOI] [PubMed] [Google Scholar]
- 41.Hong L, Carducci TM, Bush WD, Dudzik CG, Millhauser GL, Simon JD. J Phys Chem B. 2010;114:11261. doi: 10.1021/jp103272v. [DOI] [PMC free article] [PubMed] [Google Scholar]
- 42.Nakamura M, Shishido N, Nunomura A, Smith MA, Perry G, Hayashi Y, Nakayama K, Hayashi T. Biochemistry. 2007;46:12737. doi: 10.1021/bi701079z. [DOI] [PubMed] [Google Scholar]
- 43.Nadal RC, Rigby SEJ, Viles JH. Biochemistry. 2008;47:11653. doi: 10.1021/bi8011093. [DOI] [PubMed] [Google Scholar]
- 44.Noël S, Perez F, Pedersen JT, Alies B, Ladeira S, Sayen S, Guillon E, Gras E, Hureau C. J Inorg Biochem. 2012;117:322. doi: 10.1016/j.jinorgbio.2012.05.016. [DOI] [PubMed] [Google Scholar]
- 45.Alies B, Sasaki I, Proux O, Sayen S, Guillon E, Faller P, Hureau C. Chem Commun. 2013;49:1214. doi: 10.1039/c2cc38236a. [DOI] [PubMed] [Google Scholar]
- 46.Strizhak P. Theor Exp Chem. 1994;30:239. [Google Scholar]
- 47.Gottfredsen RH, Larsen UG, Enghild JJ, Petersen SV. Redox Biol. 2013;1:24. doi: 10.1016/j.redox.2012.12.004. [DOI] [PMC free article] [PubMed] [Google Scholar]
- 48.Uehara H, Luo S, Aryal B, Levine RL, Rao VA. Free Radical Biol Med. 2016;94:161. doi: 10.1016/j.freeradbiomed.2016.01.020. [DOI] [PMC free article] [PubMed] [Google Scholar]
Associated Data
This section collects any data citations, data availability statements, or supplementary materials included in this article.


