

Novel atomic magnetometry technology may lead to high sensitivity, room temperature chip-size magnetic probes.
Abstract
The nonlinear magneto-optical rotation (NMOR) effect has prolific applications ranging from precision mapping of Earth’s magnetic field to biomagnetic sensing. Studies on collisional spin relaxation effects have led to ultrahigh magnetic field sensitivities using a single-beam Λ scheme with state-of-the-art magnetic shielding/compensation techniques. However, the NMOR effect in this widely used single-beam Λ scheme is peculiarly small, requiring complex radio-frequency phase-locking protocols. We show the presence of a previously unknown energy symmetry–based nonlinear propagation blockade and demonstrate an optical inelastic wave-mixing NMOR technique that breaks this NMOR blockade, resulting in an NMOR optical signal-to-noise ratio (SNR) enhancement of more than two orders of magnitude never before seen with the single-beam Λ scheme. The large SNR enhancement was achieved simultaneously with a nearly two orders of magnitude reduction in laser power while preserving the magnetic resonance linewidth. This new method may open a myriad of applications ranging from biomagnetic imaging to precision measurement of the magnetic properties of subatomic particles.
INTRODUCTION
The nonlinear magneto-optical rotation (NMOR) effect (1, 2) describes the light intensity–dependent rotation of the polarization plane of a linearly polarized light field traversing a magnetized medium. The fundamental physical process behind the NMOR effect (3) is the differential response of the two oppositely polarized circular components of a linearly polarized probe field that couple different Zeeman-shifted sublevels of an atom in the presence of a magnetic field. In the semiclassical picture of the polarimetry-based NMOR effect, different polarization components of the probe field experience different optical dispersion, causing the rotation of the polarization plane of the probe field. For a three-state atomic system coupling to a linearly polarized probe field (Fig. 1A) (3–8), assuming that the initial population is equally distributed between the Zeeman states, the NMOR effect can be derived using third-order perturbation theory (9). The nondiagonal interaction Hamiltonian of this single-beam Λ system is given by
| (1) |
which, when combined with the diagonal Hamiltonian, leads to a third-order polarization for the different probe components of (9, 10)
| (2) |
Fig. 1. Energy levels and laser couplings of the inelastic optical WM-enhanced NMOR effect.
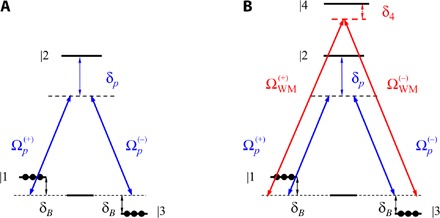
(A) Simplified single-beam Λ scheme in the presence of a magnetic field and a linearly polarized probe field. The lower three states are the magnetic sublevels of a generic F = 1 manifold (from left to right: MF = −1, 0, +1) of an alkali atom. (B) Simplified optical WM scheme with linearly polarized probe and wave-mixing fields. For mathematical simplicity, only excited states |2〉 and |4〉 are considered.
In Eq. 2, δB = ± μBgFBz is the magnetic field (Bz)–induced Zeeman frequency shift, κ is proportional to the product of the medium density and the relevant optical transition strength, ρii (i = 1, 2, 3) represents the atomic population in state |i〉 (we have taken ), and are the Rabi frequencies of the circular components of the linearly polarized probe field , with Dij being the dipole matrix element of the relevant transition. In addition, δp is the one-photon probe laser detuning from the excited electronic state |2〉 having a resonance linewidth of Γ = γ21 = γ23. Equation 2 has a Lorentzian line shape with a Zeeman resonance linewidth of γ0 = γ31 = γ13. Seminal studies on spin exchange and relaxation effects (11–24) have shown that substantially reducing the Zeeman decoherence rate γ0 can lead to ultrahigh magnetic field detection sensitivities (13–24).
The single-beam Λ scheme shown in Fig. 1A has two symmetric and competing two-photon transitions: |1〉 → |3〉 transition requires the absorption of the component and the emission of the component, whereas the |3〉 → |1〉 transition requires the absorption of the component and the emission of the component. That is, each field component can only grow at the expense of the other component. However, because the states |1〉 and |3〉 are initially equally populated and are the components of the same probe field, which is the only source of energy, the symmetric and competing nature of two-photon processes dictates that both field components cannot change appreciably and that the NMOR effect is therefore self-limiting. This leads to
| (3) |
where L is the medium length and Φ is the NMOR angle derived from the probe field (3). Equation 3 exhibits an energy symmetry–based nonlinear field propagation blockade. This previously unknown NMOR blockade is the primary reason why although the polarization source term (Eq. 2) for the probe field in the conventional single-beam Λ scheme has a third-order nonlinearity, the corresponding field growth and the NMOR angle (Eq. 3) are only linearly proportional to the atom density and medium length. It is this energy symmetry requirement, which results in a field propagation blockade, that strongly limits the full NMOR effect in the conventional single-beam Λ-based atomic magnetometry.
RESULTS
The optical wave-mixing (WM) scheme (Fig. 1B) breaks this probe energy symmetry–based self-limiting effect by introducing an auxiliary inelastic WM process. This WM field modifies the nonlinear dispersion of the coherently populated intermediate states at the probe frequency via a deep-inelastic scattering process (see also discussion later) (25–27), which enables directional energy flow from the WM field to the probe field, thereby removing the restriction to the probe components’ growth. The resulting complex nonlinear dispersion and medium magnetic dichroism lead to a large differential change in the circularly polarized components of the probe field, resulting in a large enhancement of the ground-state Zeeman coherence that leads to nonlinear polarization rotation and ellipsometry at the probe frequency. The nondiagonal interaction Hamiltonian of this four-level system is given by
| (4) |
which leads to a third-order polarization for different probe components of (9, 10)
| (5) |
Here, for simplicity, we have taken δ4 ≫ γ41 = γ43 = Γ. The first term in Eq. 5 is the same single-beam three-state contribution as in Eq. 2, whereas the second term arises from cross-phase modulation by the WM field, which drives the probe field through the corresponding Maxwell equations.
Equation 5 has two important features: (i) It has the same magnetic resonance denominator as in Eq. 2, indicating an identical magnetic resonance linewidth; and (ii) it provides a WM driving source term that modifies the complex material dispersion and the shared ground-state Zeeman coherence at the probe frequency. This latter feature lifts the self-limiting restriction through a coherent inelastic scattering process and corresponding energy transfer (see discussion later), resulting in a significant enhancement to the NMOR optical signal-to-noise ratio (SNR) even when a substantially reduced probe field intensity is used. The reduced probe power requirement enables NMOR operations using an atomic medium with an even lower Zeeman decoherence rate [a smaller γ0 would lead to a narrower magnetic resonance (see Discussion) (28–30)].
Although the argument of removing the probe energy symmetry–based NMOR blockade provides an intuitive explanation to the propagation-based NMOR enhancement effect, finding analytical solutions for the probe and WM polarization components is a formidable task. To verify the above WM propagation–based predictions, we numerically solved 16 density matrix equations of motion and 4 Maxwell equations for the probe and WM polarization components without any approximation (see Materials and Methods). In Fig. 2 (A and B), we show probe field NMORs of the optical WM scheme and the single-beam Λ scheme as functions of δB/γ31 at z = 1 cm. Here, the NMOR optical signal amplitude from the optical WM technique is about a factor of 120 times larger than that of the widely used conventional single-beam Λ technique. Yet, the magnetic resonance line shapes are completely indistinguishable if overlapped together, attesting to the preservation of the magnetic resonance linewidth expected from Eqs. 2 and 5. In Fig. 2C, we compare the NMORs of the two techniques as a function of the normalized propagation distance z/L at a fixed Zeeman shift of 5 Hz. The pronounced nonlinear growth of the NMOR signal (red trace) highlights the superior performance of the optical WM technique. We stress that this performance cannot be matched by the single-beam Λ scheme, which, because of the restriction of symmetry and energy conservation, is limited only to linear growth (see Eq. 3 and the blue line in Fig. 2C). In Fig. 2 (D and E), we compare the probe NMOR angle Φ, plotted as functions of z/L and of δB/γ31, for both the WM technique (Fig. 2D) and the single-beam Λ technique (Fig. 2E). The inset in Fig. 2E shows, after a factor of 120 magnification of the vertical axis, a line shape identical to that in Fig. 2D.
Fig. 2. Numerical calculations of inelastic optical WM-enhanced NMOR.
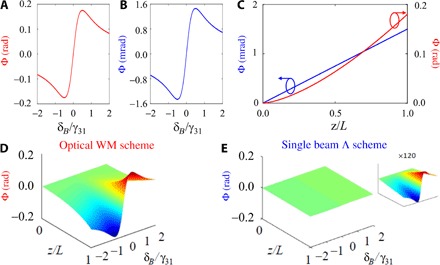
NMOR effect of the optical WM technique (A) and the single-beam Λ technique (B) as functions of δB/γ31 at z = 1 cm. Parameters are chosen to show a representative 120-fold NMOR optical SNR enhancement. When the blue trace in (B) is rescaled vertically by a factor of 120, the magnetic resonance line shape is indistinguishable from that of the red trace, attesting to the fact that the WM scheme does not alter the magnetic resonance line shape. (C) NMOR as a function of the normalized propagation distance z/L for the single-beam Λ scheme (blue arrowed circle indicates the left scale) and the WM scheme (red arrowed circle indicates the right scale) at δB/2π = 5 Hz. (D and E) Probe NMOR angle as a function of z/L and δB/γ31 with and without the WM field. Parameters: = 200 kHz, = 100 kHz, δp/2π = −5 GHz, δ4/2π = −2 GHz, Γ/2π = 300 MHz, γ0/2π = 10 Hz, κ = 109/(cm s), = 0.5. Inset in (E): Magnetic resonance line shape of the single-beam Λ scheme is identical to that shown in (D) after rescaling the vertical axis by a factor of 120.
The theoretical optical noise–limited sensitivity of the inelastic optical WM scheme, δBWM, relative to that of the single-beam Λ scheme, δBΛ, can be expressed as (3, 31–33)
| (6) |
where M is the NMOR enhancement factor by the WM scheme, and ΦWM and ΦΛ are the magnetic field–dependent polarization rotation angles for the two schemes. We have also taken the optical polarimetry angular resolution as δΦWM = δΦΛ = δΦ. By solving Maxwell’s equations for the probe and WM polarization components, one obtains the polarization plane rotation angles ΦWM(B; z) and ΦΛ(B; z)(see Fig. 2, D and E) from which the sensitivity enhancement factor M can be evaluated. Equation 6 shows that the theoretical optical noise–limited sensitivity of the optical WM scheme can be a factor of M better than that of the single-beam Λ scheme, which has an experimentally demonstrated optical-limited sensitivity on the order of using 85Rb and 87Rb atoms (17, 20, 31, 32) with state-of-the-art shielding, residual field compensation coils, and radio-frequency phase-locking electronics. In Fig. 3A, we plot M as a function of the normalized WM field Rabi frequency, showing a 120-fold NMOR optical signal amplitude enhancement for the case shown in Fig. 2 (A to E). As expected, when ΩWM → 0, M → 1, recovering the result of the single-beam three-state Λ scheme. Notice the presence of an optimal WM Rabi frequency where the maximum NMOR optical signal amplitude enhancement can be achieved. Figure 3B shows the ground-state Zeeman coherence and state populations as functions of magnetic detuning δB. The large one-photon detunings and substantially reduced probe and WM field intensities effectively eliminate one-photon and two-photon power broadening of the Zeeman states. In addition, the generated Zeeman coherence is 30% of the maximum Zeeman coherence, which is significant for such a weak continuous-wave excitation process. However, under the same conditions, the Zeeman coherence in the conventional single-beam Λ scheme is 150 times smaller because of the energy symmetry restriction described before.
Fig. 3. Theoretical optical noise–limited sensitivity, Zeeman populations, and ground-state Zeeman coherence.

(A) Optical noise–limited sensitivity enhancement factor M as a function of for B ≈ 0 and z = 1 cm. Inset: sensitivity enhancement factor (dashed line) M → 1 as . The dotted line is the theoretical sensitivity limit of the single-beam Λ scheme (3). Parameters: κ = 109/(cm s), = 300 kHz, δp/2π = −5 GHz, and δ4/2π = −3 GHz. The arrow on the horizontal axis labels the value of that maximizes the enhancement. (B). Zeeman state populations (black solid and dashed curve; arrowed circles indicate the left scale) and ground-state Zeeman coherence (green dashed curve; arrowed circle indicates the right scale) as functions of the Zeeman frequency shift δB for the WM method. Notice that the ground-state Zeeman coherence is close to 30% of the maximum Zeeman coherence, which is significant for such a weak continuous-wave WM excitation process [ = 200 kHz]. This contrasts sharply with the usual single-beam Λ method where the ground-state Zeeman coherence is two orders of magnitude smaller (not shown).
In Fig. 4 (A and B), we show typical experimental NMOR optical SNR enhancement using the optical WM technique in our shield-limited setup (see Materials and Methods). When the WM light field is present, the NMOR optical SNR (Fig. 4A, red trace) is enhanced by more than two orders of magnitude over the NMOR signal of the usual single-beam Λ scheme (Fig. 4A, blue trace), even without optical pumping of the nonaccessed hyperfine states. However, as predicted by Eq. 5, the line shape of the magnetic resonance remains unchanged. Experimentally, using rubidium D1 transitions, we observed more than 500-fold NMOR optical SNR enhancement in the time domain (limited by the electronic noise of the oscilloscope) without optical pumping of nonaccessed ground-state hyperfine states, with both lasers detuned as much as eight Doppler linewidths from the one-photon resonance. By optically pumping the nonaccessed hyperfine states, we observed an additional factor of 2 or larger NMOR optical SNR enhancement, resulting in a total NMOR optical SNR enhancement of >1000 at 311 K (38°C). Figure 4B shows a similar scan, but with a much weaker probe field, advantageous operational conditions for ultrahigh precision measurements that eliminate any one-photon or two-photon power broadening of the Zeeman states. At this low probe intensity, no magnetic resonance can be observed when the WM field is not present (blue trace, that is, the single-beam Λ scheme), even with long data acquisition times and extensive averaging of a large data set. However, when a weak WM field (on the order of the same weak probe) is turned on, a pronounced NMOR signal is clearly observed, demonstrating the superior performance of the nonlinear optical WM technique and the dramatic effect of the removal of the energy symmetry–based NMOR propagation blockade.
Fig. 4. Optical WM-enhanced NMOR signal in 87Rb.
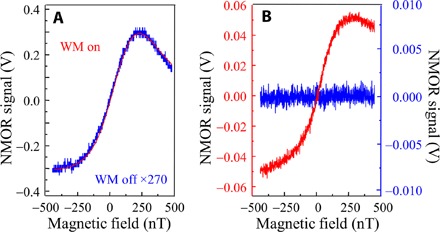
(A) Ip = 580 μW/cm2 with δp/2π = −5 GHz (F = 2 → F′ = 2) and IWM = 80 μW/cm2 with δ4/2π = −2 GHz (F = 2 → F′ = 2). The blue trace is scaled up by a factor of 270 to match the NMOR signal of the red trace. (B) Ip = 30 μW/cm2 with δp/2π = −5 GHz and IWM = 20 μW/cm2 with δ4/2π = −2 GHz. At this low probe intensity, no NMOR signal can be detected using the single-beam Λ method (blue trace). The NMOR signal is clearly seen using the optical WM method (red trace). All traces are averaged over 16 scans, each with a 5-ms duration. Temperature is 311 K. The dominant fast noise is oscilloscope electronic noise. The asymmetry in resonance line shape is mainly due to the large one-photon detunings. The vertical axis (voltage) is a measure of the photocurrent derived from a standard polarimetry detector using a precision resistor. The angle between the linear probe and WM field polarizations is 45°.
To further validate the NMOR optical SNR enhancement, we show in Fig. 5 NMOR optical noise power spectral density analysis of the data shown in Fig. 4A. It is seen that the noise power spectral density of the optical WM scheme (red trace) is at the same level as that of the single-beam Λ scheme (blue trace), validating the assertion that the nonlinear optical WM technique does not introduce appreciable additional optical noise. However, to produce an NMOR signal amplitude to match that of the optical WM technique, the intensity of the probe field in the single-beam Λ technique must be substantially increased (typically by 50- to 80-fold). As expected, under such strong excitation, the probe noise power spectral density (pink trace) is more than 20 dB worse. The NMOR signal noise power spectral density analysis up to 10 kHz exhibits similar characteristics, demonstrating the superior broadband performance and capability of this novel NMOR optical SNR enhancement technique.
Fig. 5. NMOR optical noise power spectral densities.
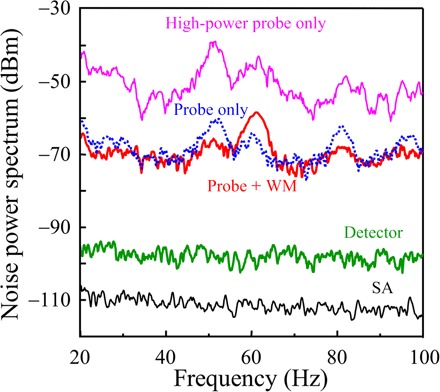
Noise power spectral density of data shown in Fig. 4A. Blue trace (dotted): single-beam Λ method. Red trace (solid): optical WM method. Note that the noise power spectral density of the optical WM method is comparable to the single-beam Λ method. Pink trace (top): noise power spectral density of the single-beam Λ method with 50 times higher probe intensity to match the NMOR signal of the optical WM method. Green trace: detector electronic noise. Black trace [spectrum analyzer (SA)]: the intrinsic noise of the SA.
Evidence of inelastic WM and scattering process can be seen in Fig. 6. In Fig. 6A, the absorption (energy loss) of the WM light field is shown as a function of the input WM field intensity. As the input WM field intensity increases for the enhancement of probe NMOR, the WM field energy at the exit of the medium decreases rapidly (black dots), indicating significant energy flows from the WM field to the probe field. The observed fast energy loss of the total energy of the WM field is direct evidence of an inelastic WM and scattering process that is characteristically different from double-Λ (elastic) four-wave–mixing processes. In Fig. 6B, we show the amplitude of the NMOR signal as a function of input WM field intensity for fixed probe intensities of 9 and 22 μW/cm2. The rapid growth of the NMOR signal with a clear threshold is indicative of a highly efficient coherent “amplification” (stimulated emission) process. Figure 6C shows the results of numerical calculations of the WM field where the signature of deep-inelastic WM and scattering processes (as shown in Fig. 6A) is exhibited. Here, both circularly polarized components of the WM field are plotted as functions of z/L and δB/γ31. The simultaneous z/L-dependent reduction of both components is the direct evidence of an inelastic WM process (26, 27), which is fundamentally different from a conventional elastic WM and scattering process such as double-Λ four-wave–mixing (cyclic) processes.
Fig. 6. Signature and threshold of deep-inelastic WM and scattering process.

(A) Normalized WM field loss (at the cell exit) as a function of WM field input intensity. Ip = 22 μW/cm2 with δp/2π = −3 GHz and δ4/2π = −2 GHz. Temperature is 311 K. Black dots and arrow indicate the right scale, and the green triangles and arrow indicate the left scale. (B) The threshold behaviors of a coherent WM process at different probe intensities. The lines are guides to the eye to show the presence of a “WM-triggered lasing threshold,” which is expected from the onset of coherent directional energy flow in the WM process. Detunings and temperature are the same as in (A). (C and D) Numerical calculation of energy loss of the circularly polarized WM field components. The significant and simultaneous energy loss of both components is characteristic of a deep-inelastic WM and scattering process. Parameters used in calculation are the same as in Fig. 2.
DISCUSSION
We first emphasize that the purpose of our work is to demonstrate the presence of a previously unknown energy symmetry–based NMOR propagation blockade and an inelastic WM and scattering process that breaks this detrimental blockade. Further studies with better shielding must be undertaken to demonstrate better than sensitivity. Such performance cannot be achieved with the simple magnetic shield and signal detection electronics used in our experiment. However, with our simple magnetic shield and detection electronics, we demonstrate that the WM technique can result in an NMOR optical SNR enhancement of more than two orders of magnitude with a clearly demonstrated performance trend when compared with the well-studied and widely accepted single-beam Λ technique. It is therefore reasonable to expect that this nonlinear propagation-based enhancement effect will occur when state-of-the-art shielding and electronics are used. We compared the performance of the WM technique with the well-known single-beam Λ technique using our simple magnetic shield and detection electronics. We emphasize that this comparison is very instructive and valid in demonstrating the key underlying physics and the advantages of the optical WM technique because the widely used single-beam Λ technique has already been shown to be able to reach sensitivity with state-of-the-art magnetic shielding and phase-locking electronics (17, 18, 20). All experimental evidence and theoretical calculations indicate that the NMOR optical SNR enhancement is robust and should remain when more sophisticated shielding is used.
Precision spectroscopy of warm vapor is very complex. Many transitions coexist and may also contribute to the overall NMOR processes. Nevertheless, the NMOR process shown in the simplified model illustrated in Fig. 1B captures the key underlying physics. The key is the removal of the probe field NMOR propagation blockade by an inelastic optical WM process. NMOR enhancement effects have been observed on both the red and blue sides of both the D1 and D2 (and combinations thereof) transitions of 87Rb and 85Rb. However, we stress that, because the probe and WM lasers are far detuned (even a very large difference in wavelength in the case of D1-D2 setup) and because both laser intensities are orders of magnitude below the saturation intensity, our optical WM method is neither a pump-probe scheme nor an electromagnetically induced transparency (EIT) scheme (6–8, 34, 35). In most cases that we studied, large NMOR enhancements were readily observable even when the WM field intensity was a factor of 5 to 8 lower than the probe field, with a frequency difference of several gigahertz. All pump-probe–type experiments rely on the linearized response of a weak field probing a strongly saturated transition by a pump field. Our system clearly does not satisfy any of these conditions. It should also be clear that neither three-state EIT schemes nor any EIT-based double-Λ four-wave–mixing scheme can produce large NMOR optical SNR enhancements because of the intensity requirement for probe transparency (34–38). This requirement not only substantially reduces the NMOR effect but also significantly broadens the magnetic resonance.
As stated previously, the inelastic wave-mixing NMOR enhancement scheme significantly reduces the required probe intensity. The one-photon excitation rates for both probe and WM fields in our work are typically a factor of 500 to 1000 lower than that used in the state-of-the-art setups (6–8, 12–24). This virtue is very important in extremely weak magnetic field sensing applications because the effective ground-state Zeeman decoherence rate γ0 determines the sharpness of the magnetic resonance and therefore the detection sensitivity. For very small γ0, the optical saturation effect of the strong probe required in current state-of-art technologies, including EIT-based schemes, begins to detrimentally broaden the Zeeman magnetic sublevels.
We finally note that the experimental demonstration of the significant NMOR optical SNR enhancement reported here has already been observed and verified using a well-calibrated state-of-the-art spin exchange relaxation-free (SERF) potassium atomic magnetometer. This system has five layers of magnetic shielding and three pairs of compensation coils. It is routinely operated at 423 K (150°C), with a sensitivity of (39). When the transverse SERF pump laser is blocked, this magnetometer behaves just as the single-beam Λ scheme shown in Fig. 1A (except for high buffer gas pressure and relaxation considerations). To demonstrate the effect of the NMOR propagation blockade removal, we added a far-detuned WM laser. When this counter-propagating WM laser is turned on (as in Fig. 1B and the experiment reported here), a substantial NMOR optical SNR enhancement effect was observed. This crucial test unequivocally validates the NMOR optical SNR enhancement effect of the optical WM technique. In addition, the fundamental principles demonstrated here have already led to the observation of new magnetic field–sensitive effects in a full spin-polarized system for Kerr phase gate and polarization gate operation (40, 41).
The symmetry-breaking inelastic optical wave-mixing scheme demonstrated here exhibits superior NMOR optical SNR in extremely weak magnetic field sensing applications. The large NMOR SNR enhancement may lead to significant reduction in the size of current atomic magnetic probes. The principle may also be applicable to other polarimetry-based single-beam three-state atomic magnetometers where an energy symmetry–based NMOR propagation blockade occurs. This NMOR enhancement effect may lead to breakthroughs in real-time body temperature human organ biomagnetic field mapping, significant SNR enhancement in certain atomic clocks based on the principle of coherent population trapping, charge transportation across cell boundaries, and real-time detection of the magnetic fields generated by collective ion-exchange processes in crystals as new exotic molecular structures are forming. In addition, it may also facilitate the detection of extremely weak magnetic fields in space, nuclear magnetic resonances, and the magnetic properties of subatomic particles.
MATERIALS AND METHODS
Figure 7 is a schematic of the experimental setup. The medium is isotopically pure atomic 87Rb vapor sealed in a cylindrical glass cell filled with 933 Pa of Neon buffer gas and maintained at 311 K. The uncoated cell is 5 cm in length and 2 cm in diameter. Typical light beam full-width-at-half-maximum diameters of the probe and WM fields are 1.8 and 5 mm, respectively. Probe and WM laser powers are chosen from 0.5 to 20 μW. Our simple magnetic field shield has a shield limit of about 500 nT (~3 kHz; see Fig. 4A). It is cylindrical in shape and has two layers of μ-metal sheets that are 40 cm (30 cm) in length and 16 cm (10 cm) in diameter for the outer (inner) layers, respectively. A typical measurement without the WM field contains 16 scans, with each scan of 5 ms covering the magnetic field region of −500 to +500 nT. With the WM field present, we often took just a single scan because of the large SNR. We first selected the intensity of the probe field so that it produced a magnetic resonance signal of 2 mV. We then turned on the WM field to enhance the NMOR signal amplitude. Noise power spectral densities (see Fig. 5) were measured using a spectrum analyzer (range, 20 Hz to 40 MHz) with a resolution bandwidth of 3 Hz. No probe field–modulation or phase-locking detection method was used. We note that because of the much weaker field intensities and large detunings, frequency shifts and spin realignment processes (42–45) did not play an important role in our study. This has been verified through numerical calculations, experimental calibrations, and population-probing processes. Finally, we note that, experimentally, we observed the maximum NMOR enhancement effect when the angle between the polarizations of the probe and WM fields is 45° (46). This interesting NMOR cross-polarization angular effect has been predicted by our theoretical framework but is beyond the scope of the present study and will be published elsewhere.
Fig. 7. Experimental setup for the inelastic optical WM-enhanced NMOR.
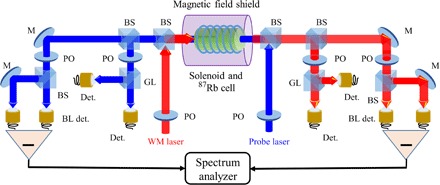
Symmetric experimental setup allows simultaneous measurements of both the probe and WM light polarization components. M, mirror; BS, 50-50 beam splitter; PO, polarization optics; GL, Glen prism; BL det., balanced detector.
For the numerical calculations, we adopted two approaches. In the first approach, we used the standard nonlinear optical theoretical framework (9) in which we simultaneously solved 16 density matrix equations of motion and 4 complex Maxwell equations for the probe and WM polarization components without any approximation (except the usual electric-dipole and rotating-wave approximations). Figures 2, 3, and 6C were obtained using this method. In the second approach, we began with the standard ellipsometry formulism (3), which involves recasting the complex probe field Maxwell equations into four real equations (for example, field amplitude, phase, absorption coefficient, and ellipsometry). The WM field was treated similarly. As expected, modeling our experimental configuration with these two approaches yielded identical results.
Acknowledgments
We thank M. Furst [National Institute of Standards and Technology (NIST)] for technical assistance. Funding: There was no funding received for this project. Author contributions: L.D. and E.W.H. developed the experimental concept and theoretical model. F.Z. carried out the experiment at NIST Gaithersburg under the supervision of L.D. C.J.Z. carried out numerical calculations under the supervision of L.D. L.D. and E.W.H. wrote the manuscript with input from all authors involved in this project. Competing interests: The authors declare that they have no competing interests. Data and materials availability: All data needed to evaluate the conclusions in the paper are present in the paper. Additional data related to this paper may be requested from the authors.
REFERENCES AND NOTES
- 1.Gawlik W.,Kowalski J., Neumann R., Träger F., Strong narrowing of the Na forward scattering signals due to the interaction with an intense dye laser field. Phys. Lett. A 48, 283–283 (1974). [Google Scholar]
- 2.A. K. Zvezdin, V. A. Kotov, Modern Magento-Optics and Magneto-Optical Materials (Taylor & Francis Group, 1997). [Google Scholar]
- 3.M. Auzinsh, D. Budker, S. Rochester, Optically Polarized Atoms: Understanding Light-Atom Interactions (Oxford Univ. Press, 2010). [Google Scholar]
- 4.Budker D., Romalis M., Optical magnetometry. Nat. Phys. 3, 227–234 (2007). [Google Scholar]
- 5.D. Budker, D. F. J. Kimball, Optical Magnetometry (Cambridge Univ. Press, 2013). [Google Scholar]
- 6.Sautenkov V. A., Lukin M. D., Bednar C. J., Novikova I., Mikhailov E., Fleischhauer M., Velichansky V. L., Welch G. R., Scully M. O., Enhancement of magneto-optic effects via large atomic coherence in optically dense media. Phys. Rev. A 62, 023810 (2000). [Google Scholar]
- 7.Scully M. O., Fleischhauer M., High-sensitivity magnetometer based on index-enhanced media. Phys. Rev. Lett. 69, 1360–1363 (1992). [DOI] [PubMed] [Google Scholar]
- 8.Siddons P., Adams C. S., Hughes I. G., Optical control of Faraday rotation in hot Rb vapor. Phys. Rev. A 81, 043838 (2010). [Google Scholar]
- 9.G. P. Agrawal, Nonlinear Fiber Optics (Academic Press, 2001), chap. 7. [Google Scholar]
- 10.Payne M. G., Deng L., Extremely slow propagation of a light pulse in an ultracold atomic vapor: A Raman scheme without electromagnetically induced transparency. Phys. Rev. A 64, 031802 (2001). [Google Scholar]
- 11.Happer W., Tam A. C., Effect of rapid spin exchange on the magnetic-resonance spectrum of alkali vapors. Phys. Rev. A 16, 1877–1891 (1977). [Google Scholar]
- 12.Erickson C. J., Levron D., Happer W., Kadlecek S., Chann B., Anderson L. W., Walker T. G., Spin relaxation resonances due to the spin-axis interaction in dense rubidium and cesium vapor. Phys. Rev. Lett. 85, 4237–4240 (2000). [DOI] [PubMed] [Google Scholar]
- 13.Kadlecek S., Anderson L. W., Walker T. G., Field dependence of spin relaxation in a dense Rb vapor. Phys. Rev. Lett. 80, 5512–5515 (1998). [Google Scholar]
- 14.Allred J. C., Lyman R. N., Kornack T. W., Romalis M. V., High-sensitivity atomic magnetometer unaffected by spin-exchange relaxation. Phys. Rev. Lett. 89, 130801 (2002). [DOI] [PubMed] [Google Scholar]
- 15.Kominis I. K., Kornack T. W., Allred J. C., Romalis M. V., A subfemtotesla multichannel atomic magnetometer. Nature 422, 596–599 (2003). [DOI] [PubMed] [Google Scholar]
- 16.Savukov I. M., Romalis M. V., Effects of spin-exchange collisions in a high-density alkali-metal vapor in low magnetic fields. Phys. Rev. A 71, 023405 (2005). [Google Scholar]
- 17.Budker D., Yashchuk V., Zolotorev M., Nonlinear magneto-optic effects with ultranarrow widths. Phys. Rev. Lett. 81, 5788–5791 (1998). [Google Scholar]
- 18.Budker D., Kimball D. F., Rochester S. M., Yashchuk V. V., Nonlinear magneto-optics and reduced group velocity of light in atomic vapor with slow ground state relaxation. Phys. Rev. Lett. 83, 1767–1770 (1999). [Google Scholar]
- 19.Aleksandrov E. B., Balabas M. V., Vershovskii A. K., Ivanov A. E., Yakobson N. N., Velichanskii V. L., Senkov N. V., Laser pumping in the scheme of an Mx-magnetometer. Opt. Spectrosc. 78, 292–298 (1995). [Google Scholar]
- 20.Budker D., Kimball D. F., Rochester S. M., Yashchuk V. V., Zolotorev M., Sensitive magnetometry based on nonlinear magneto-optical rotation. Phys. Rev. A 62, 043403 (2000). [DOI] [PubMed] [Google Scholar]
- 21.Balabas M. V., Karaulanov T., Ledbetter M. P., Budker D., Polarized alkali-metal vapor with minute-long transverse spin-relaxation time. Phys. Rev. Lett. 105, 070801 (2010). [DOI] [PubMed] [Google Scholar]
- 22.Jiménez-Martínez R., Knappe S., Kitching J., An optically modulated zero-field atomic magnetometer with suppressed spin-exchange broadening. Rev. Sci. Instrum. 85, 045124 (2014). [DOI] [PubMed] [Google Scholar]
- 23.Patton B., Zhivun E., Hovde D. C., Budker D., All-optical vector atomic magnetometer. Phys. Rev. Lett. 113, 013001 (2014). [DOI] [PubMed] [Google Scholar]
- 24.Korver A., Wyllie R., Lancor B., Walker T. G., Suppression of spin-exchange relaxation using pulsed parametric resonance. Phys. Rev. Lett. 111, 043002 (2013). [DOI] [PMC free article] [PubMed] [Google Scholar]
- 25.Jiang K. J., Deng L., Payne M. G., Observation of quantum destructive interference in inelastic two-wave mixing. Phys. Rev. Lett. 98, 083604 (2007). [DOI] [PubMed] [Google Scholar]
- 26.Deng L., Payne M. G., Garrett W. R., Inelastic wave mixing and multi-photon destructive interference based induced transparency in coherently prepared media. Opt. Commun. 242, 641–647 (2004). [Google Scholar]
- 27.Deng L., Payne M. G., Garrett W. R., Effect of multi-photon interference from internally generated fields in strongly resonant systems. Phys. Rep. 429, 123–241 (2006). [Google Scholar]
- 28.Ward J. F., Smith A. V., Saturation of two-photon-resonant optical processes in cesium vapor. Phys. Rev. Lett. 35, 653–656 (1975). [Google Scholar]
- 29.Alexandrov E. B., Balabas M. V., Pasgalev A. S., Vershovskii A. K., Yakobson N. N., Double-resonance atomic magnetometers: From gas discharge to laser pumping. Laser Phys. 6, 244–251 (1996). [Google Scholar]
- 30.Jian-Fang S., Shi-Qi Y., Zhen X., Tao H., Yu-Zhu W., Optimization of polarization spectroscopy for rubidium D lines. Chin. Phys. B 22, 024207 (2013). [Google Scholar]
- 31.Acosta V., Ledbetter M. P., Rochester S. M., Budker D., Jackson Kimball D. F., Hovde D. C., Gawlik W., Pustelny S., Zachorowski J., Yashchuk V. V., Nonlinear magneto-optical rotation with frequency-modulated light in the geophysical field range. Phys. Rev. A 73, 053404 (2006). [Google Scholar]
- 32.Budker D., Kimball D. F., Yashchuk V. V., Zolotorev M., Nonlinear magneto-optical rotation with frequency-modulated light. Phys. Rev. A 65, 055403 (2002). [Google Scholar]
- 33.W. Gawlik, S. Pustelny, Nonlinear magneto-optical rotation magnetometers, in High Sensitivity Magnetometers, A. Grosz, M. J. Haji-sheikh, S. C. Mukhopadhyay, Eds. (Springer International Publishing, 2017). [Google Scholar]
- 34.Yudin V. I., Taichenachev A. V., Dudin Y. O., Velichansky V. L., Zibrov A. S., Zibrov S. A., Vector magnetometry based on electromagnetically induced transparency in linearly polarized light. Phys. Rev. A 82, 033807 (2010). [Google Scholar]
- 35.Wang B., Li S., Ma J., Wang H., Peng K. C., Xiao M., Controlling the polarization rotation of an optical field via asymmetry in electromagnetically induced transparency. Phys. Rev. A 73, 051801 (2006). [Google Scholar]
- 36.Tiwari V. B., Singh S., Mishra S. R., Rawat H. S., Mehendale S. C., Laser frequency stabilization using Doppler-free bi-polarization spectroscopy. Opt. Commun. 263, 249–255 (2006). [Google Scholar]
- 37.Wasik G., Gawlik W., Zachorowski J., Zawadzki W., Laser frequency stabilization by Doppler-free magnetic dichroism. Appl. Phys. B 75, 613–619 (2002). [Google Scholar]
- 38.Harris M. L., Cornish S. L., Tripathi A., Hughes I. G., Optimization of sub-Doppler DAVLL on the rubidium D2 line. J. Phys. B 41, 085401 (2008). [Google Scholar]
- 39.Fu J.-Q., Du P.-C., Zhou Q., Wang R.-Q., Spin dynamics of the potassium magnetometer in spin-exchange relaxation free regime. Chin. Phys. B 25, 010302 (2016). [Google Scholar]
- 40.Li R. B., Deng L., Hagley E. W., Fast, all-optical, zero to π continuously controllable Kerr phase gate. Phys. Rev. Lett. 110, 113902 (2010). [DOI] [PubMed] [Google Scholar]
- 41.Li R., Zhu C., Deng L., Hagley E. W., Fast, high-fidelity, all-optical and dynamically-controlled polarization gate using room-temperature atomic vapor. Appl. Phys. Lett. 105, 161103 (2014). [Google Scholar]
- 42.Budker D., Gawlik W., Kimball D. F., Rochester S. M., Yashchuk V. V., Weis A., Resonant nonlinear magneto-optical effects in atoms. Rev. Mod. Phys. 74, 1153–1201 (2002). [Google Scholar]
- 43.Mathur B. S., Tang H., Happer W., Light shifts in the alkali atoms. Phys. Rev. 171, 11–19 (1968). [Google Scholar]
- 44.Jensen K., Acosta V. M., Higbie J. M., Ledbetter M. P., Rochester S. M., Budker D., Cancellation of nonlinear Zeeman shifts with light shifts. Phys. Rev. A 79, 023406 (2009). [Google Scholar]
- 45.Yashchuk V. V., Budker D., Gawlik W., Kimball D. F., Malakyan Y. P., Rochester S. M., Selective addressing of high-rank atomic polarization moments. Phys. Rev. Lett. 90, 253001 (2003). [DOI] [PubMed] [Google Scholar]
- 46.Zhou F., Zhu C., Hagley E. W., Deng L., Symmetry-breaking Zeeman-coherence parametric wave mixing magnetometry. arXiv:1609.00431 (2016). [Google Scholar]