Abstract
The folate-driven one-carbon (1C) cycle is a fundamental metabolic hub in cells that enables the synthesis of nucleotides and amino acids and epigenetic modifications. This cycle might also release formaldehyde, a potent protein and DNA crosslinking agent that organisms produce in substantial quantities. Here we show that supplementation with tetrahydrofolate, the essential cofactor of this cycle, and other oxidation-prone folate derivatives kills human, mouse and chicken cells that cannot detoxify formaldehyde or that lack DNA crosslink repair. Notably, formaldehyde is generated from oxidative decomposition of the folate backbone. Furthermore, we find that formaldehyde detoxification in human cells generates formate, and thereby promotes nucleotide synthesis. This supply of 1C units is sufficient to sustain the growth of cells that are unable to use serine, which is the predominant source of 1C units. These findings identify an unexpected source of formaldehyde and, more generally, indicate that the detoxification of this ubiquitous endogenous genotoxin creates a benign 1C unit that can sustain essential metabolism.
Cell growth requires the synthesis of essential biomolecules, such as nucleotides and amino acids. The 1C unit supplied by the 1C cycle is one of the basic building blocks to make such molecules. This unit mainly comes from enzymatic cleavage of serine into formaldehyde, which then reacts with tetrahydrofolate (THF)—the active form of folate (vitamin B9)1. Diverse chemical transitions process this single carbon unit into various forms, such as formate, which are used eventually in biosynthetic reactions. 1C metabolism is important for human health since folic acid deficiency causes birth defects, nerve damage and anaemia. Deleting key enzymes in the 1C cycle causes embryonic lethality in mice. Furthermore, many cancers overexpress enzymes involved in the 1C cycle, ultimately increasing the flux of 1C units2. However, 1C metabolism might also produce formaldehyde, an endogenous protein and DNA crosslinking agent generated by various processes, such as enzymatic demethylation of histones and nucleic acids3. Recently, we showed that a two-tier protection mechanism shields mice against endogenous formaldehyde4. This mechanism consists of the enzyme alcohol dehydrogenase 5 (ADH5), which removes formaldehyde (tier one), and DNA crosslink repair by the Fanconi anaemia pathway, which reverses DNA damage caused by formaldehyde (tier two). Inactivation of this protection mechanism in mice causes death because endogenous DNA damage leads to multiple organ failure. Here we identify an unexpected route by which the 1C cycle produces formaldehyde. Furthermore, we show that detoxification of endogenous formaldehyde generates a 1C unit that is able to sustain essential metabolism.
Tetrahydrofolate is intrinsically genotoxic
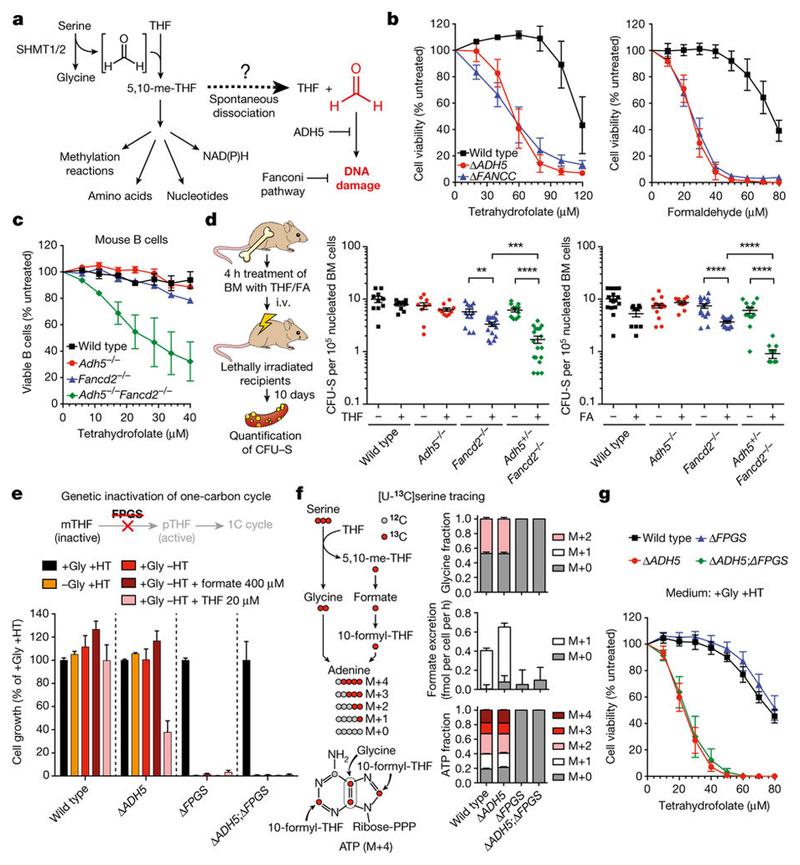
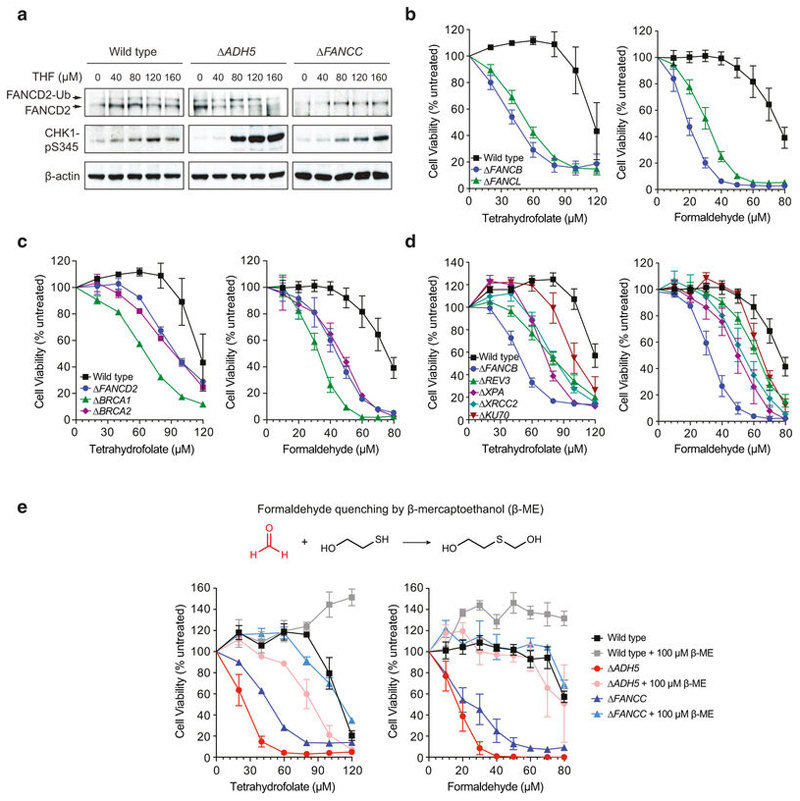
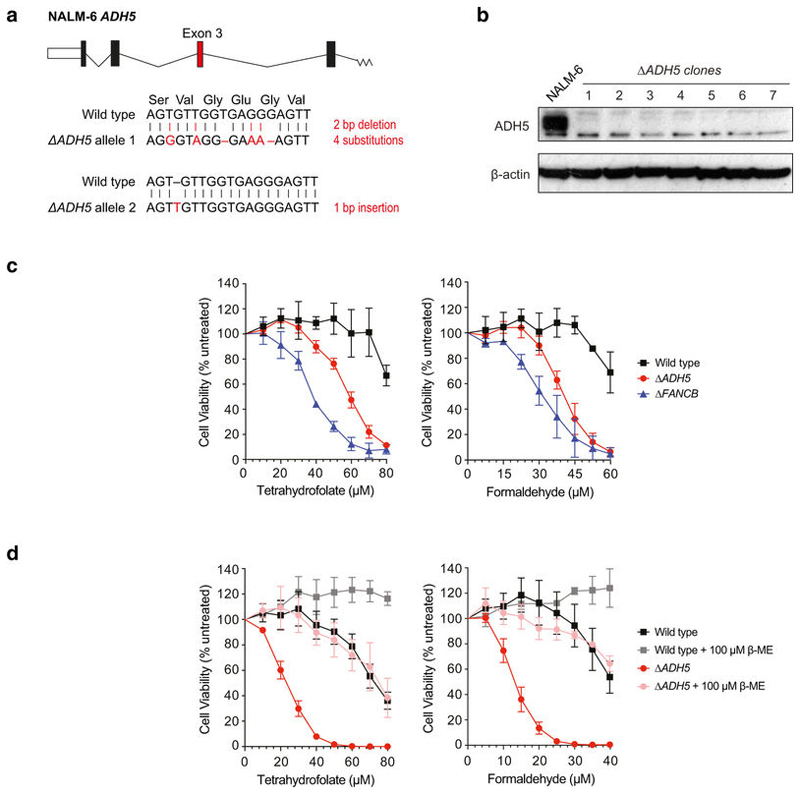
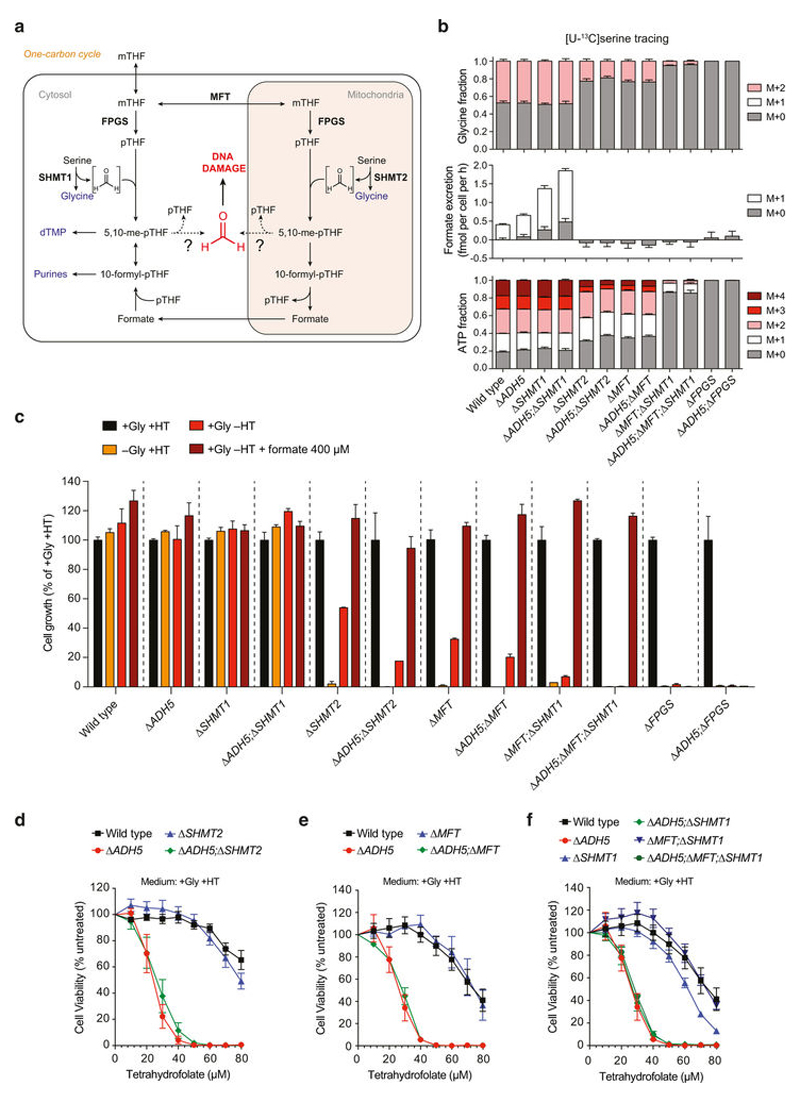
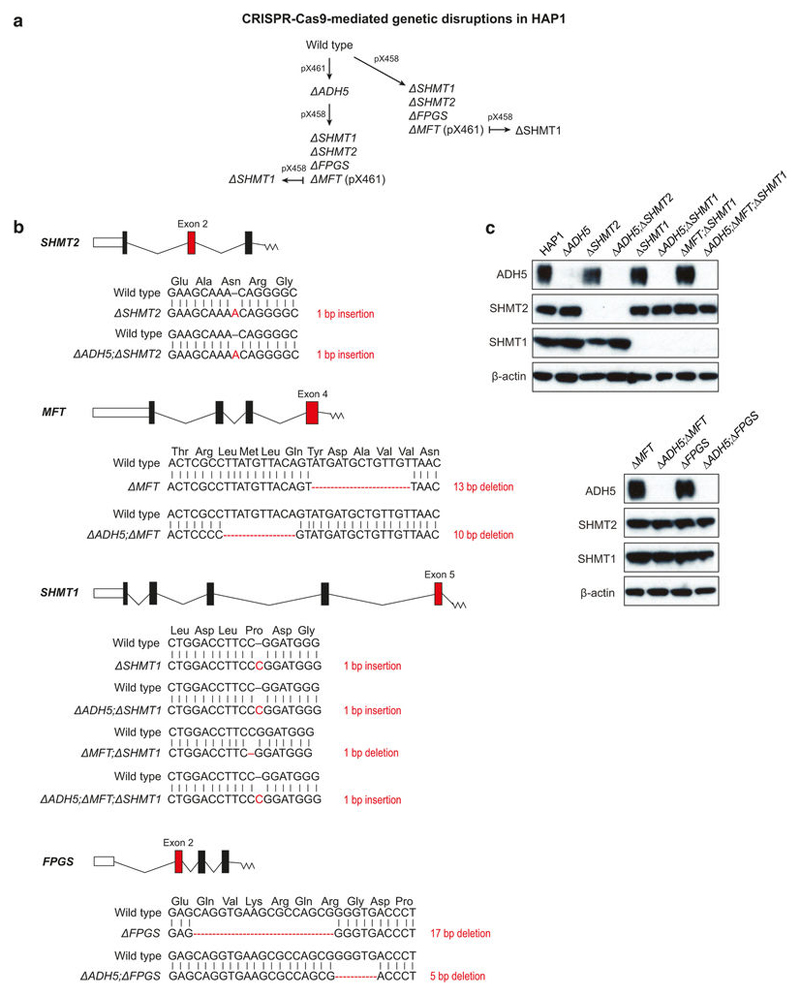
Blood formaldehyde concentrations in humans range between 20 and 100 μ M5–7. These relatively high levels suggest that formaldehyde is produced from a widespread source, such as 1C metabolism. More specifically, the 1C unit is mostly derived from the cleavage of serine by the enzymes serine hydroxymethyltransferase 1 and 2 (SHMT1 and SHMT2), which generates glycine and transiently liberates formaldehyde1. However, this formaldehyde quickly reacts with THF to create 5,10-methylene-THF (5,10-me-THF), which is prone to dissociation in vitro to release formaldehyde8 (Fig. 1a). THF and 5,10-me-THF are ubiquitous metabolites and can reach concentrations of up to 20 μ M in certain tissues9,10. Therefore, if 5,10-me-THF dissociated to some extent in vivo, it could generate a substantial amount of formaldehyde. To test this, we assessed the possible genotoxicity of THF supplementation, which should promote the production of 5,10-me-THF11. THF exposure induced a DNA damage response in wild-type, Δ ADH5 (tier one deficient) and Δ FANCC (tier two deficient) chicken DT40 cells. This was demonstrated by the induction of FANCD2 monoubiquitination and CHK1 phosphorylation, known DNA damage response markers (Extended Data Fig. 1a). Additionally, THF exposure was cytotoxic, especially in Δ ADH5, Δ FANCC and other Fanconi anaemia core-complex-deficient cells (Fig. 1b and Extended Data Fig. 1b). Other tier two protection-defective mutants were also sensitive to THF, including those deficient in the tumour-suppressor genes BRCA1 and BRCA2 (Extended Data Fig. 1c, d). Consistently, the human B cell line NALM-6 carrying genetic disruptions of FANCB (tier two deficient) or ADH5 showed similar sensitivity to THF (Extended Data Fig. 2a–c). In primary mouse cells, combined deficiency of tier one (Adh5–/–) and tier two (Fancd2–/–) renders cells susceptible to formaldehyde damage. Adh5–/–Fancd2–/– mice accumulate endogenous DNA damage that leads to liver, kidney and bone marrow failure4. Moreover, in DT40 cells, inactivation of two-tier protection is lethal12. We therefore tested if this protection mechanism also protected primary bone marrow-derived cells against THF. Indeed, LPS-activated splenic B cells obtained from Adh5–/–Fancd2–/– mice were hypersensitive to THF (Fig. 1c). Moreover, THF was particularly cytotoxic to haematopoietic stem and progenitor cells (colony-forming unit–spleen (CFU–S)) from Adh5+/–Fancd2–/– mice (Fig. 1d). Finally, THF toxicity was suppressed by addition of β-mercaptoethanol (β -ME), which quenches formaldehyde yielding inert 2-(hydroxymethyl)thio)ethanol12 (Extended Data Fig. 1e). Increasing THF availability could increase the production of 5,10-me-THF, which then might release formaldehyde. To test this, we used the human haploid cell line HAP1. Consistently, HAP1 Δ ADH5 cells were hypersensitive to THF and this was suppressed by β -ME (Extended Data Fig. 2d). We then used CRISPR–Cas9 to generate a panel of 1C-cycle-defective knockouts in both wild-type and Δ ADH5 strains (Extended Data Figs 3a and 4a). Such manipulations should limit or abolish the ability of THF to promote the generation of formaldehyde by the route described in Fig. 1a. Although the 1C cycle is essential for cell growth and viability, supplementation with glycine and the nucleotide precursors hypoxanthine and thymidine (HT) can bypass this dependence13–16. Knockout cell lines were verified by sequencing, and protein expression when possible (Extended Data Fig. 4b, c). For functional validation, each strain was tested for growth in various drop-out media lacking some or most supplements. In addition, these strains were metabolically verified by incubation with [U-13C]serine and tracing of the labelled carbon into glycine, ATP and excreted formate17 (Extended Data Fig. 3b, c). First, we disrupted the mitochondrial folate pathway by deleting SHMT2 or the mitochondrial folate transporter (MFT, also known as SLC25A32) (Extended Data Fig. 3a–c). As expected, both mutants had a significant defect in the synthesis of glycine, formate and nucleotides14,15. Inactivation of these genes in Δ ADH5 cells did not suppress THF toxicity (Extended Data Fig. 3d, e). Next, we inactivated SHMT1, which generates 5,10-me-THF in the cytosol (Extended Data Fig. 3a–c). Δ SHMT1 cells proficiently synthesized glycine, formate and nucleotides, indicating that in HAP1 the role of SHMT1 in the 1C cycle is insignificant when the mitochondrial folate pathway is functional. However, deleting SHMT1 in Δ MFT cells led to a more severe defect in the 1C cycle (Extended Data Fig. 3b, c). Surprisingly, this double disruption did not suppress THF toxicity in ADH5-deficient cells (Extended Data Fig. 3f). Finally, we decided to further inhibit the 1C cycle by inactivating the enzyme folylpolyglutamate synthase (FPGS), which polyglutamates THF and thereby activates it. Without FPGS, THF is inactive and hence the entire 1C cycle is substantially impeded16 (Fig. 1e). Consequently, Δ FPGS cells were not able to grow in the absence of glycine or HT, even when supplemented with formate or THF. Moreover, Δ FPGS cells were unable to generate glycine, ATP and formate from [U-13C]serine (Fig. 1e, f). However, this disruption did not suppress the sensitivity of Δ ADH5 cells to THF, indicating that THF toxicity is not only independent of the formation of 5,10-me-THF, but also of the entire flux through the 1C cycle (Fig. 1g). This suggests that THF genotoxicity is intrinsic to THF since it can be dissociated from its role in the 1C cycle.
Figure 1. Tetrahydrofolate is genotoxic by a 1C-cycle-independent mechanism.
a, Possible formaldehyde release from the 1C cycle. b, Cytotoxicity of THF and formaldehyde in DT40 strains (three triplicate experiments). c, Sensitivity to THF of LPSactivated B cells (three mice per genotype, each tested in duplicate). d, Left, experimental setup based on the CFU–S assay. Right, quantification of haematopoietic stem and progenitor cells (CFU–S) from bone marrow (BM) cells exposed to 240 μ M THF or 120 μ M formaldehyde (FA). Each dot represents CFU–S from a transplanted mouse (n ≥ 9 per genotype). e, Cell growth of HAP1 strains in media with (+ ) or without (–) glycine (Gly), hypoxanthine and thymidine (HT), formate and THF. Data represent two experiments (six replicates). f, Left, labelling of glycine, formate and ATP from [U-13C]serine. Right, mass isotopomer distribution of glycine, excreted formate and ATP in HAP1 cells cultured (with Gly and without HT) with [U-13C]serine for 16 h. g, Cytotoxicity of THF in HAP1 strains. Data in f and g are from two triplicate experiments. All data represent mean ± s.e.m. Statistical significance was assessed using two-tailed Student’s t-tests. * * P ≤ 0.01; * * * P ≤ 0.001; * * * * P ≤ 0.0001.
THF decomposition releases formaldehyde
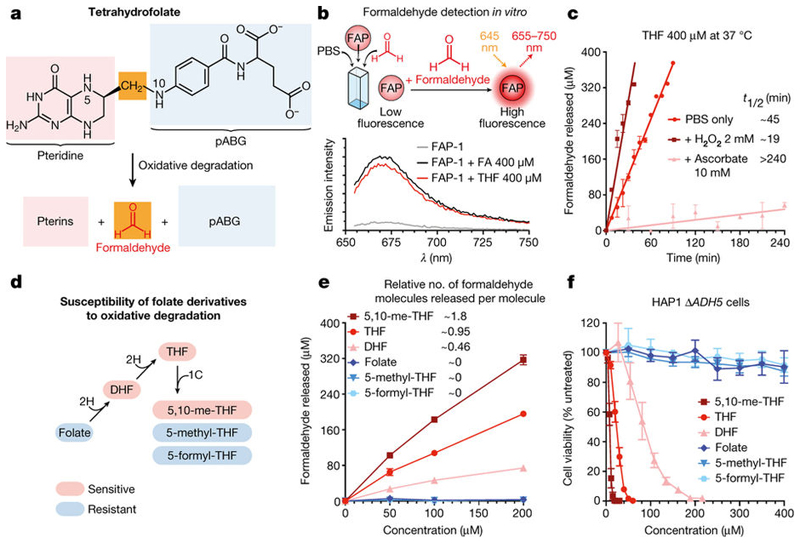
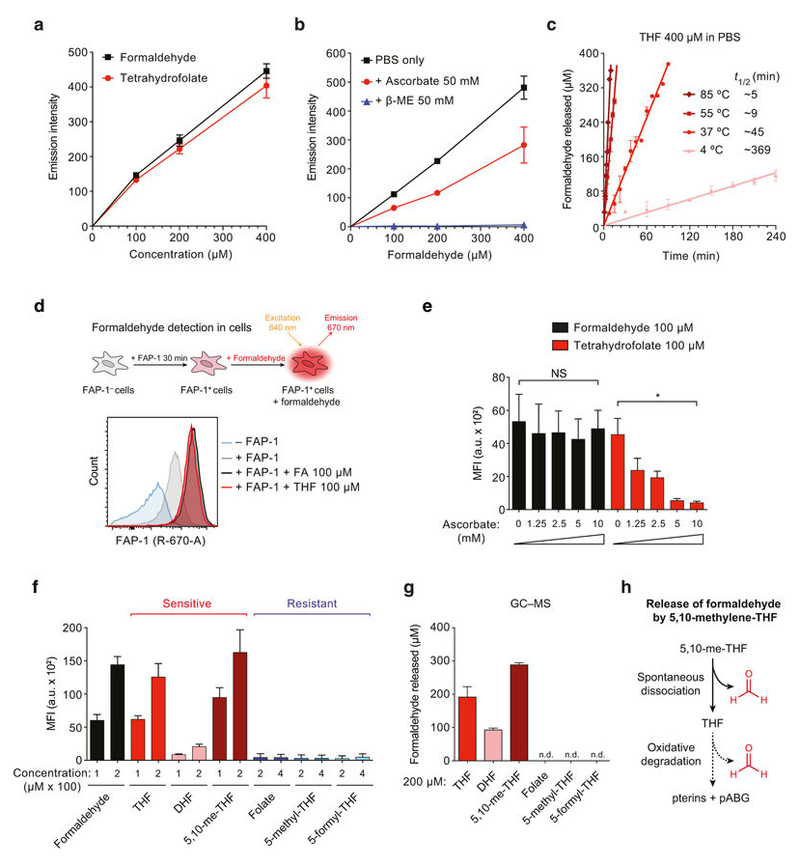
THF is susceptible to oxidative degradation, which releases its constituents: a pterine moiety and p-minobenzoylglutamate (pABG). Importantly, a methylene bridge connects these two components, which may be converted to formaldehyde during this process18 (Fig. 2a). To test this hypothesis, we used a highly specific, cell-permeable fluorescent formaldehyde probe (FAP-1)19. Both formaldehyde and THF activated this probe in vitro in a concentration-dependent manner (Fig. 2b and Extended Data Fig. 5a). Notably, THF releases half of the total formaldehyde in only around 45 min (Fig. 2c). Ascorbate (vitamin C) is a potent antioxidant and, unlike β -ME, does not quench formaldehyde substantially (Extended Data Fig. 5b).
Figure 2. Oxidative decomposition of THF and other folate derivatives releases formaldehyde.
a, Possible formaldehyde release by THF decomposition. pABG, p-aminobenzoylglutamate. b, Top, formaldehyde detection by the FAP-1 probe. Bottom, emission spectra of FAP-1 incubated with formaldehyde or THF. c, Formaldehyde release by THF in different oxidative conditions determined with FAP-1. t1/2, estimated time required to release 50% of the total formaldehyde. d, Oxidation susceptibility of folate derivatives. e, Formaldehyde release by folate derivatives after 24 h incubation in PBS at 37 °C, measured using FAP-1. Data in c and e are from two duplicate experiments. f, Cytotoxicity of folate derivatives to HAP1 ΔADH5 cells. Data are from three triplicate experiments. All data represent mean ± s.e.m.
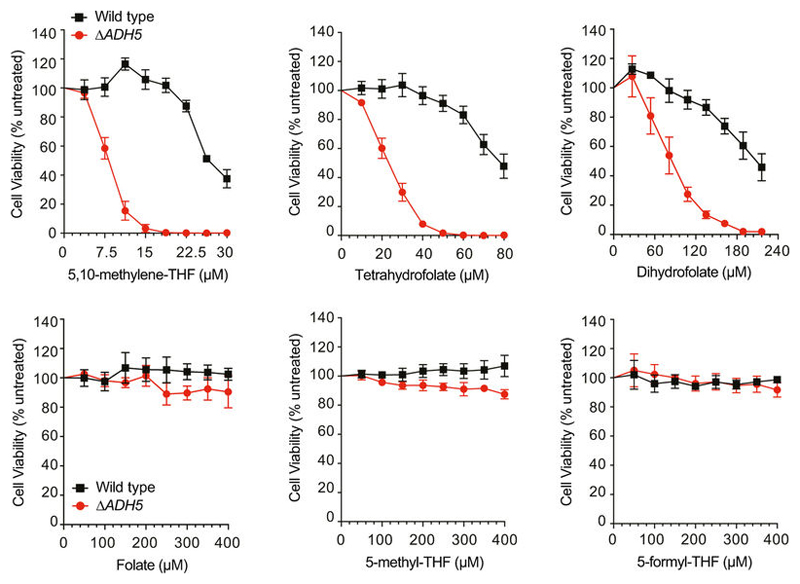
However, ascorbate inhibited the release of formaldehyde from THF. Conversely, the oxidant hydrogen peroxide (H2O2) accelerated this process (Fig. 2c). In agreement with the temperature-dependent stability of THF20, formaldehyde generation from THF was supressed at 4 °C and enhanced at 55 °C and 85 °C (Extended Data Fig. 5c). Moreover, THF also decomposed into formaldehyde in THF-exposed cells, and this was also suppressed by ascorbate (Extended Data Fig. 5d, e). These data indicate that oxidative THF decomposition releases formaldehyde under physiological conditions. As THF moves through the 1C cycle, it undergoes numerous chemical transitions generating other folate derivatives. Their oxidation propensity has been characterized in vitro: DHF, THF and 5,10-me-THF are oxidation-prone, whereas folate, 5-methyl-THF and 5-formyl-THF are resistant18,20 (Fig. 2d). Indeed, we found that only oxidation-prone derivatives release formaldehyde, both in vitro and in a cellular context. These results were corroborated by gas chromatography– mass spectrometry (Fig. 2e and Extended Data Fig. 5f–h). Consistently, the cytotoxic potency of folate derivatives mirrored their susceptibility to decomposition (Fig. 2f and Extended Data Fig. 6). Cumulatively, these results indicate that decomposition of THF and other folate derivatives releases genotoxic formaldehyde.
ADH5 fuels the growth of 1C-cycle-deficient cells
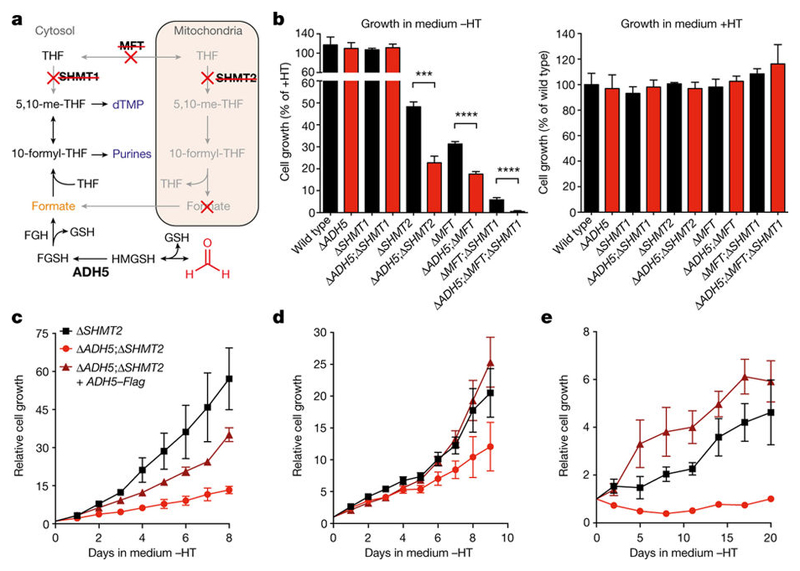
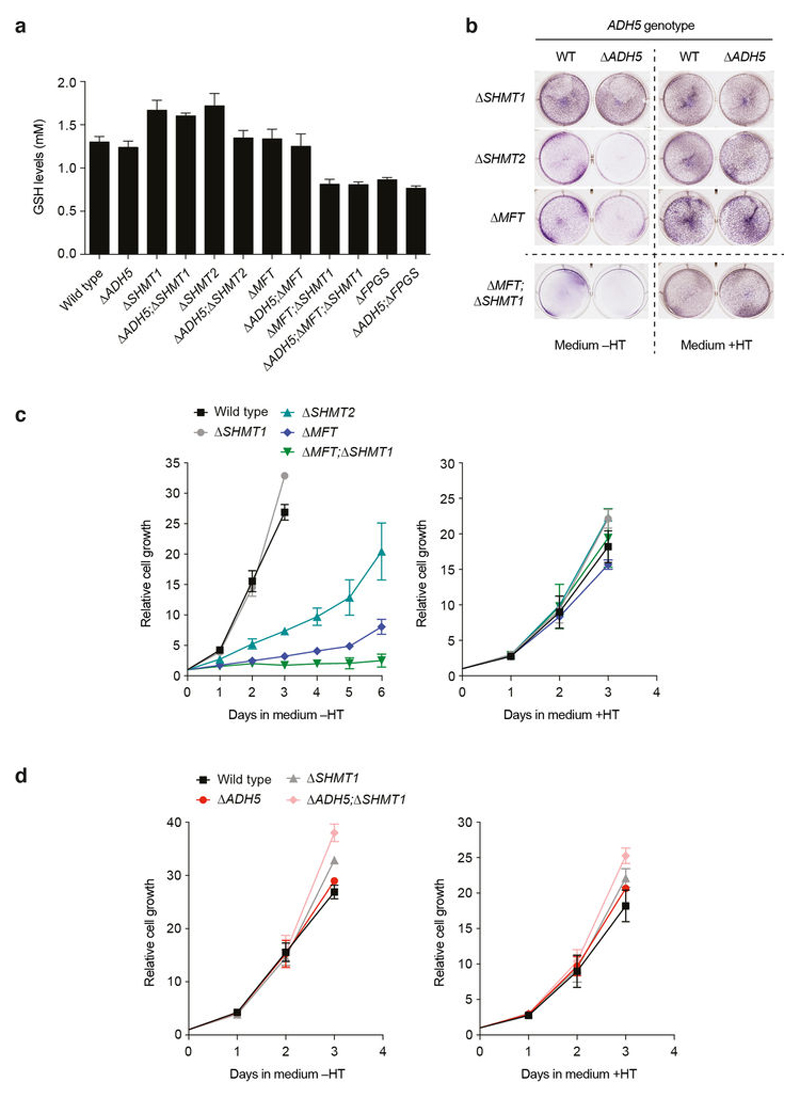
ADH5 detoxifies formaldehyde, hence protecting the cell against this genotoxin. Formaldehyde reacts spontaneously with glutathione (GSH) to yield S-hydroxymethylglutathione (HMGSH) (Fig. 3a); this reaction is predicted to occur efficiently given the high intracellular GSH concentrations (Extended Data Fig. 7a). Subsequently, ADH5 with NAD(P)+ oxidizes HMGSH to create S-formylglutathione (FGSH). The action of S-formylglutathione hydrolase (FGH) regenerates GSH to yield formate21,22 (Fig. 3a). This biochemical route could therefore provide a cell with utilizable 1C units coupled to formaldehyde detoxification. Indeed, we noticed that deleting ADH5 exacerbated the growth defect of 1C-cycle-deficient strains in media lacking nucleotide precursors (without HT; Fig. 3b and Extended Data Fig. 7b): Δ SHMT2 compared to Δ ADH5;Δ SHMT2 (48% versus 23% cell growth relative to same lines grown with HT); Δ MFT compared to Δ ADH5;Δ MFT (31% versus 17%); and finally Δ MFT;Δ SHMT1 compared to Δ ADH5; Δ MFT;Δ SHMT1 (6% versus 0.5%).
Figure 3. ADH5 sustains the growth of 1C-cycle-defective HAP1 cells.
a, 1C cycle and formate generation by formaldehyde detoxification. Genetic disruptions of 1C unit production from serine are shown with a red cross. dTMP, deoxythymidine monophosphate. b, Growth of HAP1 strains (with Gly) with or without HT. Data are from two experiments (six replicates). Three independent clones were used for all the 1C-cycle-deficient strains. c–e, Growth curves of HAP1 1C-cycle-defective strains grown without HT (with Gly). Data are from≥2 independent experiments (six replicates). At least two independent clones were used for all the ADH5-complemented strains. All data represent mean ± s.e.m. Statistical significance was assessed using two-tailed Student’s t-tests. ***P ≤ 0.001; **** P ≤ 0.0001.
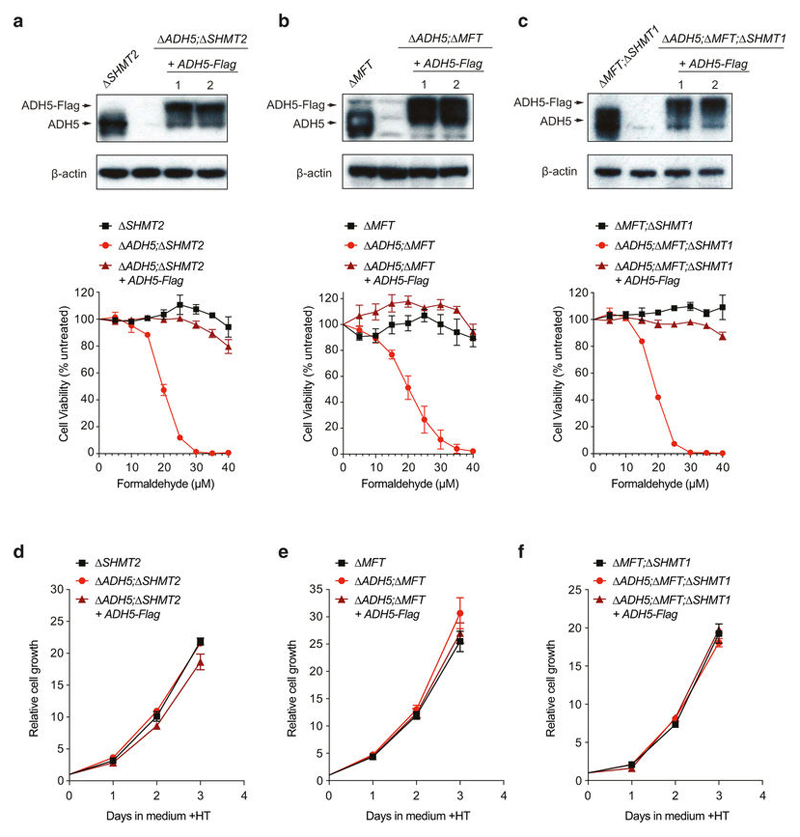
These differences were completely suppressed by HT supplementation. To establish further that ADH5 supports the residual growth of 1C-cycle-deficient strains, we examined their growth rates in more detail. Consistently, all 1C-cycle-deficient cell lines were significantly more growth-defective if they also lacked ADH5, with Δ ADH5;Δ MFT;Δ SHMT1 cells showing the most severe defect (Fig. 3c–e and Extended Data Figs 7c, d and 8d–f). Here, the residual growth of Δ MFT;Δ SHMT1 cells was completely abolished upon ADH5 deletion. Furthermore, restoring ADH5 expression reversed these growth defects (Fig. 3c–e and Extended Data Fig. 8a–f). These experiments reveal an important physiological role for ADH5 to support growth of HAP1 cells defective in 1C metabolism.
Formaldehyde is a meaningful source of 1C units
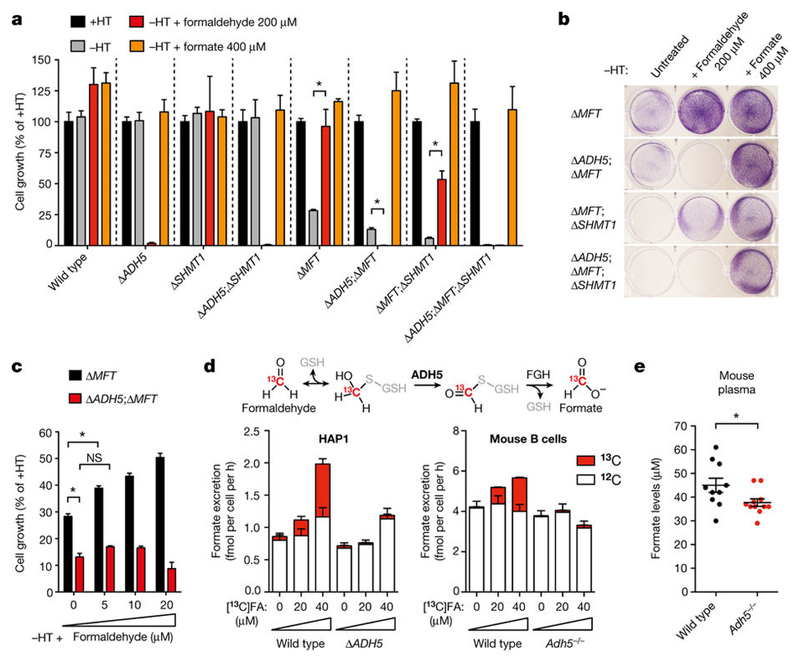
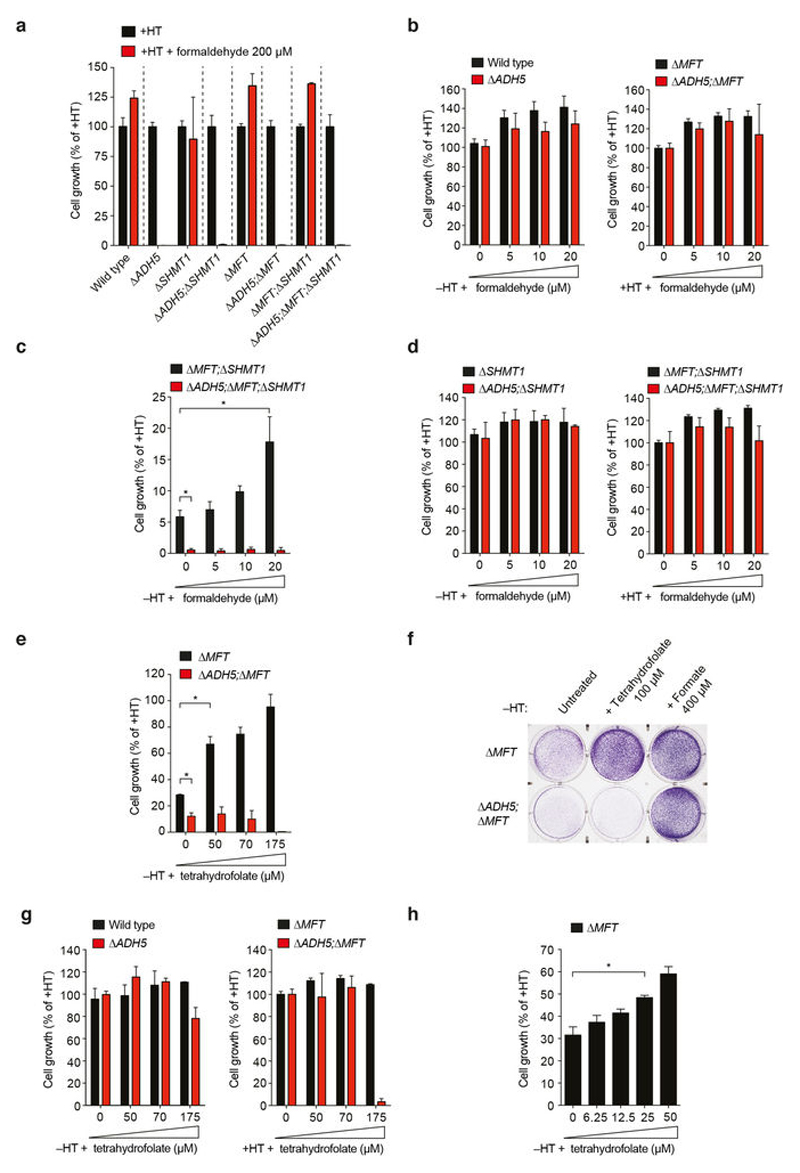
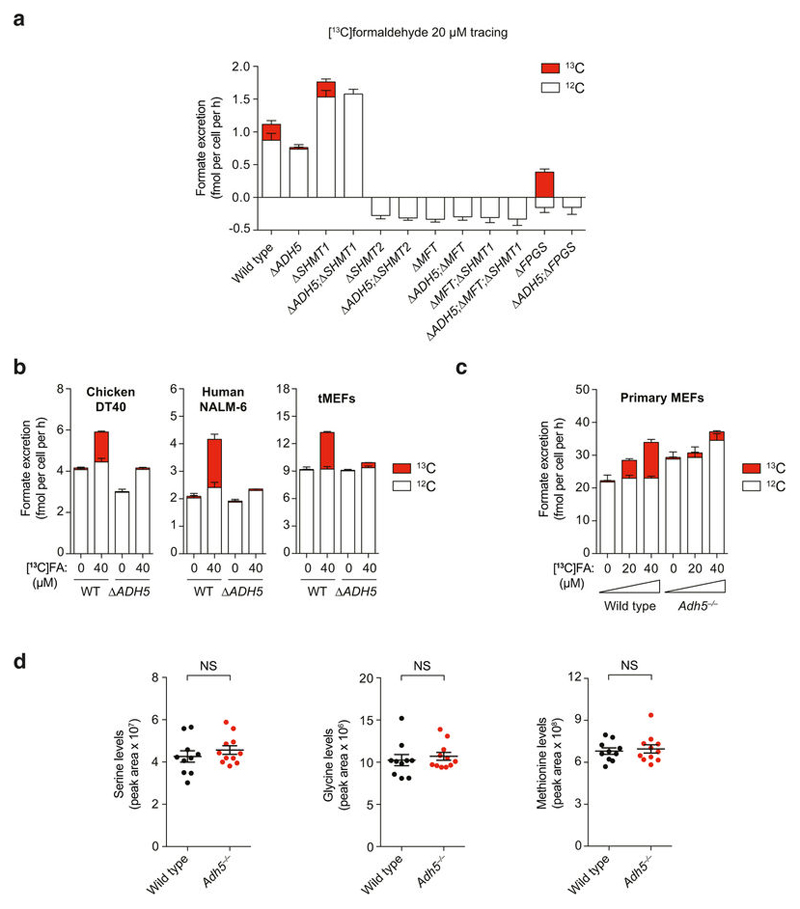
The most likely reason for ADH5 enabling the growth of 1C-cycledeficient mutants is the conversion of endogenous formaldehyde into formate. These mutant cells should then be auxotrophic for formaldehyde in medium without HT. Notably, addition of 200 μ M formaldehyde to medium without HT restored the normal growth of Δ MFT cells and significantly rescued the growth defect of Δ MFT; Δ SHMT1 cells (Fig. 4a, b). This formaldehyde auxotrophy was completely dependent on ADH5, since 200 μ M formaldehyde was genotoxic to ADH5-deficient strains (Fig. 4a, b and Extended Data Fig. 9a). To test whether this formaldehyde auxotrophy is truly due to the ability of ADH5 to process formaldehyde into a useable 1C unit, we incubated cells with formaldehyde concentrations that were not cytotoxic to ADH5-deficient strains (Fig. 4c and Extended Data Fig. 9b–d). Indeed, exposure to a range of physiological doses up to 20 μ M formaldehyde promoted the growth of 1C-cycle-defective cells in an ADH5-dependent manner. Next, we tested if THF-derived formaldehyde could re-enter the 1C cycle and promote growth of Δ MFT cells. As predicted, THF supplementation rescued the growth defect of Δ MFT cells, but not of Δ ADH5;Δ MFT cells (Extended Data Fig. 9e–h). A key question is whether ADH5 provides a physiologically meaningful route to supply 1C units. Support that it does comes from our observation that, in the absence of formaldehyde supplementation, ADH5 supports growth of HAP1 cells deficient in serine catabolism. Another approach is to define how effectively 1C-cycle-proficient cells use this ADH5 route to supply 1C units when exposed to physiological concentrations of formaldehyde. To do this, we traced 13C-labelled formaldehyde into excreted formate (Fig. 4d). The net contribution of formate derived from a given concentration of exogenous formaldehyde can then be compared to that originating from the cellular utilization of natural serine. We compared wild-type with Δ ADH5 strains from several cell lines (HAP1, DT40, NALM-6 and transformed mouse embryonic fibroblasts (tMEFs)) exposed to 20 or 40 μ M [13C]formaldehyde (Fig. 4d and Extended Data Fig. 10a, b). [13C]formaldehyde clearly contributed to the overall formate production (up to around 40% in HAP1 cells), which was completely dependent on ADH5. We also performed the same experiment using primary cells from wild-type and Adh5–/– mice. In both LPS-activated splenic B cells and primary MEFs, the supply of formate from [13C]formaldehyde was substantial and ADH5-dependent (Fig. 4d and Extended Data Fig. 10c). Finally, we assessed whether the ADH5-dependent production of formate contributes to the blood formate concentration. Indeed, mean plasma formate levels in Adh5–/– mice are reduced by approximately 20% compared to wild-type mice (Fig. 4e). By contrast, we did not find significant differences in the levels of other 1C-cycle metabolites such as serine, a major source of plasma formate17 (Extended Data Fig. 10d). Altogether, these experiments provide strong evidence that ADH5-dependent formaldehyde detoxification can meaningfully contribute to the supply of 1C units in vitro and in vivo.
Figure 4. Formaldehyde detoxification by ADH5 supplies 1C units and promotes cell growth.
a, Growth of HAP1 strains in media (with Gly) with or without HT, formate and formaldehyde. b, Crystal-violet-stained plates of HAP1 cells grown in medium without HT untreated or treated with formaldehyde or formate. c, Growth of HAP1 mutants in medium without HT containing low doses of formaldehyde. In panels a–c, formaldehyde was added in increasing amounts each day. Each indicated dose represents the total cumulative dose of formaldehyde. Data are from two triplicate experiments. d, Top, [13C]formaldehyde tracing to formate. Bottom, tracing of physiological doses of [13C]formaldehyde to excreted formate in HAP1 (left) and LPS-blasted B cells (right) cultured in medium without HT for 16 h. HAP1 data are from three triplicate experiments. B cell data are from five mice per genotype, each tested in triplicate. e, Plasma formate levels of wild-type (n = 10) and Adh5–/– (n = 11) mice. All data represent mean ± s.e.m. Statistical significance was assessed using two-tailed Student’s t-tests. * P ≤ 0.05; NS, not significant.
Formaldehyde supports nucleotide synthesis
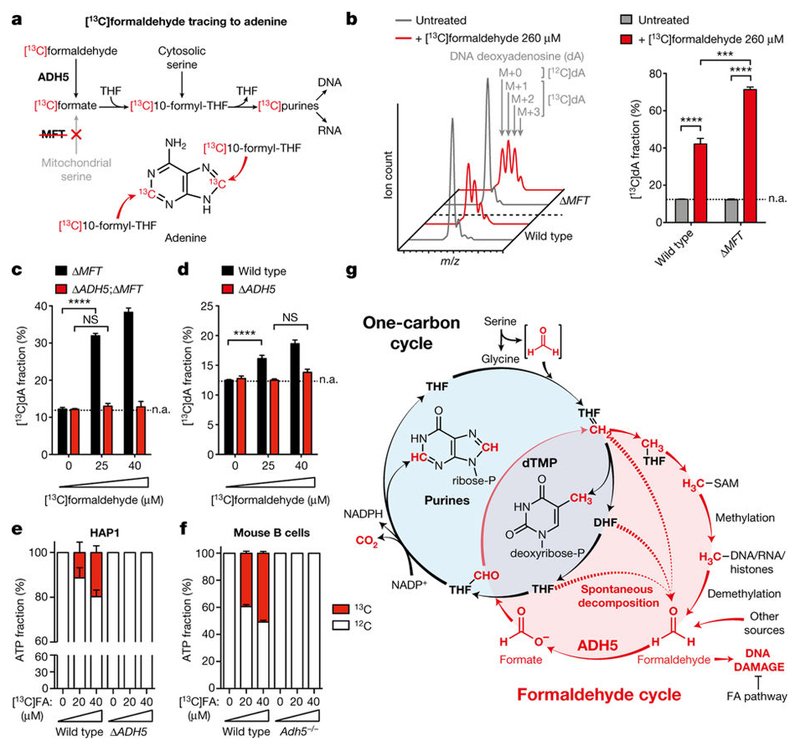
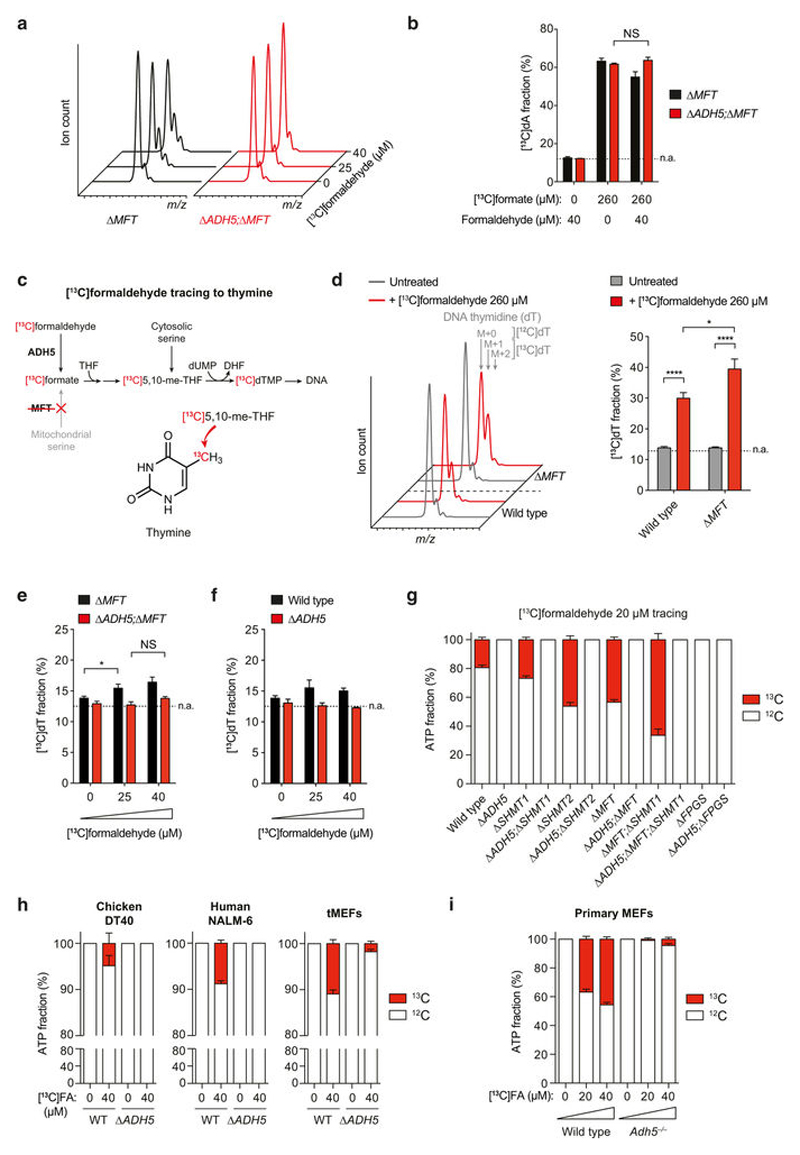
A key prediction of our studies is that ADH5-dependent formaldehyde oxidation into formate should provide 1C units that enable nucleotide synthesis23. Indeed, [13C]formaldehyde could be traced through to DNA deoxyadenosine (dA) by liquid chromatography–mass spectrometry in HAP1 cells (Fig. 5a, b). As expected, in Δ MFT cells this incorporation was enhanced, since these cells lack mitochondrial formate synthesis. Tracing lower [13C]formaldehyde doses in Δ MFT and Δ ADH5;Δ MFT cells revealed that incorporation of [13C]formaldehyde into dA is also ADH5-dependent (Fig. 5c and Extended Data Fig. 11a). Exposure to these physiological concentrations of [13C]formaldehyde also led to significant dA labelling in 1C-cycleproficient cells (Fig. 5d). Importantly, ADH5-deficient cells were equally effective at incorporating [13C]formate into dA, and concurrent exposure to 40 μ M formaldehyde did not prevent this incorporation (Extended Data Fig. 11b). This indicates that this dose of formaldehyde does not compromise the usage of formate for nucleotide synthesis in ADH5-deficient cells. Formaldehyde incorporation should not be restricted to purines, since 1C units are also used to make the pyrimidine thymine (Extended Data Fig. 11c). Indeed, [13C]formaldehyde could also be traced into DNA thymidine (dT), although the incorporation into this nucleoside was reduced compared with dA (Extended Data Fig. 11d–f). Tracing [13C]formaldehyde to DNA nucleosides requires DNA replication. To assess the contribution of physiological concentrations of formaldehyde to nucleotide synthesis more directly, we analysed the incorporation of 13C into de novo synthesized ATP during a short incubation of cells with 20 or 40 μ M [13C]formaldehyde. We observed significant ATP labeling in HAP1 strains proficient for ADH5, and this was higher in 1C-cycledefective mutants (Fig. 5e and Extended Data Fig. 11g). FPGS-deficient cells are an exception, as formate usage for nucleotide synthesis is disrupted in these cells. Additionally, we traced [13C]formaldehyde into the ATP pool in other cell lines and primary cells (Fig. 5f and Extended Data Fig. 11h, i). In all instances, [13C]formaldehyde contributed significantly to ATP synthesis in an ADH5-dependent manner. Remarkably, in LPS-activated splenic B cells and primary MEFs this accounted for as much as 50% of de novo synthesized ATP. In conclusion, these experiments show that formaldehyde detoxification by ADH5 supplies 1C units that contribute to nucleotide synthesis.
Figure 5. Formaldehyde-derived 1C units contribute to nucleotide synthesis.
a, [13C]formaldehyde tracing to adenine. b, Left, mass spectra of dA in HAP1 cells untreated or treated with [13C]formaldehyde in medium with Gly and without HT. The incorporation of 1–3 13C atoms into dA increases the m/z by 1–3 units (M+ 1, M+ 2 or M+ 3, respectively). Right, quantitation of left panel. c, d, [13C]formaldehyde tracing to dA in 1C-cycle-deficient (c) or proficient (d) HAP1 cells. In panels b–d, [13C] formaldehyde was added in increasing amounts each day. Each indicated dose represents the total cumulative dose of [13C]formaldehyde. [13C]dA fractions were not corrected for natural abundance (n.a., dotted line). Data are from three experiments. e, f, Tracing of physiological doses of [13C] formaldehyde to ATP in HAP1 (e) and LPS-blasted B cells (f) cultured in medium without HT for 16 h. [13C]ATP fractions were corrected for natural abundance and are relative to ATP synthesized de novo during the tracing. Data in e are from three triplicate experiments. Data in f are from five mice per genotype, each tested in triplicate. All data represent mean ± s.e.m. Statistical significance was assessed using two-tailed Student’s t-tests. * * * P ≤ 0.001; * * * * P ≤ 0.0001; NS, not significant. g, Model for a mammalian endogenous formaldehyde cycle. THF= CH2, 5,10-methylene-THF; THF–CHO, 10-formyl-THF; THF–CH3, 5-methyl-THF; SAM, S-adenosylmethionine; FA, Fanconi anaemia.
Discussion
Serine is the major source of formate in cells, contributing to around 50% of total formate production in mice13,17. The origin of the remaining 50% is unclear, however a significant fraction could come from endogenous formaldehyde. Notably, the reversal of 1C-unit-derived methylation from DNA, RNA and histones releases formaldehyde3, and its detoxification would also provide formate that re-enters 1C metabolism. Based on this circuitous route for formaldehyde-derived 1C units, we propose the existence of an endogenous formaldehyde cycle in mammals (Fig. 5g).
Folate derivatives are constantly decomposing in our bodies24–26, and our findings predict a proportion of this turnover would release formaldehyde. Depleted folate pools may contribute to the genesis of neural tube anomalies. More generally, folic acid deficiency results in widespread health consequences, and this is why the vitamin is a common dietary supplement. However, excess folate consumption can cause developmental abnormalities in mice27,28. While the formaldehyde produced from excessive folic acid consumption would be efficiently dealt with by two-tier protection, some damage may still occur and explain these reported toxic effects. Individuals who lack tier two protection against formaldehyde, such as those afflicted by Fanconi anaemia, might be susceptible to formaldehyde released from folate decomposition. Moreover, a common inherited human mutation is the 677C> T mutation in the gene encoding methylenetetrahydrofolate reductase (MTHFR), which converts 5,10-me-THF to 5-methyl-THF. This mutation may increase folate decomposition29, which may explain to some extent why humans carrying the 677C> T mutation might be more prone to certain chronic illnesses. The 1C cycle is now understood to have a central role in the remodelled metabolism of cancer cells2. The enzymes that drive remodeled 1C metabolic circuits are therefore promising therapeutic targets. However, our work shows that cancer cells could resupply their 1C needs through formaldehyde detoxification. Finally, some effective chemotherapeutic agents that block aspects of 1C metabolism are useful in cancer treatment but they also kill normal cells30. We now suggest a new strategy to target certain cancer cells, particularly those deficient in DNA crosslink repair such as BRCA1- or BRCA2-mutant cancers. Delivering a source of formaldehyde in the form of folate derivatives in combination with ADH5 inhibition could selectively kill such cancer cells.
Methods
Cell culture and cytotoxicity assays
All chemicals/reagents were purchased from Sigma, unless otherwise stated. DT40 cells12 were grown in RPMI medium (Gibco) supplemented with 3% chicken serum (Gibco), 7% fetal calf serum (Gibco), 50 μ M β -mercaptoethanol and penicillin/streptomycin (Gibco). NALM-6 cells were grown in RPMI medium supplemented with 10% fetal calf serum, 50 μ M β -mercaptoethanol and penicillin/streptomycin. FANCB-deficient NALM-6 cells were a gift31. HAP1 cells (Haplogen) were grown in IMDM medium (Gibco) supplemented with 10% dialysed fetal calf serum and penicillin/streptomycin. Transformed MEFs and primary MEFs were grown in DMEM medium (Gibco) supplemented with 10% dialysed fetal calf serum and penicillin/streptomycin. LPS-blasted spleen B cells were grown in RPMI medium supplemented with 10% fetal calf serum, 50 μ M β -mercaptoethanol, penicillin/streptomycin and 40 μ g ml−1 LPS. All cell lines and primary cells were grown at 37 °C and 5% CO2. All cell lines used in the study were tested to be mycoplasma-free. DT40 and NALM-6 cell lines were not authenticated. For cytotoxicity assays, 5 °— 103 cells (DT40 and NALM-6) or 2.5 °— 103 cells (HAP1) were plated in a 96-well plate in triplicate for each condition. The indicated amounts of formaldehyde (Thermo Fisher Scientific), tetrahydrofolate and other folate derivatives (Schircks Laboratories) were added to these wells on the day of plating (DT40 and NALM-6) or 24 h after plating (HAP1). Cell viability was measured using MTS reagent (Promega) 3 days (DT40), 4 days (HAP1) or 5 days (NALM-6) after plating. Absorbance at 492 nm was measured with a Pherastar spectrophotometer. THF sensitivity of HAP1 1C-cycle-deficient mutants was determined with three independent targeted clones.
Mice
Adh5–/–Fancd2–/– mice, Adh5+/–Fancd2–/– mice and controls were from a C57BL/6 °— 129SV hybrid background and were generated as described previously4. Mice from a C57BL/6 pure background were used for the measurement of metabolites in plasma, generation of MEFs and tracing of [13C]formaldehyde in LPSblasted spleen B cells. In individual experiments, all mice were matched for age and gender. All animal experiments undertaken in this study were done with the approval of the UK Home Office and the MRC Centre Ethical Review Committee.
Assays with LPS-activated mouse spleen B cells
The B lymphocytes were purified from mouse spleens using Lympholyte M (Cedarlane), and activated with 40 μ g ml−1 LPS. To test the cytotoxicity of THF, 4 °— 105 cells were plated in a well of a 24-well plate with various concentrations of THF. After 7 days, the viable cells were counted using trypan blue exclusion on a Vi-Cell XR cell viability counter (Beckman Coulter). To trace [13C]formaldehyde into formate and ATP, cells were grown in the presence of LPS for 48 h before the addition of the tracer.
Generation of mouse embryonic fibroblasts (MEFs)
Generation of MEFs has been described elsewhere32. Transformation of these cells was performed by retroviral transduction with large T antigen (pBABE-SV40 LT, Addgene). CFU–S assays. CFU–S assays were performed as reported previously33.
CRISPR–Cas9-mediated gene disruptions in NALM-6 and HAP1 cells
Guide sequences for each gene targeting can be found in Supplementary Table 1. Each guide sequence was cloned into pX458 or pX461 vectors34. NALM-6 Δ ADH5 clones were generated using both approaches (pX458 and pX461). NALM-6 cells were transfected with the CRISPR plasmids using the Amaxa Nucleofector Kit T (Lonza) according to the manufacturer’s protocol. Generation and validation of HAP1 Δ ADH5 cells has been shown before35. For targeting of 1C cycle genes, cells were transfected with Turbofectin 8.0 (Origene). Two days post-transfection, GFP-positive cells were single-cell sorted into 96-well plates containing medium supplemented with 20% fetal calf serum, using a MoFlo cell sorter (Beckman-Coulter). After 14 days of incubation at 37 °C, individual clones were analysed for expression of the relevant protein by western blotting. Targeted loci were subjected to Sanger sequencing (GATC). Supplementary Table 2 contains the primers used to amplify the relevant loci by PCR.
ADH5 complementation of ΔADH5 HAP1 strains
ADH5-Flag was amplified by PCR (forward: 5′ -CCGGCTAGCGGGGATGCCGCCACCATGGCGAACCAG GTGATCAG and reverse: 5′ -TGGAGATCTCCCGATTTATTTGTCATCGTCATCTTTGTAGTCTTTGTCATCGTCATCTTTGTAGTCCATCTTTAGAACAGTTCG) and InFusion cloned (Clontech) into pExpress (EcoRV digested)36. The resulting vector was then digested with SpeI and the fragment containing the β -actin promoter, ADH5-2°—Flag and SV40 transcription termination site was subsequently cloned into plox-BSR (SpeI digested) and sequence verified36. For complementation of Δ ADH5 HAP1 cells, 8 °— 105 cells were transfected in 6-well plates with 2 μ g of plox-ADH5-2°—Flag-BSR using 6 μ g polyethylenimine as a transfection reagent. Two days after transfection, 20 μ g ml−1 blasticidin (Gibco) was added, and after 10 days of selection complemented clones were single-cell sorted into 96-well plates containing medium supplemented with 20% fetal calf serum and 20 μ g ml−1 blasticidin, using a MoFlo cell sorter (Beckman-Coulter). After 14 days, individual clones were analysed for ADH5 expression by western blotting. To further assess ADH5 complementation, the positive clones were tested for resistance against formaldehyde.
Western blotting
Cells were lysed for 30 min on ice in RIPA buffer (Thermo Fisher Scientific), including protease inhibitor cocktail (Roche) and phosphatase inhibitor cocktail (Roche). For the detection of FANCD2 in DT40 cells, samples were run on a 3–8% Tris-Acetate gel (Thermo Fisher Scientific). Samples were blotted to a 0.45 μ m nitrocellulose membrane. Protein samples were run on a 4–12% Bis-Tris gel (Thermo Fisher Scientific) to detect phosphorylated CHK1 (Ser345) and β –actin in DT40 cells and ADH5, SHMT1, SHMT2 and β -actin in HAP1 cells. Antibodies can be found in Supplementary Table 3.
Growth assays with HAP1 cells in the presence or absence of various supplements
Growth in drop-out media: HAP1 cells (3.4 °— 103) were plated 6 times in a 96-well plate in medium without glycine supplemented with glycine and hypoxanthine and thymidine (HT); HT only; glycine only; glycine and formate or THF. Six days later, cell growth was assayed by MTS. Growth was expressed as percentage of cell growth relative to the same cells grown with glycine and HT or relative to wild-type cells grown with glycine and HT. In Fig. 3b, three independent clones were used for all 1C-cycle-deficient strains. Formaldehyde or THF supplementation: the same amounts of cells were plated in triplicate in two 96-well plates per cell line in medium without HT. Six hours later, formaldehyde or THF was added, with or without HT supplement, to one plate. For the next five days, cells were given a new dose of formaldehyde or THF that was 1.5°— the preceding dose. Each indicated dose is the total, cumulative dose of each compound, given to the cells during those 6 days of treatment. After these 6 days, cell growth was assayed by MTS. Growth was expressed as percentage of cell growth relative to the same cells grown with HT.
Growth curves of HAP1 cells
HAP1 cells (6.8 °— 103 per well, 6 wells in total) were plated (with or without HT) in a 96-well plate on day 0 (one plate for each time point). After 4 h, the cell growth was measured using MTS reagent as described above (day 0). At each indicated day, cell growth was measured using MTS again with one of the remaining plates. Each data point indicates the cell growth of that day relative to day 0 and is the average of at least two independent experiments. At least two independent clones were used for each ADH5-complemented strain.
Crystal-violet-stained plates of 1C-cycle-deficient HAP1 cells
Growth in media with or without HT: 4 °— 105 cells were plated in 6-well plates and grown in each medium. When cells proficient for ADH5 were close to confluence, cells were washed with PBS and stained in 6% glutaraldehyde and 0.5% crystal violet. An exception is ΔMFT;ΔSHMT1 and ΔADH5;ΔMFT;ΔSHMT1 cells grown in medium without HT; 4 °— 106 cells were plated and stained after 6 days. Growth in medium without HT supplemented with formaldehyde, THF or formate: 4 °— 105 cells were plated in 6-well plates. For five days after plating, cells were treated with a dose formaldehyde or THF each day. Each consecutive dose was 1.5 °— the preceding dose. Each indicated dose is the total, cumulative dose of each compound, given to the cells during 5 days. Formate was given in a single dose on day 1 of treatment. Six days after plating, cells were stained as described above.
Formaldehyde detection with FAP-1
Formaldehyde was detected with FAP-1, a formaldehyde-specific fluorescent probe19. For the in vitro analysis, formaldehyde, THF or other folate derivatives were mixed with FAP-1 (10 μ M) in PBS (pH 7.4) in a 96-well plate. Fluorescence (λex = 640 nm, λem = 680 nm) was measured at t = 0 and t = 30 min with a Pherastar spectrophotometer (software version 5.30 R3) or an emission spectrum (λex = 645 nm) was obtained between λem = 655–750 nm with a Cary Eclipse fluorometer (Varian, Advance Reads Application software version 1.1). Fluorescence increase (between t = 0 and t = 30 min) was calculated and corrected for the untreated control. A formaldehyde standard curve was used to calculate the concentration of formaldehyde. To measure the release of formaldehyde by different folate derivatives, these molecules were incubated in PBS at 37 °C for 24 h before addition of FAP-1. To monitor the release of formaldehyde by THF over time under different conditions, an aliquot was taken at each time point, mixed with 1% sodium ascorbate and placed on ice to stop the oxidative degradation. FAP-1 was then added to all samples and the fluorescence was measured. Different formaldehyde standards were used for each condition, treated in the same manner. These were used to create a formaldehyde standard curve at each time point for each condition, which was used to determine the concentration of formaldehyde. For the cellular analysis of formaldehyde release, HAP1 cells were maintained in medium without phenol red (Gibco). One million cells were resuspended in BSS buffer (136.9 mM NaCl, 5.37 mM KCl, 1.26 mM CaCl2, 0.81 mM MgSO4, 0.44 mM KH2PO4, 0.335 mM Na2HPO4, 10 mM PIPES, set to pH 7.2 with NaOH) including 5 μ M FAP-1 and incubated for 30 min at 37 °C. Cells were then washed with BSS and resuspended in 1 ml BSS supplemented with formaldehyde or a folate derivative with or without sodium ascorbate. The fluorescence was measured in the R-670 channel of a Fortessa flow cytometer (BD Biosciences, model number 647788E1) after two hours. At least 13,000 cells were measured per sample. The data were acquired using BDFACSDiva Software 6.2 and analysed with FlowJo 10.0.7 (Tree Star). The gating strategy is shown in Supplementary Fig. 2. In brief, intact cells were gated using SSC-A and FSC-A. Of this population, single cells were selected using FSC-A and FSC-H. Of all single cells, the geometric mean of R-670-A fluorescent signal was calculated. Measurements were corrected for autofluorescence by subtracting the geometric mean of the fluorescence from the unstained control.
Formaldehyde detection by gas chromatography–mass spectrometry (GC–MS)
To measure the release of formaldehyde by different folate derivatives, these molecules were incubated in PBS at 37 °C for 24 h. After incubation, cyclohexanone (internal standard) was added to each sample at a final concentration of 1 mg l−1. GC–MS analysis was carried out using an Agilent 7890A GC and 5975C MS with CTC-PAL autosampler (Agilent Technologies). A DB-WAX capillary column (l = 30 m, I.D. = 0.25 mm, dF = 0.25 μ m from Agilent Technologies) was used for the analysis. Samples were analysed by on-fibre derivatization, solid phase micro extraction (SPME). A 65 μ m PDMS/DVB fibre was pre-exposed to the headspace of a solution of 8 mg ml−1 O-(2,3,4,5,6-pentafluorobenzyl)hydroxylamine (PFBHA) in water (HPLC grade, VWR) for 10 min at room temperature, samples were incubated at 35 °C for 10 min and then the PFBHA coated fibres were exposed to the sample headspace for 25 min at 35 °C for analyte extraction and derivatization. Fibre desorption in the GC inlet was then carried out for 7 min. The GC oven conditions were as follows: the initial column temperature was 30 °C, which was held for 4 min then raised to 250 °C at 12 °C per min, where it was held for 2 min, giving a total run time of 24.33 min. The split/splitless inlet temperature was maintained at 250 °C and the septum purged at 2 ml per min. The GC inlet was operated in split mode (10:1) with 1 ml per min column flow rate using helium (N6.0 grade, BOC) as a carrier gas. The mass spectrometer was operated in single ion monitoring mode for the ions m/z 181, 195 and 225 for formaldehyde-PFBHA oxime (retention time 11.47 min) and m/z 181, 195 and 293 for cyclohexanone-PFBHA oxime internal standard (retention time 16.73 min) with m/z 181 used for quantification for both compounds. A dwell time of 200 ms was used for each ion. The transfer line to the mass spectrometer was heated to 220 °C, the source temperature was maintained at 230 °C and the quadrupole at 150 °C. The GC–MS data were acquired using MassHunter GCMS Acquisition B.07.05.2479. For quantification, all analyte integrated peak areas were ratioed to internal standard areas using MassHunter Quantitative Analysis Version B.07.01 SP1/Build 7.1.524.1 for GCMS. The method was calibrated across the range of 0.1 to 5 mg l−1 of formaldehyde: each calibration point was run in triplicate and a demonstrated precision of ≤ 15%.
Isotopic labelling of DNA nucleosides
HAP1 cells (4 °— 105) were plated in a 6-well plate. For five days after plating, cells were treated with a daily dose of [13C] formaldehyde or [13C]formate and/or unlabelled formaldehyde. Each consecutive dose was 1.5°— the preceding dose. Each indicated dose is the total, cumulative dose of each reagent, given to the cells during those 5 days. One day after the final treatment, the cells were harvested and counted using a ViCell XR (Beckman Coulter). DNA was extracted using a genomic DNA isolation kit (Zymo Research). Aliquots of 1 μ g were digested to nucleosides using a commercial enzyme blend (DNA Degradase Plus, Zymo Research), diluted with water, filtered (0.22 μ m) and analysed by liquid chromatography–mass spectrometry (LC–MS) on an Agilent 1260/1290 Infinity using a Zorbax SB-C18 4.6 °— 150 mm (5 μ m) column (Agilent) run with a water/acetonitrile gradient with 0.02% formic acid coupled to a 6130 quadrupole mass spectrometer via multimode ion source operating in APCI mode. Deoxyadenosine (dA) was identified by retention time and characteristic mass of the [dA+ H]+ ion in positive ionization mode (252.1 Da for the unlabeled compound, and 253.1 Da, 254.1 Da and 255.1 Da for the singly, doubly and triply 13C-labelled compound, respectively). Thymidine (dT) was identified by retention time and characteristic mass of the [dT+ formate]− ion in negative ionisation mode (287.1 Da for unlabeled dT and 288.1 Da and 289.1 Da for the singly and doubly 13C-labelled dT, respectively). The percentages of 13C-labelled dA and dT were corrected for cell growth during treatment. Data were not corrected for natural abundance of 13C. Data were acquired and analysed using OpenLAB Chemstation Edition C.01.07 (Agilent Technologies).
Metabolite analysis
For the tracing of [U-13C]serine into glycine, excreted formate and ATP in all HAP1 strains, cells were grown with [U-13C]serine for 16 h. For the tracing of [13C]formaldehyde into excreted formate and ATP in all cell lines and primary cells, cells were grown with [13C]formaldehyde in medium without HT for 16 h. After the 16 h incubation with the respective tracer, excreted formate and intracellular metabolites (glycine and ATP) were measured. Determination of labelled and non-labelled excreted formate (in the medium) by GC–MS, extraction of intracellular metabolites and determination of labelled and non-labelled glycine, ATP and glutathione by LC–MS were performed as described previously17. All data were corrected for natural abundance of 13C. In all the tracing experiments, dialysed fetal calf serum was used. Analysis of plasma formate was performed as described previously17. For the analysis of serine, glycine and methionine in plasma, frozen plasma samples were thawed on ice and 5 μ l of sample was transferred to a microcentrifuge tube, diluted with 245 μ l ice-cold extraction fluid (as described previously17) and shaken for 10 min at 4 °C and 1,200 r.p.m. After centrifugation (10 min at 18,213g and 4 °C) the supernatant was transferred to LC vials and kept at − 75 °C before LC–MS analysis. The measurement and data analysis of the metabolites using TraceFinder 3.1 (Thermo Fisher Scientific) were done according to previous work17. GC–MS data were acquired and analysed using MassHunter Workstation Software Quantitative Analysis Version B.06.00/Build 6.0.388.0 (Agilent Technologies). Analysis of metabolites in plasma was performed blinded.
Calculation of 13C incorporation into de novo synthesized ATP
To calculate the 13C incorporation into de novo synthesized ATP from [13C]formaldehyde, the ATP mass fractions were first corrected for the natural isotope abundance. The remaining M+ 1 and M+ 2 fractions are a result of incorporation of 13C from [13C]formaldehyde at the two 1C units in ATP. Assuming that both carbons can be labelled with equal probability p, the ATP M+ 1 and M+ 2 fractions are modeled by the equations P1 = (1 − P0)2p(1 − p) and P2 = (1 − P0)p2, respectively, where P0, P1 and P2 are the ATP M+ 0, 1 and 2 fractions, respectively. Solving these equations for p we obtain p = 2P2/(P1+ 2P2). The reported 13C enrichment in the 1C units of ATP was obtained using the latter equation and the measured P1 and P2.
Statistical analysis
All measurements were taken from distinct samples, unless otherwise stated. All data represent mean ± s.e.m. Statistical significance was assessed using two-tailed Student’s t-test (* P ≤ 0.05; * * P ≤ 0.01; * * * P ≤ 0.001; * * * * P ≤ 0.0001; NS, not significant). No statistical methods were used to predetermine sample size. Unless otherwise stated, the experiments were not randomized and the investigators were not blinded to allocation during experiments and outcome assessment.
Data availability
Source Data are provided for animal experiments (Fig. 1, Fig. 4 and Extended Data Fig. 10). Any additional information required to interpret, replicate or build upon the Methods or findings reported in the manuscript is available upon request from the corresponding author.
Extended Data
Extended Data Figure 1. Cellular sensitivity of DT40 mutants to THF and formaldehyde.
a, Wild-type, ΔADH5 and ΔFANCC chicken DT40 cells were exposed to doses of THF for 24 h. Western blots of lysates prepared from these cells were probed for FANCD2, CHK1phosphorylation (CHK1-pS345) and β -actin. Uncropped scans can be seen in Supplementary Fig. 1. FANCD2-Ub, monoubiquitinated FANCD2. b, Cellular sensitivity of DT40 mutants in Fanconi anaemia core-complex genes (FANCB and FANCL) to THF and formaldehyde. c, Cellular sensitivity of other Fanconi-deficient DT40 mutants to THF and formaldehyde. d, Cellular sensitivity to THF and formaldehyde of a panel of DT40 mutant cell lines defective in different DNA repair pathways: Fanconi anaemia pathway (ΔFANCB), translesion synthesis (ΔREV3), nucleotide excision repair (ΔXPA), homologous recombination (ΔXRCC2) and non-homologous end joining (ΔKU70). e, Top, scheme showing the reaction of formaldehyde with β -mercaptoethanol (β -ME). Bottom, suppression of THF and formaldehyde toxicity in wild-type, ΔADH5 and ΔFANCC DT40 cells by the addition of 100 μ M β -ME. Data in b–e are from three independent experiments, each carried out in triplicate, and represent mean ± s.e.m.
Extended Data Figure 2. THF toxicity in human cell lines deficient in protection against formaldehyde.
a, CRISPR–Cas9-mediated disruptions of the ADH5 locus in the human B cell line NALM-6. Exon 3 was targeted (in red) and the genetic changes (of one clone) in the sequence of both alleles are shown below. b, Western blot analysis of NALM-6 targeted clones for ADH5. Uncropped scans can be seen in Supplementary Fig. 1. c, Cellular sensitivity of wild-type, ΔADH5 and ΔFANCB NALM-6 strains to THF and formaldehyde. Four ΔADH5 clones were used. d, Suppression of THF and formaldehyde toxicity in wild-type and ΔADH5 HAP1 cells by the addition of 100 μ M β -ME. Data in c and d are from three independent experiments, each carried out in triplicate, and represent mean ± s.e.m.
Extended Data Figure 3. Characterization and THF sensitivity of a panel of 1C-cycle-deficient HAP1-mutant cell lines.
a, Scheme depicting key elements of the 1C cycle. The possible release of genotoxic formaldehyde (red) is shown. The enzymes targeted in HAP1 in this study are shown in bold. mTHF, monoglutamated THF (inactive); pTHF, polyglutamated THF (active); dTMP, deoxythymidine monophosphate. b, Metabolic characterization of the usage of [U-13C]serine in the 1C cycle by HAP1 mutants deficient in the proteins shown in a. The mass isotopomer distributions of glycine, formate and ATP are shown. Data are from two triplicate experiments. c, Functional characterization of the same HAP1 mutant strains by growth in media with (+ ) or without (–) glycine, HT and formate. Data represent two independent experiments, each with six replicates. d–f, Cellular sensitivity of the same cell lines to THF. Data are from two independent experiments, each done in triplicate. Three independent clones were used for the 1C-cycle-deficient mutant strains. All data represent mean ± s.e.m.
CRISPR-Cas9-mediated genetic disruptions in HAP1 Extended Data Figure 4. Strategy, genetic characterization and protein expression of CRISPR–Cas9-mediated knockouts in HAP1.
a, Scheme outlining the sequential strategy used to generate a panel of CRISPR–Cas9-mediated knockout cell lines in HAP1. The double nickase approach (pX461) was used to generate mutants that were subsequently targeted. Wild-type Cas9 (pX458) was used for the other targeting events. b, Targeted exons (red) and genetic changes (in one clone) of the 1C cycle genes disrupted in HAP1 in this study. c, Western blot analysis for ADH5, SHMT1 and SHMT2 expression in the HAP1 strains used in this study. Uncropped scans can be seen in Supplementary Fig. 1.
Extended Data Figure 5. Oxidative degradation of folate derivatives liberates formaldehyde.
a, In vitro activation of the FAP-1 probe by a concentration range of formaldehyde or THF. Formaldehyde and THF were incubated in PBS at 37 °C for 24 h before the addition of FAP-1 and the measurement of fluorescence. b, FAP-1 activation by formaldehyde in the absence or presence of ascorbate or β -mercaptoethanol (β -ME). c, Release of formaldehyde by THF (400 μ M) in PBS at different temperatures over time, measured using FAP-1. t1/2, estimated time required to release 50% of the total formaldehyde. Data in a–c are from two duplicate experiments. d, Top, detection of intracellular formaldehyde by FAP-1. Bottom, flow cytometry plot showing the fluorescence intensity of HAP1 cells. e, Activation of intracellular FAP-1 in HAP1 cells by formaldehyde or THF in the presence of a concentration range of ascorbate. f, Activation of FAP-1 in HAP1 cells exposed to folate derivatives sensitive or resistant to oxidative degradation. Data in e and f are from three duplicate experiments. A detailed description of the flow cytometry analysis in d–f can be seen in supplementary Fig. 2. g, Measurement by gas chromatography–mass spectrometry (GC–MS) of the formaldehyde released by folate derivatives (200 μ M) after 24 h incubation in PBS at 37 °C. In the case of the oxidation-resistant derivatives, formaldehyde was not detected (n.d.) (limit of detection: 1.66 μ M). Data are from two independent experiments, each carried out in triplicate. h, Model for the release of up to two molecules of formaldehyde by 5,10-me-THF. All data represent mean ± s.e.m. Statistical significance was assessed using two-tailed Student’s t-tests. * P ≤ 0.05; NS, not significant.
Extended Data Figure 6. Differential toxicity of folate derivatives in HAP1 cells.
Sensitivity of HAP1 wild-type and ΔADH5 strains to different folate derivatives. Top graphs show those derivatives that are prone to oxidative degradation. Bottom graphs show those derivatives that are resistant. Data are from three independent experiments, each done in triplicate, and represent mean ± s.e.m.
Extended Data Figure 7. Growth analysis of 1C-cycle-deficient HAP1 strains.
a, Glutathione (GSH) levels of all the HAP1 strains used in this study, measured by liquid chromatography–mass spectrometry. Data are from two independent experiments, each performed in triplicate. b, Crystal-violet-stained plates of 1C-cycle-knockout strains proficient (WT) or deficient (ΔADH5) in ADH5, grown in media with (+ ) or without (–) HT. For Δ MFT;ΔSHMT1 strains grown in medium without HT, 4 °— 106 cells were plated and grown for 6 days. For the other strains and conditions, 4 °— 105 cells were plated and grown until WT was close to confluence. c, Growth curves of HAP1 1C-cycle-defective strains proficient for ADH5, in medium without HT (left) and with HT (right). d, Growth curves of those HAP1 strains without growth defects. Data in c and d are from two independent experiments (each with six replicates). All data represent mean ± s.e.m.
Extended Data Figure 8. ADH5 complementation of 1C-cycledeficient HAP1 strains.
a–c, Top, western blots showing the expression of ADH5 in ΔADH5;ΔSHMT2 (a), ΔADH5;ΔMFT (b) and ΔADH5;ΔMFT;ΔSHMT1 (c) cells complemented with Flag-tagged ADH5. Uncropped scans can be seen in Supplementary Fig. 1. Bottom, cellular sensitivity assays showing that resistance to formaldehyde is restored in the ADH5-complemented strains. Data are from two independent experiments carried out in triplicate. At least two independent clones were used for all the ADH5-complemented strains. d–f, Growth curves in medium with HT of HAP1 1C-cycle-defective strains proficient, deficient (ΔADH5) or complemented (ΔADH5 + ADH5–Flag) for ADH5 expression. Data are from at least two independent experiments, each with six replicates. At least two independent clones were used for all the ADH5-complemented strains. All data represent mean ± s.e.m.
Extended Data Figure 9. THF-derived formaldehyde promotes cell growth of 1C-cycle-deficient cells.
a, Growth of 1C-cycle-deficient HAP1 strains in medium with HT with and without formaldehyde. b, Growth of HAP1 wild-type and ΔADH5 (without HT, left); ΔMFT and ΔADH5;ΔMFT (with HT, right) cells with a dose range of formaldehyde. c, Growth of HAP1 ΔMFT;ΔSHMT1 and ΔADH5;ΔMFT;ΔSHMT1 cells in medium without HT with a dose range of formaldehyde. d, Growth of HAP1 ΔSHMT1 and ΔADH5;ΔSHMT1 strains in medium without HT (left); ΔMFT;ΔSHMT1 and ΔADH5;ΔMFT;ΔSHMT1 strains in medium with HT (right), in the presence of a dose range of formaldehyde. e, Growth of ΔMFT and ΔADH5;ΔMFT HAP1 strains in medium without HT supplemented with a dose range of THF. f, Crystal-violet-stained plates of HAP1 ΔMFT and ΔADH5;ΔMFT strains in medium without HT untreated or treated with THF or formate. g, Growth of HAP1 wild-type and ΔADH5 (without HT, left); ΔMFT and ΔADH5;ΔMFT (with HT, right) cells with a dose range of THF. h, Growth of HAP1 ΔMFT cells in medium without HT supplemented with a low dose range of THF. Formaldehyde (panels a–d) and THF (panels e–h) were added in increasing amounts each day. Each indicated dose represents the total cumulative dose of formaldehyde or THF. Data in a–e, g and h are from two independent experiments (carried out in triplicate) and are expressed as percentage of cell growth compared to the same strain grown in medium with HT (untreated). All data represent mean ± s.e.m. Statistical significance was assessed using two-tailed Student’s t-tests. * P ≤ 0.05.
Extended Data Figure 10. Formaldehyde detoxification by ADH5 contributes to the 1C pool.
a–c, Tracing of physiological doses of [13C] formaldehyde (FA) to excreted formate in all the HAP1 strains used in this study (a), other cell lines (b) and primary MEFs (c) cultured in medium without HT for 16 h. Data are from two independent experiments carried out in triplicate. d, Plasma levels of serine, glycine and methionine of wild-type (n = 10) and Adh5–/– (n = 11) mice. The plasma samples tested are the same as those shown in Fig. 4e. All data represent mean ± s.e.m. Statistical significance was assessed using two-tailed Student’s t-tests. NS, not significant.
Extended Data Figure 11. Formaldehyde detoxification supplies 1C units for purine and thymine synthesis.
a, Representative mass spectra of dA in HAP1 mutants exposed to physiological doses of [13C]formaldehyde. b, Incorporation of [13C]formate into dA in the presence of 0 or 40 μ M formaldehyde in ΔMFT and ΔADH5;ΔMFT HAP1 cells. c, Scheme outlining the use of 13C-labelled formaldehyde to track its predicted incorporation into thymine. dUMP, deoxyuridine monophosphate; dTMP, deoxythymidine monophosphate. d, Left, mass spectra of DNA thymidine (dT) in HAP1 wild-type and ΔMFT cells in the absence or presence of [13C]formaldehyde. The incorporation of one or two atoms of 13C into dT increases the m/z by 1 (M+ 1) or 2 (M+ 2) units, respectively. Right, quantitation of left panel. e, Percentage of 13C-labelled dT in ΔMFT and ΔADH5;ΔMFT HAP1 cells untreated or treated with physiological doses of [13C]formaldehyde. f, Incorporation of [13C]formaldehyde into dT in HAP1 wild-type and ΔADH5 cells. 13C-labelled dA and dT fractions were not corrected for natural abundance (n.a.), which is indicated with a dotted line. 13C]formaldehyde (panels a, d, e and f), [13C]formate and formaldehyde (panel b) were added in increasing amounts each day. Each indicated dose represents the total cumulative dose of the respective compound. Data in b, d, e and f are from three independent experiments. g-i, Tracing of physiological doses of [13C] formaldehyde (FA) to ATP in all the HAP1 strains used in this study (g), other cell lines (h) and primary MEFs (i) cultured in medium without HT for 16 h. Data are from two independent experiments, each carried out in triplicate. 13C-labelled ATP fractions were corrected for natural abundance and are relative to the ATP synthesized de novo during the tracing. dA, dT and ATP were measured by liquid chromatography–mass spectrometry. All data represent mean ± s.e.m. Statistical significance was assessed using two-tailed Student’s t-tests. * P ≤ 0.05; * * * * P ≤ 0.0001; NS, not significant.
Supplementary Material
Supplementary Information is available in the online version of the paper.
Acknowledgements
We thank C. Knox and the LMB mouse facility, the LMB FACS facility and G. MacKay and D. Sumpton from the Beatson Metabolomics Unit. We thank H. Koyama for providing us with the FANCB-deficient NALM-6 strain. We are grateful to T. Elliott and A. Liang for assistance with the LMB LC–MS analyses. G.B.B. was funded by the CRUK Cambridge Cancer Centre studentship and the Wellcome Trust. N.W. was funded by Children With Cancer and the Wellcome Trust. L.B.P. was funded by the Wellcome Trust. F.A.D. and L.M. were funded by CRUK. I.V.R. was funded by BFU2013-42918-P, AES15/01409 (CP12/03273), European Union (FEDER) and RYC-2015-18670. We thank the NIH (GM 79465 and ES004705 to C.J.C.) for support of this work. C.J.C. is an Investigator of the Howard Hughes Medical Institute. T.F.B. was partially supported by a Chemical Biology Training Grant from the NIH (T32 GM066698). R.L.C. and P.S.M. are supported by the MRC. R.L.C. is also supported by the EPSRC. J.M., M.P. and A.V. were funded by CRUK (C596/A21140 and C596/A18076). J.M. was also funded by a DFG Fellowship (ME 4636/2-1). K.J.P. is supported by the Medical Research Council, CRUK and the Wellcome Trust.
Footnotes
Author Contributions
G.B.B., N.W. and K.J.P. conceived the study. G.B.B. and N.W. conducted the majority of the experiments with assistance from F.A.D., L.M., L.B.P. and I.V.R. T.F.B. and C.J.C. provided the FAP-1 reagent and technical assistance. Metabolic analysis was conceived, performed and analysed mainly by J.M., M.P. and A.V with contributions from G.B.B., N.W., F.A.D., R.L.C. and P.S.M. K.J.P. wrote the manuscript with assistance from G.B.B. and N.W.
References
- 1.Tibbetts AS, Appling DR. Compartmentalization of mammalian folate-mediated one-carbon metabolism. Annu Rev Nutr. 2010;30:57–81. doi: 10.1146/annurev.nutr.012809.104810. [DOI] [PubMed] [Google Scholar]
- 2.Ducker GS, Rabinowitz JD. One-carbon metabolism in health and disease. Cell Metab. 2017;25:27–42. doi: 10.1016/j.cmet.2016.08.009. [DOI] [PMC free article] [PubMed] [Google Scholar]
- 3.Walport LJ, Hopkinson RJ, Schofield CJ. Mechanisms of human histone and nucleic acid demethylases. Curr Opin Chem Biol. 2012;16:525–534. doi: 10.1016/j.cbpa.2012.09.015. [DOI] [PubMed] [Google Scholar]
- 4.Pontel LB, et al. Endogenous formaldehyde is a hematopoietic stem cell genotoxin and metabolic carcinogen. Mol Cell. 2015;60:177–188. doi: 10.1016/j.molcel.2015.08.020. [DOI] [PMC free article] [PubMed] [Google Scholar]
- 5.Heck HD, et al. Formaldehyde (CH2O) concentrations in the blood of humans and Fischer-344 rats exposed to CH2O under controlled conditions. Am Ind Hyg Assoc J. 1985;46:1–3. doi: 10.1080/15298668591394275. [DOI] [PubMed] [Google Scholar]
- 6.Luo W, Li H, Zhang Y, Ang CY. Determination of formaldehyde in blood plasma by high-performance liquid chromatography with fluorescence detection. J Chromatogr B Biomed Sci Appl. 2001;753:253–257. doi: 10.1016/s0378-4347(00)00552-1. [DOI] [PubMed] [Google Scholar]
- 7.Nagy K, Pollreisz F, Takáts Z, Vékey K. Atmospheric pressure chemical ionization mass spectrometry of aldehydes in biological matrices. Rapid Commun Mass Spectrom. 2004;18:2473–2478. doi: 10.1002/rcm.1648. [DOI] [PubMed] [Google Scholar]
- 8.Osborn MJ, Talbert PT, Huennekens FM. The structure of ‘active formaldehyde’ (N5, N10-methylene tetrahydrofolic acid) J Am Chem Soc. 1960;82:4291–4297. [Google Scholar]
- 9.Horne DW. Neither methionine nor nitrous oxide inactivation of methionine synthase affect the concentration of 5,10-methylenetetrahydrofolate in rat liver. J Nutr. 2003;133:476–478. doi: 10.1093/jn/133.2.476. [DOI] [PubMed] [Google Scholar]
- 10.Scott KC, Grogory JF., III The fate of [3H]folic aicd in folate-adequate rats. J Nutr Biochem. 1996;7:261–269. [Google Scholar]
- 11.Schmitz JC, Grindey GB, Schultz RM, Priest DG. Impact of dietary folic acid on reduced folates in mouse plasma and tissues. Relationship to dideazatetrahydrofolate sensitivity. Biochem Pharmacol. 1994;48:319–325. doi: 10.1016/0006-2952(94)90103-1. [DOI] [PubMed] [Google Scholar]
- 12.Rosado IV, Langevin F, Crossan GP, Takata M, Patel KJ. Formaldehyde catabolism is essential in cells deficient for the Fanconi anemia DNA-repair pathway. Nat Struct Mol Biol. 2011;18:1432–1434. doi: 10.1038/nsmb.2173. [DOI] [PubMed] [Google Scholar]
- 13.Ducker GS, et al. Reversal of cytosolic one-carbon flux compensates for loss of the mitochondrial folate pathway. Cell Metab. 2016;23:1140–1153. doi: 10.1016/j.cmet.2016.04.016. [DOI] [PMC free article] [PubMed] [Google Scholar]
- 14.Patel H, Pietro ED, MacKenzie RE. Mammalian fibroblasts lacking mitochondrial NAD+-dependent methylenetetrahydrofolate dehydroge nase-cyclohydrolase are glycine auxotrophs. J Biol Chem. 2003;278:19436–19441. doi: 10.1074/jbc.M301718200. [DOI] [PubMed] [Google Scholar]
- 15.McCarthy EA, Titus SA, Taylor SM, Jackson-Cook C, Moran RG. A mutation inactivating the mitochondrial inner membrane folate transporter creates a glycine requirement for survival of chinese hamster cells. J Biol Chem. 2004;279:33829–33836. doi: 10.1074/jbc.M403677200. [DOI] [PubMed] [Google Scholar]
- 16.Lawrence SA, et al. Mammalian mitochondrial and cytosolic folylpolyglutamate synthetase maintain the subcellular compartmentalization of folates. J Biol Chem. 2014;289:29386–29396. doi: 10.1074/jbc.M114.593244. [DOI] [PMC free article] [PubMed] [Google Scholar]
- 17.Meiser J, et al. Serine one-carbon metabolism with formate overflow. Sci Adv. 2016;2:e1601273. doi: 10.1126/sciadv.1601273. [DOI] [PMC free article] [PubMed] [Google Scholar]
- 18.Chippel D, Scrimgeour KG. Oxidative degradation of dihydrofolate and tetrahydrofolate. Can J Biochem. 1970;48:999–1009. doi: 10.1139/o70-156. [DOI] [PubMed] [Google Scholar]
- 19.Brewer TF, Chang CJ. An aza-Cope reactivity-based fluorescent probe for imaging formaldehyde in living cells. J Am Chem Soc. 2015;137:10886–10889. doi: 10.1021/jacs.5b05340. [DOI] [PubMed] [Google Scholar]
- 20.De Brouwer V, Zhang GF, Storozhenko S, Straeten DV, Lambert WE. pH stability of individual folates during critical sample preparation steps in prevision of the analysis of plant folates. Phytochem Anal. 2007;18:496–508. doi: 10.1002/pca.1006. [DOI] [PubMed] [Google Scholar]
- 21.Uotila L, Koivusalo M. Formaldehyde dehydrogenase from human liver. Purification, properties, and evidence for the formation of glutathione thiol esters by the enzyme. J Biol Chem. 1974;249:7653–7663. [PubMed] [Google Scholar]
- 22.Uotila L, Koivusalo M. Purification and properties of S-formylglutathione hydrolase from human liver. J Biol Chem. 1974;249:7664–7672. [PubMed] [Google Scholar]
- 23.Bae S, Chon J, Field MS, Stover PJ. Alcohol dehydrogenase 5 is a source of formate for de novo purine biosynthesis in HepG2 cells. J Nutr. 2017;147:499–505. doi: 10.3945/jn.116.244467. [DOI] [PMC free article] [PubMed] [Google Scholar]
- 24.Kownacki-Brown PA, Wang C, Bailey LB, Toth JP, Gregory JF., III Urinary excretion of deuterium-labeled folate and the metabolite p-aminobenzoylglutamate in humans. J Nutr. 1993;123:1101–1108. doi: 10.1093/jn/123.6.1101. [DOI] [PubMed] [Google Scholar]
- 25.Murphy M, Scott JM. The turnover catabolism and excretion of folate administered at physiological concentrations in the rat. Biochim Biophys Acta. 1979;583:535–539. doi: 10.1016/0304-4165(79)90071-0. [DOI] [PubMed] [Google Scholar]
- 26.Witham KL, et al. 5-methyl-tetrahydrofolate and the S-adenosylmethionine cycle in C57BL/6J mouse tissues: gender differences and effects of arylamine N-acetyltransferase-1 deletion. PLoS One. 2013;8:e77923. doi: 10.1371/journal.pone.0077923. [DOI] [PMC free article] [PubMed] [Google Scholar]
- 27.Marean A, Graf A, Zhang Y, Niswander L. Folic acid supplementation can adversely affect murine neural tube closure and embryonic survival. Hum Mol Genet. 2011;20:3678–3683. doi: 10.1093/hmg/ddr289. [DOI] [PMC free article] [PubMed] [Google Scholar]
- 28.Pickell L, et al. High intake of folic acid disrupts embryonic development in mice. Birth Defects Res A Clin Mol Teratol. 2011;91:8–19. doi: 10.1002/bdra.20754. [DOI] [PubMed] [Google Scholar]
- 29.Ghandour H, Chen Z, Selhub J, Rozen R. Mice deficient in methylenetetrahydrofolate reductase exhibit tissue-specific distribution of folates. J Nutr. 2004;134:2975–2978. doi: 10.1093/jn/134.11.2975. [DOI] [PubMed] [Google Scholar]
- 30.Farber S, Diamond LK. Temporary remissions in acute leukemia in children produced by folic acid antagonist, 4-aminopteroyl-glutamic acid. N Engl J Med. 1948;238:787–793. doi: 10.1056/NEJM194806032382301. [DOI] [PubMed] [Google Scholar]
- 31.Nomura Y, Adachi N, Koyama H. Human Mus81 and FANCB independently contribute to repair of DNA damage during replication. Genes Cells. 2007;12:1111–1122. doi: 10.1111/j.1365-2443.2007.01124.x. [DOI] [PubMed] [Google Scholar]
- 32.Wit N, et al. Roles of PCNA ubiquitination and TLS polymerases κ and η in the bypass of methyl methanesulfonate-induced DNA damage. Nucleic Acids Res. 2015;43:282–294. doi: 10.1093/nar/gku1301. [DOI] [PMC free article] [PubMed] [Google Scholar]
- 33.Garaycoechea JI, et al. Genotoxic consequences of endogenous aldehydes on mouse haematopoietic stem cell function. Nature. 2012;489:571–575. doi: 10.1038/nature11368. [DOI] [PubMed] [Google Scholar]
- 34.Ran FA, et al. Double nicking by RNA-guided CRISPR Cas9 for enhanced genome editing specificity. Cell. 2013;154:1380–1389. doi: 10.1016/j.cell.2013.08.021. [DOI] [PMC free article] [PubMed] [Google Scholar]
- 35.Bruemmer KJ, et al. Development of a general aza-Cope reaction trigger applied to fluorescence imaging of formaldehyde in living cells. J Am Chem Soc. 2017;139:5338–5350. doi: 10.1021/jacs.6b12460. [DOI] [PMC free article] [PubMed] [Google Scholar]
- 36.Arakawa H, Lodygin D, Buerstedde JM. Mutant loxP vectors for selectable marker recycle and conditional knock-outs. BMC Biotechnol. 2001;1:7. doi: 10.1186/1472-6750-1-7. [DOI] [PMC free article] [PubMed] [Google Scholar]
Associated Data
This section collects any data citations, data availability statements, or supplementary materials included in this article.
Supplementary Materials
Data Availability Statement
Source Data are provided for animal experiments (Fig. 1, Fig. 4 and Extended Data Fig. 10). Any additional information required to interpret, replicate or build upon the Methods or findings reported in the manuscript is available upon request from the corresponding author.


