

Abstract
The DNA damage response (DDR) preserves genomic integrity. Small non-coding RNAs termed DDRNAs are generated at DNA double-strand breaks (DSBs) and are critical for DDR activation. Here we show that active DDRNAs specifically localize to their damaged homologous genomic sites in a transcription-dependent manner. Upon DNA damage, RNA polymerase II (RNAPII) binds to the MRE11/RAD50/NBS1 complex, is recruited to DSBs and synthesizes damage-induced long non-coding RNAs (dilncRNAs) from and towards DNA ends. DilncRNAs act both as DDRNA precursors and by recruiting DDRNAs through RNA:RNA pairing. Together dilncRNAs and DDRNAs fuel DDR focus formation and associate with 53BP1. Accordingly, inhibition of RNAPII prevents DDRNA recruitment, DDR activation and DNA repair. Antisense oligonucleotides matching dilncRNAs and DDRNAs impair site-specific DDR focus formation and DNA repair. We propose that DDR signalling sites, in addition to sharing a common pool of proteins, individually host a unique set of site-specific RNAs necessary for DDR activation.
Introduction
Maintenance of genome integrity is vital for cells and organisms. Cells have evolved a prompt set of actions, the DNA damage response (DDR), to react to any discontinuity in their nuclear DNA. DNA double-strand breaks (DSBs) are among the most powerful activators of the DDR. DSBs are sensed by the MRE11/RAD50/NBS1 (MRN) complex, which is recruited to the lesion and activates the kinase ataxia telangiectasia mutated (ATM), leading to its auto-phosphorylation (pATM) and to the phosphorylation of histone H2AX at serine 139 (named γH2AX), a key step in DDR activation. γH2AX acts as a beacon for the secondary recruitment of additional pATM molecules and DDR proteins, such as p53 binding protein 1 (53BP1), fuelling further spreading of γH2AX and accumulation of DDR factors at DSBs in a positive feedback mechanism that results in the generation of cytologically detectable nuclear foci1.
DDR factors and RNA transcripts can functionally interact2. A role for RNA has emerged in DNA repair3–12 and genomic rearrangements13, although not univocally14,15. We previously reported that the secondary recruitment of DDR factors to sites of DNA damage relies on DICER- and DROSHA-dependent generation of DSB-induced small non-coding RNAs (ncRNAs) termed DNA damage response RNA (DDRNAs), carrying the sequence of the DNA flanking the DSB16,17, including at dysfunctional telomeres18. Similar small ncRNAs were reported in Neurospora crassa, A. thaliana, D. melanogaster and in human cell lines6, 7, 9, 10, 19.
It is presently unclear whether DDRNAs are processed from pre-existing transcripts or from RNA molecules induced by DNA damage. Similarly, the mechanism by which DDRNAs control focus formation and DDR activation in a sequence-dependent manner is unclear. Here we show that DDRNA precursors, termed damage-induced long non-coding RNAs (dilncRNAs), are generated by RNAPII from DNA ends of DSBs. Pairing between DDRNAs and dilncRNAs allows site-specific localization of DDRNAs at the damaged site and the formation of a DDR focus, which can be site-specifically targeted with antisense oligonucleotides.
Results
RNAPII-dependent site-specific localization of DDRNA
To characterize DDRNA functions, we studied their intracellular localization in NIH2/4, a mouse cell line carrying an integrated construct containing a recognition site for the I-SceI endonuclease flanked by Lac- or Tet-operator sequences at either side20. We chemically synthesized four 3’-fluorophore-labeled DDRNA pairs (DDRNA-Cy5) previously identified in these cells16 (Supplementary Fig. 1A) and two control RNAs matching unrelated sequences. Localization of DDRNA-Cy5 was studied by intracellular single-molecule high-resolution localization and counting (iSHiRLoC)21–23, upon microinjection into the nucleus of NIH2/4 expressing GFP-LacR, with or without I-SceI. Strikingly, both pooled and individual pairs of microinjected DDRNAs, but not control RNAs, preferentially accumulated at the LacR spot in cut cells only, as quantified by single-molecule counting based on iSHiRLoC’s stepwise photobleaching procedure21–23(Fig. 1A, B and Supplementary Fig. 1B-E).
Figure 1. Sequence-specific localization of DDRNAs at DNA damage sites is transcription-dependent.
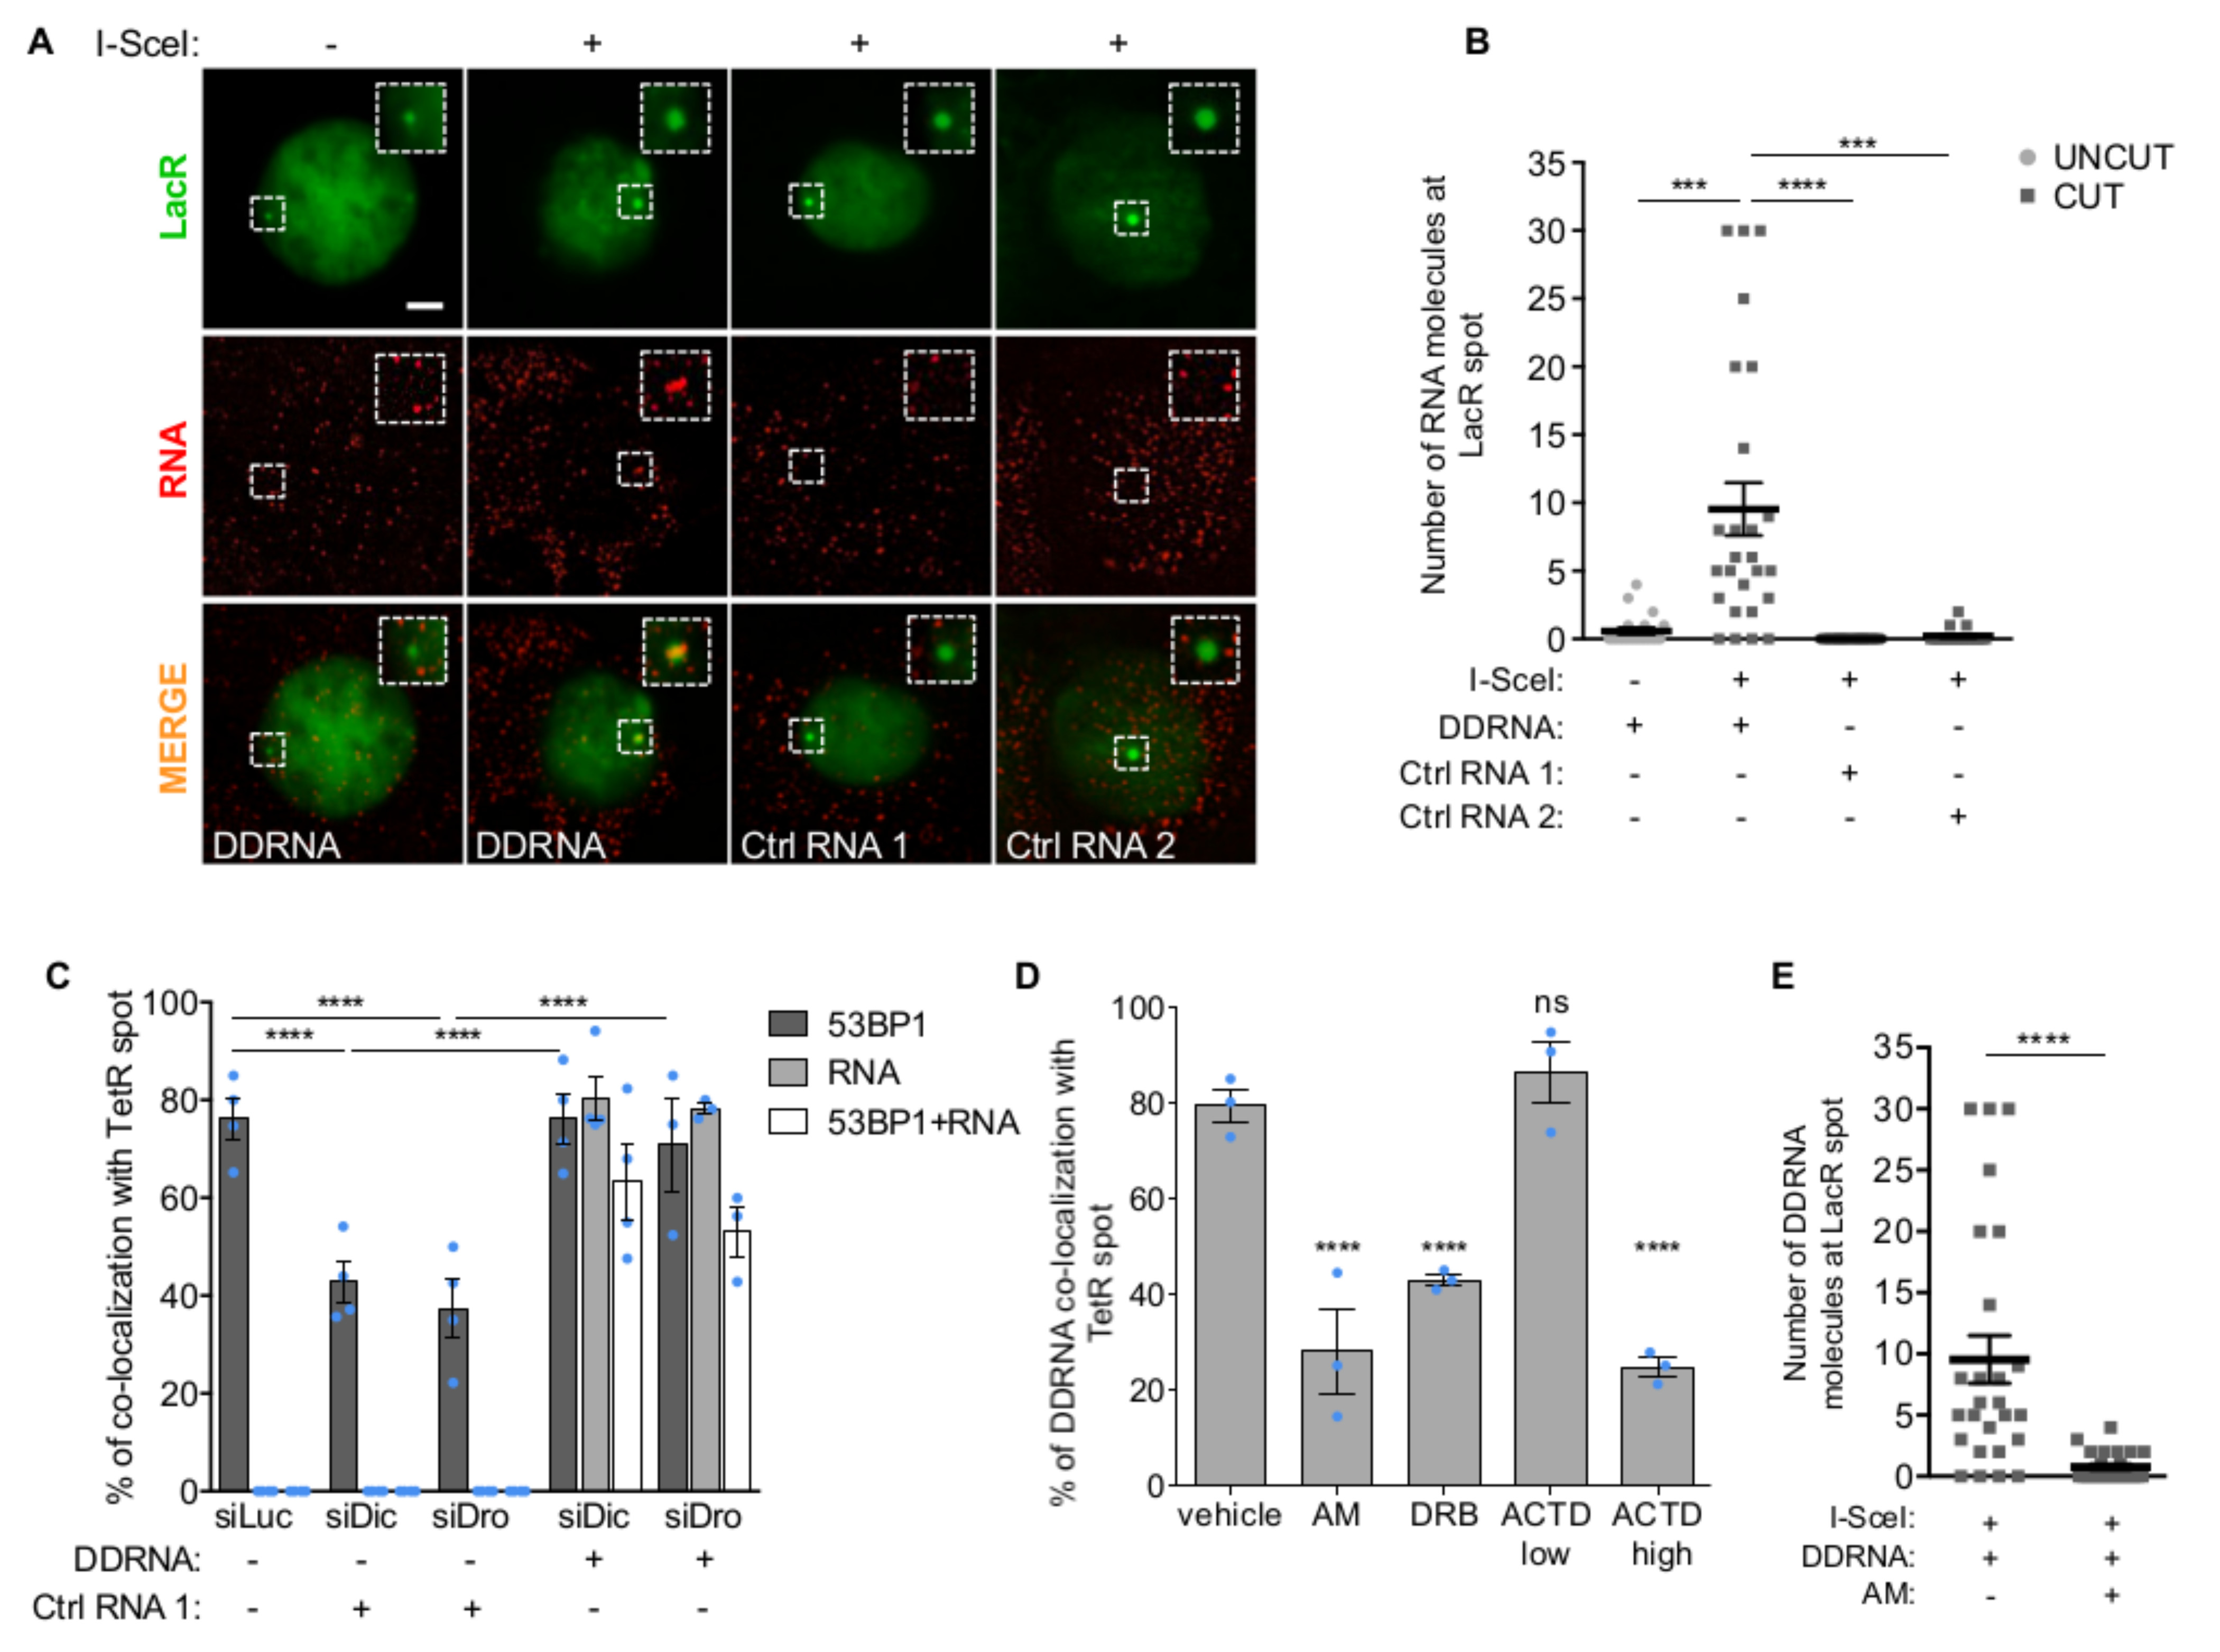
(A) Images of NIH2/4 cells expressing GFP-LacR, microinjected with double-stranded DDRNA-Cy5, artificial CXCR4-Cy5 miRNA (Ctrl RNA 1) or let-7a-Cy5 miRNA (Ctrl RNA 2), together with BSA (-) or I-SceI restriction enzyme (+) and imaged 4 h post injection. Scale bar 5 µm. Inset is a magnified view of the boxed region. Images from one out of 3 experiments with similar results. (B) Quantification of (A) showing the number of fluorophore-labeled RNA molecules at the locus as measured by single-molecule analysis based on stepwise photobleaching. Dots represent individual cells. The black line represents the mean ± SEM (data are shown as pool of n=3 independent experiments). (C) DDRNAs localize at the damage site to restore DDR focus formation. NIH2/4 cells knocked-down for Dicer and Drosha were mildly permeabilized and incubated with DDRNA-Cy5 or CXCR4-Cy5 (Ctrl RNA 1). The bar plot shows the percentage of cells positive for co-localization of 53BP1 with TetR, of RNA-Cy5 with TetR and the triple co-localization of 53BP1, RNA-Cy5 and TetR. Error bars indicate SEM (for siLuc and siDic n=4, for siDro n=3 independent experiments, ≥70 cells analysed in total per condition). (D) NIH2/4 cells expressing YFP-TetR and inducible I-SceI were treated with AM, DRB or ACTD at low and high doses or vehicle alone for 2 h before cut induction, then mildly permeabilized and incubated with DDRNA-Cy5. The bar plots show the percentage of cells in which DDRNA signal co-localizes with the TetR spot. Error bars indicate SEM (n=3 independent experiments, ≥80 cells analysed in total per condition). (E) NIH2/4 cells expressing GFP-LacR were microinjected with double-stranded DDRNA-Cy5, together with I-SceI protein and AM and imaged 4 h post injection. The plot shows the number of DDRNA molecules at the locus as measured by single-molecule counting based on stepwise photobleaching. Dots represent individual cells. The black line represents the mean ± SEM (data are shown as pool of n=3 independent experiments). (B,E) P values were calculated using two-tailed t-test. (C,D) P values were calculated using chi-squared test. ***P<0.001, ****P<0.0001, ns not significant.
Next, we investigated whether the localization of DDRNAs at the DSB is critical for their ability to activate DDR. We knocked-down Dicer or Drosha to prevent endogenous DDRNA biogenesis in NIH2/4 expressing YFP-TetR and I-SceI and, following membrane permeabilization, we incubated cells with exogenous DDRNAs-Cy5 or control RNAs. While 53BP1 focus was reduced upon Dicer and Drosha knockdown as expected16, it reformed only when sequence-specific DDRNAs-Cy5 accumulated at the locus, demonstrating that site-specific localization is crucial for DDRNA ability to activate DDR (Fig. 1C and Supplementary Fig. 1F, G).
To probe the mechanisms of sequence-dependent and damage-dependent localization of DDRNAs, we knocked-down H2AX to prevent DDR focus formation in NIH2/4 expressing I-SceI incubated with DDRNAs-Cy5. We observed that although 53BP1 recruitment was inhibited, DDRNAs still accumulated at the DSB (Supplementary Fig. 1H, I). To test the potential hybridization of DDRNAs to the damaged genomic site, we overexpressed RNaseH1 and this had no impact on DDRNA localization (Supplementary Fig. 1J, K). To test instead whether DDRNA localization depends on RNA:RNA base pairing with a potential nascent transcript, we transiently treated NIH2/4 prior to cut induction with α-amanitin (AM), a specific RNAPII inhibitor, or 5,6-dichloro-1-β-D-ribofuranosylbenzimidazole (DRB), an inhibitor of RNAPII elongation, or actinomycin D (ACTD) at a low dose to inhibit RNAPI or at a higher dose to inhibit both RNAPI and RNAPII24, or with vehicle only. Specificity and efficacy of each treatment were monitored under all conditions (Supplementary Fig. 1L). Remarkably, RNAPII inhibition consistently reduced DDRNA localization to the damage site (Fig. 1D). This result was recapitulated by microinjection of DDRNA-Cy5 and I-SceI protein, with or without AM (Fig. 1E).
Altogether, these results indicate that DDRNAs localize to their homologous damaged site and here they stimulate DDR focus formation site-specifically, in a RNAPII-dependent manner.
Damage-induced long non-coding RNAs are generated by RNAPII and interact with DDRNA
Next, we investigated the transcriptional landscape around a DSB in search for nascent transcripts, that we named damage-induced long non-coding RNAs (dilncRNAs). I-SceI-induced DSBs in NIH2/4 cells may in principle generate two species of dilncRNAs: diverging from the DSB (Lac-from and Tet-from), and converging towards the DSB (Lac-to and Tet-to) (Fig. 2A). Single-molecule fluorescent in situ hybridization (smFISH25) with strand-specific DNA probes (Supplementary Fig. 2A) revealed a stronger signal at the GFP-LacR locus in cut cells than in uncut cells for divergent transcripts, and a more modest but significant increase of signal upon cut also for convergent ones (Fig. 2B). Control probe (Ctrl) with an unrelated sequence did not co-localize with GFP-LacR (Fig. 2B). SmFISH signal was lost when RNaseA was added prior to hybridization or RNaseH was added after hybridization (Supplementary Fig. 2B). Careful calibration of the signal generated by probes binding only once per RNA molecule (Supplementary Fig. 2C) consistently detected an induction of dilncRNAs upon cut (Supplementary Fig. 2D).
Figure 2. DSBs induce dilncRNAs that interact with DDRNAs.

(A) Schematic of the four potential dilncRNAs induced upon DSB in NIH2/4 and of smFISH probes used for detection. (B) Induction of dilncRNAs in NIH2/4 measured by smFISH. Relative intensity of the indicated probes at uncut or cut locus. Dots represent individual cells. Black bar represents mean ± SEM (data are shown as pool of n=3 independent experiments). (C-F) Induction of dilncRNAs in NIH2/4, U2OS19ptight, HeLa111 and I-PpoI HeLa cells measured by strand-specific RT-qPCR. Bar plots show the mean relative enrichment of indicated RNA sets upon cut. Uncut sample of each RNA set was used as reference. Error bars indicate SEM (C: for Uni Lac-from n=4, for the other dilncRNAs n=5; D: n=3; E: n=4; F: n=4 independent experiments). (G) NIH2/4 knocked-down for Drosha (siDro), Dicer (siDic), Translin (siTsn), Dicer and Translin (siDic+Tsn) or Luciferase (siLuc) were transfected with I-SceI-expressing vector (+) or empty vector (-). Bar plots show the mean relative enrichment of Lac-from dilncRNA relative to uncut siLuc by strand-specific RT-qPCR. Error bars indicate SEM (for siLuc, siDic and siDro n=6, for the other conditions n=3 independent experiments). (H) NIH2/4 knocked-down for Drosha (siDro), Dicer (siDic) or Luciferase (siLuc) were transfected with I-SceI-expressing vector (+) or empty vector (-). RNA fractions of 15-40 nt in lenght were recovered by gel-extraction. Bar plot shows the mean relative enrichment of let7a miRNA and DDRNAs matching Lac sequences, relative to uncut siLuc. Error bars indicate SEM (n=3 independent experiments). (I) Biotinylated DDRNA (btn-L1 and btn-U1) or biotinylated miRNA (btn-let-7a) were transfected into NIH2/4 cells expressing I-SceI and RNA pull-down was performed. Bar plot shows dilncRNA Lac-from and Rplp0 mRNA levels, assessed by strand-specific RT-qPCR, as relative to input. Values are expressed as mean of 2 independent experiments. (J) Time course of γH2AX and 53BP1 focal accumulation by immunofluorescence, dilncRNA generation by smFISH and fluorescent DDRNA localization at the DSB in NIH2/4. Plot shows the percentage of cells bearing signals co-localizing with LacR. The dotted line represents best fit of data to a single exponential function. Error bars indicate SD (n=3 independent experiments, ≥12 cells analysed in total per time point). P values were calculated using two-tailed t-test. *P<0.05, **P<0.01, ***P<0.001, ****P<0.0001, ns not significant. Statistical source data are provided in Supplementary Table 4.
To gain additional independent evidence, we performed strand-specific RT-qPCR in NIH2/4 with different sets of primers and we observed consistent dilncRNA accumulation upon damage (Fig. 2C). Reverse-transcription with oligo-dT primers did not allow dilncRNA detection, indicating that dilncRNAs lack polyadenylation (Supplementary Fig. 2E).
To determine the identity of the RNA polymerase involved, we measured dilncRNA levels by strand-specific RT-qPCR in NIH2/4 briefly treated with transcription inhibitors prior to cut. AM, DRB or highly dosed ACTD all abolished dilncRNA induction (Supplementary Fig. 2F) and smFISH generated similar results (Supplementary Fig. 2G), indicating that damage-induced transcription is dependent on RNAPII. By contrast, ATM inhibition did not affect dilncRNA generation (Supplementary Fig. 2H).
Induction of dilncRNA was observed in several distinct cell systems: in a human cell line (U2OS19ptight26) bearing the same construct described for NIH2/4 (Fig. 2D) and in human and murine cell systems (HeLa11127 and NIH3T3duo28) with an integrated construct bearing the I-SceI cleavable site close to a non-repetitive sequence (Fig. 2E and Supplementary Fig. 2I).
Importantly, dilncRNAs are detectable also within endogenous genomic sites lacking any repetitive DNA sequence, such as upon I-PpoI nuclease-mediated cleavage within the DAB1 gene29 and an intergenic region (Fig. 2F and Supplementary Fig. 2J), upon AsiSI nuclease-mediated cleavage upstream the CYB561D1 gene30 and within another intergenic region (Supplementary Fig. 2K, L), and upon CRISPR/Cas9-induced DNA cleavage at the c-Myc gene (Supplementary Fig. 2M) – in all cell systems, only the strand lacking pre-existing gene transcription was analysed.
Next, we tested whether dilncRNAs are DDRNA precursors. We knocked-down Drosha or Dicer in NIH2/4 and measured the levels of dilncRNAs, DDRNAs and their processing intermediate species (pre-DDRNAs). qRT-PCR revealed an accumulation of dilncRNAs upon Drosha knockdown in cut cells compared to siLuc control, proving that these transcripts are indeed processed by Drosha (Fig. 2G and Supplementary Fig. 2N). Since we did not detect an accumulation of dilncRNAs upon Dicer knockdown, we inactivated Translin, part of the Translin/Trax complex that degrades intermediate precursors of miRNA biogenesis in the absence of Dicer31 and observed a rescue of dilncRNA induction in cells lacking Dicer when Translin was absent (Fig. 2G and Supplementary Fig. 2N).
To isolate DDRNAs and pre-DDRNAs we purified two RNA fractions by gel-extraction: a short fraction (15-40nt) containing miRNA and DDRNA (Fig. 2H) and a longer fraction (40-200nt) containing pre-miRNA and pre-DDRNA (Supplementary Fig. 2O). We observed an induction of both DDRNAs and pre-DDRNAs upon damage; let7a and let7a pre-miRNA controls remained unaltered, as expected. In the absence of either Dicer or Drosha, DDRNAs and let7a were significantly reduced. Also, pre-DDRNAs and let7a pre-miRNA levels were reduced in the absence of Drosha and increased in the absence of Dicer (Fig. 2H and Supplementary Fig. 2O). Altogether, these data indicate that miRNAs and DDRNAs are processed similarly.
Considering that dilncRNA synthesis and DDRNA localization are RNAPII-dependent, we hypothesized that DDRNA localization and function are mediated by their interaction with dilncRNAs. To test this, two different DDRNA duplexes with a 3'-end biotin modification (btn) on the strand matching Lac-from dilncRNA and a negative control miRNA were transfected into cut NIH2/4. By RNA pull-down assays, we observed a significant enrichment of dilncRNAs bound to DDRNAs, compared to control RNA – interactions were specific since Rplp0 mRNA was not detected (Fig. 2I). These results demonstrate that sequence-dependent localization of DDRNAs relies on their pairing with dilncRNAs. The observation that dilncRNAs, like other chromatin-associated ncRNAs such as TERRA32, are relatively resistant to RNaseA treatment (Supplementary Fig. 2P, Q), helps explaining our reported activity of exogenously-added DDRNAs in DDR foci reformation in RNaseA-treated cells16.
We next performed a time course study of the individual events following DSB induction. In parallel to the expected fast γH2AX accumulation, dilncRNA generation and DDRNA localization to the LacR spot were detectable as early as 5 minutes after damage induction and increased with very similar kinetics (Fig. 2J). 53BP1 accumulation was 10-fold slower. These observations suggest that dilncRNA induction and DDRNA localization to the damaged site are upstream signals that, together with γH2AX, nucleate DDR focus formation.
Active RNAPII is recruited to DSB
We next sought evidence for accumulation of RNAPII at DSBs. We isolated NIH2/4 nuclei from cut or uncut cells expressing Cherry-LacR and analysed by confocal microscopy γH2AX and transcribing RNAPII (RNAPII pSer5) (Supplementary Fig. 3A). RNAPII pSer5 was significant enriched at the cut locus (Supplementary Fig. 3B) and correlated with γH2AX presence (Supplementary Fig. 3C, D). By imaging chromatin fibers33 with super-resolution Binding-Activated Localization Microscopy (BALM), we detected a co-localization of RNAPII pSer5 with the LacR spot (Fig. 3A, B and Supplementary Fig. 3E). Furthermore, chromatin immunoprecipitation (ChIP) analyses in NIH2/4 revealed that total RNAPII, RNAPII pSer5 and RNAPII pSer2 were enriched upon DSB induction, similarly to γH2AX (Fig. 3C and Supplementary Fig. 3F). As controls, both total and phosphorylated forms of RNAPII were absent in intergenic regions and present in coding and promoter-proximal regions of the beta-actin gene (Supplementary Fig. 3G-I). RNAPII accumulation was detected by ChIP also at an endogenous locus cut by I-PpoI in HeLa cells (Fig. 3D, Supplementary Fig. 3J).
Figure 3. Active RNAPII is recruited to DSBs in mammalian cells and in cell extracts.

(A) Detection of γH2AX and RNAPII pSer5 at the DNA damage locus on chromatin spreads by super-resolution microscopy. Representative super-resolution images of chromatin fibers (green), LacR (red), γH2AX (blue) and RNAPII pSer5 (purple) in uncut and cut NIH2/4 cells. The yellow-boxed images correspond to the yellow-boxed inset region. Scale bar 500 nm. (B) The bar plot is the quantification of (A) and represents the percentage of cells showing γH2AX and active RNAPII pSer5 co-localizing with LacR by super-resolution microscopy on chromatin spreads in uncut and cut conditions. Data are shown as mean. Error bars indicate SEM (n=3 independent experiments, ≥20 images per sample per experiment). (C) Accumulation of RNAPII at the damaged locus by ChIP in uncut and cut NIH2/4 cells. Bar plot shows the percentage of enrichment relative to the input of RNAPII, RNAPII pSer5 and RNAPII pSer2 associated with genomic DNA, as detected with primers matching Lac sequences flanking the I-SceI-induced DSB. Data are shown as one representative of 3 independent experiments. (D) Bar plot shows the percentage of enrichment relative to the input of γH2AX and total RNAPII at the endogenous DAB1 locus by ChIP in HeLa cells cut by I-PpoI. Data are shown as one representative of 3 independent experiments. (E) Biotinylated DNA immobilized on streptavidin beads was either cut or not cut by recombinant I-SceI enzyme in vitro and incubated with nuclear cell extract. Input and pull-down samples were probed for total RNAPII. Below, an agarose gel shows equal amounts of uncut or cut DNA employed. This experiment was repeated 3 times independently with similar results. P value was calculated using two-tailed t-test. *P<0.05. Statistical source data are provided in Supplementary Table 4. Unprocessed original blots are shown in Supplementary Figure 9.
To test whether the RNAPII complex has the ability to recognize DNA double-stranded ends, a biotinylated DNA fragment was immobilized on streptavidin beads in its intact form or cut by I-SceI, and incubated with nuclear extracts. We observed total and phosphorylated RNAPII associated only to DNA bearing free ends (Fig. 3E and Supplementary Fig. 3K).
Taken together, these results indicate that transcribing RNAPII can be detected at DSBs by imaging and ChIP and that it has an affinity for double-stranded DNA ends.
DSBs induce bidirectional transcription by RNAPII in cell-free extracts
Next, we characterized dilncRNA synthesis in transcription-competent human cell extracts containing a plasmid bearing an I-SceI recognition site and [α32P]UTP. Consistent with the lack of eukaryotic transcriptional promoters in the plasmid, no discrete products were detected when the circular plasmid was incubated with cell extracts (Fig. 4A and Supplementary 4A-C). By contrast, discrete products were detected when a DSB was introduced by recombinant I-SceI. Similar results were obtained with other plasmids linearized with various restriction enzymes, generating DNA ends of different sequence and structure (Supplementary Fig. 4D-F). The observed products were DNaseI resistant, RNaseA sensitive (Fig. 4A) and prevented by the RNAPII inhibitor AM (Fig. 4B). Also in this system, dilncRNA generation was independent from ATM (Supplementary Fig. 4G, H) and other PI3K-like kinases (Supplementary Fig. 4I-L).
Figure 4. DSBs induce bidirectional transcription in cell-free extracts.

(A) Transcriptionally competent human cell-free extracts (CFE, “+” and “-” indicate active or heat-inactivated CFE, respectively) were incubated with a circular or I-SceI-linearized form of pLac-Tet plasmid in the presence of [α-32P]UTP. Where indicated, products were treated with increasing amounts of DNaseI or RNaseA. Products were resolved on a denaturing PAGE, along with a radiolabeled DNA ladder (M, nt indicates nucleotides). This experiment was repeated 3 times independently with similar results. (B) In the same settings described in (A), AM reduces DSB-induced transcription. This experiment was repeated 3 times independently with similar results. (C) Ion Proton sequencer was used to perform deep sequencing of RNA products generated in (A). From the outer to the inner circles, plots display the entire plasmid (brown, 2834 bp with ticks showing 100 bp intervals), the coverage of forward reads (blue, maximum value of the distribution is set to 1300) and reverse reads (red, maximum value of the distribution is set to 8000) for each nucleotide position of both circular and linearized plasmids. (D) Individual 5’ RACE clones (in blue forward, in red reverse) are aligned to the sequence of the DNA substrate used. The site of DSB generation is indicated by the dashed line. Unprocessed original scans of radioactive blots are shown in Supplementary Figure 9.
Deep-sequencing of these RNA products showed a clear pattern of robust divergent bidirectional RNA synthesis originating from the DSB (Fig. 4C). Mapping of the transcription start site by 5’ rapid amplification of cDNA ends (5’ RACE) indicated that transcription starts at or within a few nucleotides from the DNA end (Fig. 4D). Thus, also in a cell-free system, DSBs trigger the bidirectional synthesis of RNAPII-dependent transcripts originating from the DSB.
MRN and RNAPII interact upon DNA damage in mammalian cells
The MRN complex is a primary sensor of DSBs and thus a plausible mediator of RNAPII activity at DSBs. To investigate the potential interaction between MRN and RNAPII, we individually immunoprecipitated the three subunits of the MRN complex from untreated or irradiated cells and probed for RNAPII and its phosphorylated forms. Both total and phosphorylated RNAPII were robustly detected interacting with MRN in extracts from irradiated cells (Fig. 5A).
Figure 5. The MRN complex binds to RNAPII upon DNA damage and it is necessary for RNAPII transcription at DSBs in mammalian cells.

(A) Co-immunoprecipitation of RNAPII and its phosphorylated forms with the MRN complex upon IR. HEK293T cells were irradiated (+IR) or not (-IR) and samples were collected 10 minutes post IR, followed by immunoprecipitation of the individual components of the MRN complex. Whole cell extract (WCE) and immunoprecipitated samples were analysed by immunoblotting. Mouse (IgG(M)) or rabbit (IgG(R)) immunoglobulins were used as control. This experiment was repeated twice independently with similar results. (B) DSB-induced transcription is dependent on MRN. The bar plot shows the mean relative enrichment of the indicated RNA sets by strand-specific RT-qPCR in cut NIH2/4 cells knocked-down for the three components of the MRN complex (siMRN) or in siLuciferase (siLuc) transfected cells as control. Uncut sample of each RNA set was used as reference. Error bars indicate SEM (for Lac-from n=4, for Tet-from n=3 independent experiments). (C) DSB-induced transcription is reduced by the MRN inhibitor Mirin. The bar plot shows the mean relative enrichment of the indicated RNA sets by strand specific RT-qPCR in NIH2/4 cell treated with Mirin or DMSO as control 2h before cut induction. Uncut sample of each RNA set was used as reference. Error bars indicate SEM (for Lac-from n=3, for Tet-from n=4 independent experiments). (D) Relative intensity of the indicated smFISH probes at the uncut or cut locus, in DMSO or Mirin-treated samples. Dots represent individual cells. The black bar represents the mean ± SEM (data are shown as pool of n=3 independent experiments). (E) Accumulation of active RNAPII at the damaged locus by ChIP in cut NIH2/4 cells is reduced by Mirin. The bar plot shows the percentage of enrichment relative to the input of total RNAPII, RNAPII pSer5 and RNAPII pSer2 associated with genomic DNA as detected by primers matching Lac sequences flanking the I-SceI-induced DSB. Data are shown as one representative of 2 independent experiments. P values were calculated using two-tailed t-test. ****P<0.0001. Statistical source data are provided in Supplementary Table 4. Unprocessed original blots are shown in Supplementary Figure 9.
When we knocked-down MRN in NIH2/4 we observed a reduction of dilncRNA induction upon I-SceI cut (Fig. 5B and Supplementary Fig. 5A). Similar results were obtained by RT-qPCR and smFISH with the MRN inhibitor Mirin34 (Fig. 5C, D). Impaired dilncRNA synthesis in absence of a functional MRN was the consequence of a reduced RNAPII association with DSBs as demonstrated by ChIP experiments (Fig. 5E) and imaging (Supplementary Fig. 5B, C).
Taken together, these results show that MRN interacts with RNAPII upon DNA damage and suggest a role for MRN in RNAPII recruitment and activity at DSBs.
RNAPII activity is necessary for DDR focus formation and DNA repair and 53BP1 interacts with DDRNA and dilncRNA
We next sought evidence for a role of RNAPII activity in DDR regulation in living cells. We discovered that acute RNAPII inhibition, as achieved by AM, DRB, or ACTD at high doses, prevented DDR activation in the form of 53BP1 and pATM foci at LacR spot, without affecting γH2AX signals (Fig. 6A-C and Supplementary Fig. 5D-I). High-resolution imaging in NIH2/4 microinjected with I-SceI together with AM revealed that RNAPII inhibition abolished nucleation and growth of 53BP1 focus over time (Supplementary Fig. 5J).
Figure 6. RNAPII transcription is necessary for DDR focus formation and DNA repair and 53BP1 interacts with DDRNA and dilncRNA through its Tudor domain.

(A) NIH2/4 cells treated with vehicle or an RNAPII inhibitor (AM in these images) before cut induction. Scale bar 5 μm. (B, C) Quantification of (A) showing the percentage of cells positive for DDR markers co-localizing with LacR in NIH2/4 cells treated with AM, DRB, ACTD or vehicle for 2 h before cut induction. Error bars indicate SEM (n=3 independent experiments, ≥70 cells analysed in total per condition). (D) Representative images of human normal fibroblasts (BJ) treated with vehicle or an RNAPII inhibitor (DRB in these images) before IR. Scale bar 5 μm. Quantification is shown in Supplementary Fig. 6L. (E, F). Percentage of DDR-positive HeLa cells treated with AM, DRB, ACTD or vehicle before IR (cells with >10 foci were considered positive). Error bars indicate SEM (n=3 independent experiments, ≥200 cells analysed in total per condition). (G) Bar plot shows the percentage of γH2AX-positive BJ cells pre-treated with DMSO or DRB for 2 h, irradiated (2 Gy) and fixed at the indicated time points (irradiated cells with >30 foci were considered positive). Error bars indicate SEM (n=3 independent experiments, ≥200 cells analysed in total per condition). (H) Representative images of neutral comet assay at 5 h post irradiation. Scale bar 5 μm. Quantification is shown in I. (I) Scatter plot shows tail moment analysis of neutral comet assay of HeLa cells pre-treated with DMSO or DRB for 2 h, irradiated (5 Gy) and collected at the indicated time points. Dots represent individual cells. Black bars indicate mean. Error bars indicate SEM (data are shown as pool of n=3 independent experiments, ≥100 tails analysed in total per condition). (J, K) Endogenous 53BP1 was immunoprecipitated in cut NIH2/4 cells and RNA bound to it was analysed by small RNA-specific RT-qPCR or strand-specific RT-qPCR. Results are shown as mean fraction of input. Error bars indicate SEM (n=3 independent experiments). (L, M) Constructs expressing GFP, GFP-53BP1 or GFP-53BP1 lacking the Tudor domain (GFP-53BP1ΔTUD) were transfected in NIH2/4 cells expressing I-SceI. Immunoprecipitation with anti-GFP antibody and RNA analysis was performed as in L. Results are shown as mean fraction of input. Error bars indicate SEM (n=3 independent experiments). (B-G) P values were calculated using chi-squared test. (I-M) P values were calculated using two-tailed t-test. *P<0.05, ***P<0.001, ****P<0.0001, ns not significant. Images in A, D and H are representative of 3 independent experiments. Statistical source data are provided in Supplementary Table 4.
RNAPII inhibition impaired 53BP1 and pATM focus formation also induced by ionizing radiation, thus at several different endogenous genomic loci, in HeLa cells and human normal fibroblasts (BJ) (Fig. 6D-F and Supplementary Fig. 6A-L). These brief treatments did not affect 53BP1 and ATM mRNA levels in all cell lines used (Supplementary Fig. 5G, I and 6E, G and J). ChIP-qPCR experiments in BJ expressing AsiSI-ER confirmed impaired 53BP1 accumulation on damaged chromatin in DRB-treated cells, at DSBs generated within or outside a transcriptional unit (genic and intergenic AsiSI, respectively; Supplementary Fig. 7A-F); as expected, γH2AX remained unaffected. RNAPII inhibition also reduced foci of RIF135, pKAP136, RNF16837 and irradiation-induced conjugated ubiquitin signals (Supplementary Fig. 7G-J).
To test the impact of RNAPII inhibition on DNA repair following irradiation, we employed two complementary approaches in different cell lines (BJ and HeLa cells): persistence of γH2AX signal detected by IF and neutral comet assay. We observed impaired DNA repair as indicated by prolonged persistence of γH2AX signal in irradiated DRB-treated cells compared to DMSO (Fig. 6G and Supplementary Fig. 8A) and tail moment analyses of comet assay (Fig. 6H, I and Supplementary Fig. 8B).
53BP1 has been reported to interact with RNA in a manner dependent on its Tudor domain38. We therefore tested by RNA immunoprecipitation assays the ability of 53BP1 to bind to ncRNAs generated at damaged sites. We observed that endogenous DDRNAs and dilncRNAs bind to 53BP1 in NIH2/4 expressing I-SceI and that this binding is specific, since other abundant nuclear small RNAs were not enriched (Fig. 6J, K). To test the role of the Tudor domain, we transfected a GFP-tagged version of the minimal portion of 53BP1 (1220-1631) reportedly sufficient to drive its localization to DNA damage foci39, or the same portion deleted for the Tudor domain (ΔTUD). We observed that this GFP-53BP1 minimal construct interacts with both DDRNAs and dilncRNAs in a specific manner and that the deletion of the Tudor domain completely abolishes such interactions (Fig. 6L, M).
Collectively, our results demonstrate that RNAPII transcription is necessary for DDR focus formation and DNA repair and that 53BP1 associates with DDRNA and dilncRNA.
Sequence-specific DDR and DNA repair inhibition by antisense oligonucleotides
Given the evidence of sequence-specific pairing between DDRNAs and dilncRNAs, we reasoned that DDR activation could be inhibited at individual genomic sites by the use of sequence-specific antisense oligonucleotides (ASOs), blocking DDRNA:dilncRNA interaction. We therefore designed four ASOs against dilncRNAs and DDRNAs containing Lac or Tet sequences (Fig. 7A) or control. To demonstrate that ASOs indeed disrupt DDRNA:dilncRNA interactions, NIH2/4 expressing I-SceI were transfected with individual ASOs against Lac sequences or a control ASO prior to transfection of biotinylated DDRNA or let7a as control. By RNA pull-down assay performed as in Fig. 2I, we observed that DDRNA:dilncRNA interactions were significantly reduced by sequence-specific ASOs only (Fig. 7B).
Figure 7. ASOs preventing DDRNA:dilncRNA interactions affects 53BP1 focus formation.

(A) Schematic representation of ASOs (red) preventing the interaction between dilncRNAs (light blue) and DDRNAs (dark blue), originating from Lac or Tet sequences flanking the I-SceI site in NIH2/4 cells. For graphic clarity dilncRNA-from, but not the dilncRNA-to and the corresponding complementary DDRNA, are shown. (B) NIH2/4 expressing I-SceI were transfected with control ASO (CTL) or specific ASOs matching Lac sequences (ASOs C, D) and subsequently with biotinylated DDRNA (btn-L1) or a biotinylated miRNA (btn-let-7a). After cut induction, RNA pulled-down was performed. Bar plot shows the fold change of dilncRNA (Lac-from) levels, assessed by strand-specific RT-qPCR as relative to input, with respect to control levels (CTL ASO + btn-L1). Values are expressed as mean. Error bars indicate SEM (n=3 independent experiments). (C) Representative images of cut NIH2/4 cells transfected with control or specific ASOs and probed for γH2AX and 53BP1. White circles mark LacR spot. Scale bar 5 μm. (D) Bar plot is the quantification of (C) and shows the percentage of cut NIH2/4 cells positive for LacR co-localization with γH2AX and 53BP1 in the presence of different sets of ASOs. ASO with a sequence unrelated to the locus (CTL) or pre-annealed (INACTIVE) ASOs were used as control. Error bars indicate SEM (n=3 independent experiments, ≥100 cells analysed in total per condition). (B) P values were calculated using two-tailed t-test. (D) P values were calculated using chi-squared test. **P<0.01, ***P<0.001, ****P<0.0001, ns not significant. Statistical source data are provided in Supplementary Table 4.
Then, to study DDR, four different combinations of two ASOs were transfected into cut NIH2/4 in order to inhibit RNAs originating from both sides of the DSB. Remarkably, 53BP1 accumulation at the locus was significantly reduced upon transfection of all sequence-specific ASOs tested, compared to control ASOs or mock transfection, while γH2AX was still present (Fig. 7C, D and Supplementary Fig. 8C). Transfection of ASO:ASO complementary duplexes, thus with no RNA binding potential, did not alter 53BP1 focus formation (Fig. 7D and Supplementary Fig. 8C). Irradiation-induced DDR foci were unaffected by ASOs in the same cells (Supplementary Fig. 8D).
We next aimed to selectively inhibit DDR at a specific damaged genomic locus, while leaving DDR activity unperturbed at other damaged sites within the same nucleus. To this end, we used NIH3T3duo cells28, bearing Lac-ISceI and Tet-ISceI-Tet loci integrated in different genomic sites and expressing GFP-LacR and Cherry-TetR. Co-transfection of I-SceI expressing vector with two individual ASOs matching only Tet sequences (Supplementary Fig. 8E) or a control ASO did not significantly affect γH2AX foci at both Tet-containing and Lac-containing cut loci (Fig. 8A, B). Strikingly, the two Tet-specific ASOs impaired DDR activation, as monitored by 53BP1 focus formation, at Tet loci only, while leaving DDR activation at Lac sites within the same nucleus unaffected (Fig. 8A, B).
Figure 8. Site-specific inhibition of 53BP1 focus formation and DNA repair by ASOs.

(A) Representative images of cut NIH3T3duo cells transfected with control or Tet-specific ASOs and probed for γH2AX and 53BP1. Red circles mark TetR dots, green circles mark LacR dots. Scale bar 5 μm. (B) Bar plots are the quantification of (A) and show the percentage of TetR or LacR co-localization with γH2AX and 53BP1 in the presence of control (CTL) or Tet-specific ASOs. Error bars indicate SEM (n=3 independent experiments, ≥150 Tet loci and ≥70 Lac loci analysed in total per condition). (C) Schematic representation of the sets of ASOs (red) preventing the interaction between dilncRNAs (light blue) and DDRNAs (dark blue) originating from the DSB in the DAB1 locus in HeLa cells cut by I-PpoI, and primers used for RT–qPCR (black). For graphic clarity dilncRNA-from, but not the dilncRNA-to and the corresponding complementary DDRNA, are shown. (D) HeLa cells expressing inducible I-PpoI were transfected with control (CTL ASO) or specific ASOs targeting RNA molecules originated from the DSB within the endogenous DAB1 locus. Bar plot shows the mean fold change normalized to uncut CTL ASO of enrichment relative to input of 53BP1 at the DAB1 locus at 50, 1000 bp from DSB. Error bars indicate SEM (n=3 independent experiments). (E) NIH2/4 cells expressing inducible I-SceI were transfected with specific ASOs or CTL ASO. I-SceI ON: 3 h after induction, I-SceI OFF: 24 h after removal of inducing agent. Bar plot shows the percentage of cells positive for γH2AX-TetR co-localization. Error bars indicate SEM (n=4 independent experiments, ≥80 cells analysed in total per condition). (F) MRN recruits RNAPII at the DSB triggering the bidirectional synthesis of dilncRNA-from (blue) and, less abundantly, of dilncRNA-to (light blue). DROSHA and DICER process the long double-stranded RNA, likely the outcome of paired or folded dilncRNAs, generating DDRNAs which pair with nascent unprocessed single-stranded dilncRNAs; together they bind to 53BP1 and fuel DDR focus formation. Interfering with dilncRNA:DDRNA interactions through ASOs allows site-specific inhibition of DDR. (B, E) P values were calculated using chi-squared test. (D) P values were calculated using two-tailed t-test. *P<0.05, ***P<0.001, ****P<0.0001. Statistical source data are provided in Supplementary Table 4.
To extend these conclusions to endogenous sites, we transfected ASOs targeting DDRNAs and dilncRNAs originating from a DSB generated by I-PpoI in HeLa cells (Fig. 8C) in two different combinations. ChIP-qPCR demonstrated that 53BP1 enrichment was significantly reduced near the DSB (50 bp) and away from it (1000 bp) upon transfection of both sets of sequence-specific ASOs, compared to control ASO, while γH2AX accumulation was not (Fig. 8D and Supplementary Fig. 8F, G). 53BP1 enrichment at a different I-PpoI cut site29 was not affected by these ASO (Supplementary Fig. 8H) and an unrelated genomic locus on chromosome 22 not cut by I-PpoI remained unperturbed (Supplementary Fig. 8I), confirming the sequence-specificity of the treatments.
Finally, to support a direct role of dilncRNA and DDRNA in DSB repair, we transfected NIH2/4 expressing inducible I-SceI with control ASO or sequence-specific ASOs (as in Fig. 7D). After cut induction (I-SceI ON), the inducing agent was removed and DNA repair was allowed for 24 hours (I-SceI OFF). By monitoring γH2AX persistence at the I-SceI cut locus, we observed that ASOs targeting DDRNAs and dilncRNAs at the locus indeed impaired DNA repair in a sequence-dependent manner (Fig. 8E).
Our results demonstrate that it is possible to modulate DDR activation and DNA repair in a sequence-specific manner by inhibiting the RNA species generated at a damaged locus, without affecting on-going DDR signalling at other damaged sites even within the same cell.
Discussion
According to the current model, each DDR focus in a cell nucleus is similar in composition to any other one, sharing a largely overlapping set of DDR protein factors. No components have so far been demonstrated to individually mark DDR events at distinct genomic loci. Here we have shown that each DDR focus, while composed of a common set of shared proteins, also hosts a unique set of ncRNA molecules generated in situ, essential for DDR focus formation. Our results are consistent with a model in which DSBs trigger the generation of dilncRNAs divergent from and convergent to DNA ends, with the potential to form a double-stranded RNA which is processed by DROSHA and DICER to generate DDRNAs (Fig. 8F). Indeed, mammalian DICER has been recently reported to be phosphorylated upon DNA damage and to associate with DSBs40. DDRNAs localize to the damaged locus through base-pairing with unprocessed dilncRNAs emerging from the DSB and concur to activate DDR (Fig. 8F). These events are reminiscent of those at the centromeric locus in Schizosaccharomyces pombe, where small RNAs generated by Dicer bind to a nascent transcript that is also their precursor and together maintain the epigenetic and genetic stability of the locus41. The proposed model fits with the growing list of small ncRNAs interacting with and regulating long ncRNAs42 and, more in general, with the emerging interplay between DSB and transcriptional control43.
Our observations indicate that DNA ends act as transcriptional promoters, regardless of the genomic location. Indeed, dilncRNAs can be generated within canonical genes as well as in intergenic regions. Transcription induced from the DSB is more robust and, at present, better mechanistically understood than transcription to the DSB; the latter may be the outcome of a generally more permissive environment for transcription at the DNA end, the result of unconventional RNAPII activities or consequent to dilncRNA-from transcription termination44, 45.
Several reports, including our, have shown that DSBs can suppress gene expression46, 47. Nonetheless, RNAPII can be detected within γH2AX domains30, 47, it can accumulate on damaged chromatin48 and binds to some DNA repair factors12. A recent report on the engagement of yeast RNAPII at DSB further supports our conclusions11. Thus, silencing of canonical coding transcription and concomitant de novo induction of non-coding RNA may coexist at damaged sites.
The ability of the MRN complex to sense the DSB, interact with RNAPII and stimulate transcription from DNA ends fits nicely with its apical role in DDR activation. Interestingly, RNAPII binding to MRN components upon DNA damage has been independently observed in a proteomic screen49. Further studies are needed to understand the exact mechanism of MRN and RNAPII interaction, including their potential reciprocal crosstalk and the contribution of other DDR factors.
The observation that 53BP1 associates with DDRNAs and dilncRNAs in a manner dependent on its Tudor domain suggests that one of the mechanisms of recruitment to DSBs of 53BP1, and potentially of other DDR factors, is its ability to interact with in situ generated DDRNAs and dilncRNAs. However, whether this interaction is direct or mediated by other factors is presently unknown. Inhibition by sequence-specific ASOs of 53BP1 localization to damaged chromatin and spreading is in line with the role of Dicer- and Drosha-dependent RNA products in DDR activation, as reported by us and others7, 16–18, 40, 50.
Finally, our data using RNAPII inhibitors and ASOs indicate that damage-induced transcription is one of the earliest events following DSB generation, concurring, together with γH2AX, to nucleate DDR focus formation. The ability to modulate DDR and DNA repair with ASOs in a sequence-specific manner may represent a new experimental tool, as well as an attractive therapeutic approach.
Methods
Cell culture, transfection and ionizing radiation
NIH2/4 cells, a NIH3T3-derived cell line bearing the Lac-ISceI-Tet construct20, were grown in DMEM (Lonza), supplemented with 10% fetal bovine serum (FBS) Tetracycline tested, 1% L-glutamine and hygromycin (400μg/mL). NIH3T3duo cells, a NIH3T3-derived cell line bearing one LacO-ISceI and three TetO-ISceI-TetO plasmids28, were grown in DMEM (Lonza), supplemented with 10% FBS Tetracycline tested, 1% L-glutamine, IPTG (5mM) and doxycycline (1μg/mL). To induce LacR and TetR binding, cells were washed extensively in PBS and grown in medium without IPTG and doxycycline.
Where indicated, Cherry-LacR or YFP-TetR (1μg per well) and constitutive I-SceI (2μg per well) expressing vectors (gift from E. Soutoglou) were transfected in NIH2/4 cells by Lipofectamine 2000 according to the manufacturer’s protocol (Life Technologies). To induce YFP-TetR binding to the TetO array, doxycycline (1μg/mL) was added to the culture medium for at least 3h. GFP-LacR plasmid was created by ligating the LacR insert into the BspEI-BamHI sites of a pEGFP-C1 (Clontech) plasmid. The LacR insert was originally obtained from the Cherry-LacR plasmid via a BspEI-BamHI double digestion.
For microinjection experiments, 1x10⁵ cells were seeded onto delta-T dishes (Bioptechs) one day before microinjection, so that they were ~80% confluent at the time of microinjection. Regular medium was replaced with a minimal medium (HBS) without serum, but containing 20mM HEPES-KOH pH 7.4, 135mM NaCl, 5mM KCl, 1mM MgCl2, 1.8mM CaCl2 and 5.6mM glucose, immediately before microinjection. After microinjection, cells were incubated in phenol red-free DMEM containing 10% (v/v) FBS in the presence of a 5% CO2 at 37°C for the indicated amounts of time prior to imaging. For plasmid co-transfections, 250-1000ng of GFP-LacR and/or Cherry-53BP1 (19835, Addgene) and 750ng of pLacZ (uncut), constitutive I-SceI expression vector (cut) or inducible I-SceI-GR-RFP (17654, Addgene) expression vector (cut) were mixed with 2.5 µL of Lipofectamine2000 per DeltaT dish. Plasmids and Lipofectamine were diluted in 100 µL of OptiMEM (GIBCO) each and added to 1mL of media in the dish. Cells were used for experiments 24h post transfection.
Where indicated, 1μg of mammalian RNase-H1 expressing plasmid (gift from A. Aguilera) or an empty vector control were co-transfected with YFP-TetR and I-SceI expressing vectors in NIH2/4 cells.
U2OS19ptight26 were grown in DMEM without phenol red (GIBCO), supplemented with 10% FBS Tetracycline tested, 1% L-glutamine and G418 (800μg/mL). To induce I-SceI expression, cells were incubated with doxycycline (1μg/mL) for 16h.
AsiSI-ER-U20S cells30 were cultured in Dulbecco’s modified Eagle’s medium (DMEM) w/o phenol red supplemented with glutamine, pyruvate, HEPES and 10% FBS (Euroclone). Cells were selected with puromycin at a final concentration of 1μg/ml. For AsiSI-dependent DSB induction, cells were treated with 300nM 4-OHT (Sigma-Aldrich) for 4 h.
BJ hTERT Hygro (ATCC, BJ-5Ta) HA-AsiSI-ER were grown in DMEM w/o phenol red supplemented with 10% fetal bovine serum (FBS), 1% L-Glutamine, 20% M199, hygromycin (10μg/ml) and puromycin (1μg/ml). To generate AsiSI-ER BJ-5Ta cell line, pBABE HA–AsiSI–ER plasmid (gift from G. Legube) was retroviral infected using a standard calcium phosphate transfection/infection protocol (1:8 virus dilution used). The selection was performed using 2μg/mL puromycin. For AsiSI-ER induction, cells were treated with 300nM 4-OHT (Sigma-Aldrich) over night.
HeLa cells and HeLa111 cells, a HeLa-derived cell line bearing one LacO-ISceI plasmid27, were grown under standard tissue culture conditions (37°C, 5% CO2) in MEM+Glutamax (GIBCO), supplemented with 10% FBS, 1% non-essential amino acids, 1% sodium pyruvate. Where indicated, 1μg of mammalian ER-I-PpoI expressing plasmid (gift from M. Kastan) or an empty vector control were transfected in HeLa cells, grown in their medium w/o phenol red. 24h later, to activate the nuclear translocation of ER-I-PpoI, cells were treated with 4-OHT (Sigma-Aldrich) at 2μM final concentration for 3h. Where indicated, 1μg of CRISPR/Cas9 expressing plasmid (gift from B. Amati) or an empty vector control were transfected in NIH2/4 cells. RNA was collected 24h later. See Supplementary Table 2 for the sequence of the guide RNA.
Human normal foreskin fibroblast (BJ, ATCC) were grown in MEM+Glutamax (GIBCO), supplemented with 10% FBS, 1% non-essential amino acids, 1% sodium pyruvate.
mESCs ATM+/+ and ATM-/- (gift from Y. Xu) grown in stem cell media (DMEM glutamax, 1% non-essential amino acids, 1% sodium pyruvate, 0.2% 2-mercaptoethanol, 15% FCS and 0.2% LIF) on gelatin-coated plates.
Ionizing radiation (IR, 2Gy where not specified differently) was induced by a high-voltage X-rays generator tube (Faxitron X-Ray Corporation). For the analysis of DDR markers, cells were fixed at 10 min or 1h post IR.
Antibodies
Primary antibodies for immunofluorescence: γH2AX pS139 (mouse, Millipore 05-636, 1:1000); ATM pS1981 (mouse, Rockland 200-301-400, 1:400); 53BP1 (rabbit, Novus Biologicals NB100-304, 1:1000); RNAPII pSer5 (rabbit, Abcam ab5131, 1:500); RNaseH1 (rabbit, Proteintech 15606-1-AP, 1:200); RIF1 (rabbit, Bethyl A300-569A, 1:1000), pKAP1 (rabbit, Bethyl A300-767A, 1:1000), RNF168 (rabbit, Millipore Abe367, 1:500), mono- and polyubiquitinylated conjugates monoclonal antibody (FK2, Enzo life sciences BML-PW8810-0100, 1:1000). Secondary antibodies for immunofluorescence: donkey anti-mouse or anti-rabbit Alexa 405 (1:200), Alexa 488 (1:500) or Alexa 647 (1:500) IgG (Life Technologies) or goat anti-mouse or anti-rabbit Cy5 (Jackson Immunoresearch). The following antibodies were used for ChIP: RNAPII N-20 (rabbit, SantaCruz, sc899x, 2μg) four mouse cells; total RNAPII (mouse, Abcam, ab817, 5μg); RNAPII pSer2 (rabbit, Abcam ab5095, 2μg) for human cells; RNAPII pSer5 (rabbit, Abcam ab5131, 2μg); γH2AX pS139 (rabbit, Abcam ab2893, 2μg); 53BP1 (rabbit, Novus Biologicals NB100-305, 3μg). Primary antibodies for immunoprecipitation and western blot: RNAPII (POLR2A) (mouse, Santa Cruz 8WG16, IP: 5 μg/1mg of total proteins, WB: 1:50); MRE11 (rabbit polyclonal raised against recombinant human MRE11, gift from S. P. Jackson. Validation data using MRE11-deficient cells or purified recombinant MRN are available upon request. IP: 1 μg/1mg of total proteins, WB: 1:000); NBS1 (rabbit, Novus Biologicals NB100-143 IP: 1 μg/1mg of total proteins, WB: 1:000); RAD50 (Millipore (13B3/2C6) 05-525 IP: 1 μg/1mg of total proteins, WB: 1:000); RNAPII pSer2 (rabbit, Abcam ab5095 WB: 1:1000); RNAPII pSer5 (rabbit, Abcam ab5131 WB: 1:1000).
Lentiviral infection
Lentiviral empty vector was obtained by removing the I-SceI-BFP cassette between XhoI and XbaI sites from the lentiviral backbone pCVL-HA-NLS-ISceI-BFP (45574, Addgene). Lentiviral I-SceI-GR (which is the inducible I-SceI in the main text) was obtained by PCR amplification of the I-SceI-GR cassette (17654, Addgene) with adapter primers containing XhoI-XbaI sites and subsequent cloning into the lentiviral empty vector. Where indicated, target cells (NIH2/4, NIH3T3duo and HeLa111 cells for dilncRNA induction experiments) were incubated with viral supernatant diluted 1:4 in medium supplemented with 8μg/mL polybrene for 16h. Three days post infection, I-SceI-GR translocation to the nucleus was induced by adding Triamcinolone Acetonide 0.1μM (TA, Sigma-Aldrich) to the medium for 1h.
RNA extraction
Total RNA was isolated from cells using either RNAeasy kit (Qiagen) or Maxwell® RSC simplyRNA Tissue Kit (Promega), according to the manufacturer’s instructions. Where specified, chromatin-bound RNA was extracted as follows. Cells were fractionated following a published protocol51. After recovery of the chromatin fraction, 50 U of Turbo DNase (Ambion) was added to the pellet and incubated at 37°C for 10 min, following by digestion with 200μg of Proteinase K (Roche) at 37°C for 10 min. The RNA was then purified with phenol-chloroform and isolated as the total RNA.
For gel-extraction experiments, total RNA was purified using the Maxwell® miRNA Tissue Kit with the Maxwell® RSC Instrument (Promega) and loaded onto 10% Urea-PAGE. For gel-extracted small RNA analysis, a C. elegans miRNA was used as spike-in before loading.
Standard RT-qPCR and strand-specific RT-qPCR
For standard RT-qPCR, cDNA was generated using the SuperScript® VILO™ Reverse Transcriptase (Life Technologies). Roche SYBR Green-based RT-qPCR experiments were performed on a Roche LightCycler 480.
For DSB-induced transcripts detection, total RNA was extracted using RNeasy RNA extraction kit (Qiagen). Samples were treated with DNaseI (Qiagen) to remove any potential residual genomic DNA contamination. 500ng of total RNA were reverse-transcribed using the Superscript First Strand cDNA synthesis kit (Invitrogen) with strand-specific primers. Expression of DSB-induced transcripts was determined by RT-qPCR using Roche SYBR green, EvaGreen® Supermix (Bio-Rad) or QuantiTect SYBR (Qiagen) reagents. For each RT-qPCR reaction, 25ng of cDNA were used. To amplify Lac and Tet repeats we adapted a technique, as previously described52.
For DDRNA and pre-DDRNA detection, gel-extracted RNA fractions were retro-transcribed using miScript II RT Kit (Qiagen), according to the manufacturer’s instructions. For gel-extracted DDRNA analysis, the spike-in was used as normalizer. For gel-extracted pre-DDRNA analysis, 5S ribosomal RNA was used as normalizer.
See Supplementary Table 1 for a complete list of primers used.
Single molecule fluorescence in situ hybridization (smFISH)
NIH2/4 cells were transfected with LacR-GFP and I-SceI-GR-RFP expressing plasmids and incubated for 24h. Nuclear translocation of I-SceI-GR-RFP was induced by treating cells with 0.1µM TA (cut) or ethanol (uncut) for 1h. When mentioned, cells were treated with DRB (100µM) or DMSO for 2h prior to induction and during induction. When mentioned, cells were treated with Mirin (100µM) or DMSO for 30 min prior to induction and during induction. When mentioned, cells were RNaseA treated (1µg/µL) in DPBS at 37°C, prior to probe treatment. smFISH was performed as described18. When mentioned, cells were RNaseH treated (1µg/µL) in DPBS at 37°C, prior to mounting. Images were analysed using custom-written macros in ImageJ and Imaris.
See Supplementary Table 1 for FISH probe sequences.
Inhibition of RNA transcription
Actinomycin D (ACTD) at low dose (0.05μg/mL) is a specific inhibitor of RNAPI; ACTD at high dose (2μg/mL), α-amanitin (50μg/mL) are specific inhibitors of RNAPII; 5,6-dichloro-1-β-D-ribofuranosylbenzimidazole (DRB, 100μM) is a specific inhibitor of RNAPII elongation. ACTD and DRB were dissolved in DMSO; α-amanitin was dissolved in deionized water. For α-amanitin treatments, cells were mildly permeabilized by 0.6% (NIH2/4 cells) or 2% (HeLa and BJ cells) Tween20 in PBS for 10 min at room temperature (RT). Permeabilized cells were then incubated in OptiMEM medium with α-amanitin at 37°C for the indicated time before DNA damage induction. Specificity and efficacy of the drugs were monitored by analysing by RT-qPCR the levels of known short-lived RNAs that are specifically transcribed by one of the different RNA polymerases: 47S RNA (ribosomal RNA precursor) for RNAPI; c-fos RNA for RNAPII; 7SK RNA for RNAPIII. Unless specify differently, cells were pre-treated with RNAPII inhibitors for 2h before DNA damage and analysed 1h later. For DNA repair experiment, BJ cells were pre-treated with DRB 100μM for 2h, irradiated (2Gy) and analysed at 1h and 5h post irradiation.
Nuclei isolation, immunostaining, confocal imaging and image analysis
NIH2/4 cells were transfected with a constitutively active I-SceI or an empty vector. Cells were fixed and treated with 4% Triton-X in TM2 buffer33 with 1X protease inhibitor cocktail to remove cytoplasm. Isolated nuclei were incubated in 5% BSA, followed by incubation with primary and secondary antibodies. Nuclei were labelled with YOYO-1 followed by hypotonic treatment. Samples were imaged on Nikon A1R using 100X, 1.4 NA oil objective, 3X magnification, and z-step of 500nM. Enrichment index was defined as the ratio between the mean intensity of γH2AX or RNAPII pSer5 at the LacR spot and the mean intensity of γH2AX or RNAPII pSer5 throughout the 3D nuclear region.
Chromatin spreads preparation, immunostaining, super-resolution imaging and imaging analysis
After NIH2/4 cells were fixed and quenched, cells were treated with Trypsin (GIBCO) and re-suspended with culture medium. Chromatin spreads were prepared according to the methods previously described33. Super-resolution imaging was performed on a Zeiss Elyra P.1 microscope equipped with an oil-immersion objective, and images were analysed according to the procedures previously described33.
Chromatin Immunoprecipitation (ChIP)
NIH2/4 cells expressing the inducible I-SceI were induced or mock induced for 1h before crosslinking. For the experiment with the MRN inhibitor, NIH2/4 cells expressing the inducible I-SceI were treated with Mirin (100µM) or DMSO for 2h prior the induction and during I-SceI induction. AsiSI-ER BJ-5Ta cells were treated with 300nM 4-OHT over night and treated with DRB or DMSO for 3h before crosslinking. HeLa cells transfected with I-PpoI-ER and ASOs (see “Antisense oligonucleotides” section) and 24h later treated with 2μM 4-OHT for 3h before crosslinking. ChIP was performed as described47. ChIP in Hela cells cut by I-PpoI was performed as described53. Briefly, cells were crosslinked in 1% PFA and sonicated with Bioruptor sonicator to obtain 250bp resolution. 100μg of chromatin was used per sample.
Immunoprecipitation
HEK293 cells irradiated (4 Gy) or not irradiated were collected 10 min post IR and washed in 1xTBS (ice-cold) and resuspended in 0.5mL of lysis buffer [50mM Tris, pH7.5; 150mM NaCl; 0.5% NP-40; 5mM MgCl2; 5% glycerol; 1X Protease inhibitors (Roche tablet); 1X phosphatase inhibitors tablet (Roche)] supplemented with 1μL per 1mL Benzonase (250 units/mL, Sigma). Lysates were incubated at 4°C for 45 min. Lysates were cleared and equal amount of total protein extracts were used for each sample and primary antibody, pre-incubated with G dynabeads (Invitrogen), was added and left at 4°C on a wheel for further 2h. The beads were gently collected using a magnet rack (Invitrogen) and washed 6 times with 1X lysis buffer and resuspended in 50μL of sample loading buffer (Invitrogen).
In vitro RNAPII binding to DNA ends
HeLA nuclear extract were prepared according to modified Dignam protocol54.
Biotinylated primers were used to PCR amplify the DNA fragment containing I-SceI and Lac and Tet repeats from the pLac-Tet plasmid containing an I-SceI site flanked by 3 Tet and 8 Lac elements into the pMK-RQ vector (GENEART). The PCR fragment was then purified by ReverseQ column binding and eluted by salt gradient. 1μg of the correct fragment was incubated in I-SceI NEB buffer with 5μL of streptavidin magnetic beads (Invitrogen) at RT for 30 min, subsequently at 37°C for 1h in presence of 1μL I-SceI enzyme (NEB). Magnetic beads were then washed 3X in cold 1X TBS and then incubated at 16°C with HeLa cells nuclear extract for 1h. After 3 washes in cold TBS, beads were boiled in 2X Invitrogen sample buffer and samples were analysed by western blot. As control for cutting efficiency, 1/10 of beads was collected and incubated with proteinase K; DNA was then recovered by phenol:chloroform:isoamyl alcohol extraction and loaded on an agarose gel. See Supplementary Table 1 for the complete list of primers used.
In vitro transcription assay
In vitro transcription was performed using cell-free extracts from K562 cell line54. 2µg of cell-free extracts were incubated with 200ng of linearized plasmid prepared by digesting the pLac-Tet plasmid (GENEART) with I-SceI, in a buffer containing 20mM HEPES [pH 7.5], 3mM MgCl2, 100mM KCl, 0.2mM EDTA, 0.5mM DTT, 20% glycerol, 0.4mM rATP, rCTP, rGTP each and 10 µCi [α-32P]UTP for 1h at 37°C in a total reaction volume of 25 µL. The reaction was stopped by the addition of 0.3M Tris-HCl [pH 7.4 at 25°C], 0.3M sodium acetate, 0.5% SDS, 2mM EDTA and 3µg/mL glycogen, purified by phenol-chloroform extraction and precipitated. Dried pellets were resuspended in RNase-free water and, when mentioned, incubated with increasing concentrations of RNaseA or DNaseI at 37°C for 30 min. Samples were then mixed with an equal volume of gel loading buffer containing 98% formamide, 10mM EDTA, 0.1% xylene cyanol, 0.1% bromophenol blue, heated at 80°C and loaded onto an 8% denaturing PAGE. The gel was dried, exposed to phosphorimaging screen and acquired using Typhoon phosphorimaging system (GE Healthcare).
Plasmids (pBluescript or pUC19) were digested with BamHI, EcoRI, EcoRV, SmaI, KpnI, SacI to generate ends containing 5’-GATC, 5’-AATT, blunt GAT, blunt CCC, GTAC-3’, AGCT-3’, respectively and purified. Transcription was performed as mentioned above.
For the experiments with RNAPII, ATM and PI3K-like kinase inhibitors, 2µg of cell-extracts were incubated with increasing concentrations of the inhibitors in the transcription reaction, incubated on ice for 15 min, shifted to 37°C for 30 min, followed by addition of the linearized pLac-Tet plasmid substrate and incubation for 1h at 37°C. Reaction products were resolved as explained earlier. Cell-free extracts prepared from mESCs ATM+/+ and ATM-/- were prepared as described earlier.
RNA-seq
RNA generated from in vitro transcription with circular and linearized pLac-Tet plasmid was treated with DNaseI and size-selected by gel purification to exclude RNA shorter than 50 bp. After fluorometric quantitation by Qubit (Life Technologies), RNA was used for library preparation with Ion Total RNA-Seq Kit v2 for strand-specific RNA sequencing. The obtained libraries were pooled and sequenced on the Ion PI chip (Life Technologies). Reads were mapped to the pLac-Tet plasmid using Bowtie255 with a very sensitive local option. The coverage of each position was calculated using samtools mpileup56.
Rapid Amplification of cDNA Ends (RACE)
5’ RACE was performed using FirstChoice 5’ RLM-RACE kit (Life Technologies). Briefly, in vitro reaction products from linearized pLac-Tet plasmid with or without extracts were treated with Calf Intestinal Phosphatase (CIP) and Tobacco Acid Pyrophosphatase (TAP), followed by ligation with an adaptor, following the manufacturer’s protocol. The products were reverse transcribed, PCR-amplified using primers (Supplementary Table 1) matching the sequences outside the Lac and Tet repeats, cloned into TA vector (Invitrogen) and sequenced by Sanger method.
RNA oligonucleotides
RNA oligonucleotides were synthesized with a 5’ phosphate and HPLC purified (Integrated DNA Technologies). For fluorophore labelled oligonucleotides, Alexa 647-NHS or Cy5-NHS were conjugated to the 3’ end. Annealing of complementary sequences was performed in a 1:1 ratio in 1X PSB or 1X siRNA buffer (GE Healthcare, Dharmacon). See Supplementary Table 2 for the complete list of RNA oligo used.
Microinjection
Injections were performed as described23. For DDRNA microinjections, the micropipette (Femtotips, Eppendorf) was loaded with 0.125 - 2μM Alexa647 labelled DDRNAs and 0.025 - 0.05% (w/v) 10 kDa cascade blue dextran (Invitrogen) in 1X PBS. For BSA (NEB) or I-SceI (NEB) co-injections, 1µM of the appropriate protein was also added to the solution. Injection solution with these proteins also contained 3mM Tris-HCl pH 7.4, 90mM NaCl, 0.3mM DTT, 0.03mM EDTA and 15% Glycerol. To inhibit transcription, 50µg/mL α-amanitin was co-microinjected with the dsRNAs and proteins. 50ng/µL of pGFP-LacR, pCherry-53BP1 and 100ng/µL of pLacZ, pI-SceI were used in the plasmid injection solutions. Plasmids were diluted in solutions containing 0.025 - 0.05% (w/v) 10 kDa cascade blue dextran (Invitrogen) in 1X PBS. For time-lapse imaging analysis of 53BP1 focus, NIH2/4 cells expressing GFP-LacR and Cherry-53BP1 were microinjected with BSA (1µM), ISceI (1µM) or ISceI (1µM) + α-amanitin (100µg/mL) over a span of 5 min (referred as the 0 min time point) and immediately imaged over a time course spanning 1h at 0 min, 5 min, 15 min, 30 min and 60 min post injection. Image analysis was done using custom written macros in Image-J. The relative intensity was calculated by dividing the integrated intensity of a 50x50 pixel area across the 53BP1 foci (co-localizing with a GFP-LacR focus) by the intensity of a 2 pixel rim around the 50x50 pixel area.
Single-molecule microscopy
Single-molecule microscopy by HILO illumination was performed as described23. For multicolour live cell imaging, the emitted light was split onto two different EMCCDs using a single beamsplitter within a filter adapter (TuCam, Andor). Emission filters were placed just prior to each camera to minimize fluorescence bleed-through. For simultaneous detection of GFP and Cy5, a 585dxcru dichroic, et525/50m, et705/100m emission filters were placed in the Tucam adapter. The et705/100m was replaced with an et630/75m emission filter for simultaneous GFP, RFP detection. Live cell imaging and data analyses were performed as described 21. For fixed cell imaging emission from individual fluorophores were detected one after another on a single EMCCD. Fixed cell imaging and data analysis were performed as described 21 with minor modifications. In traces where the number of steps cannot be accurately determined, the average intensity of the first three frames of the trajectory was divided by that of a single photobleaching step (~2000 A.U.) to deduce the number of molecules per particle.
RNA interference
The siGENOME smart pool siRNA oligonucleotides (Dharmacon) were transfected (20nM) by Lipofectamine RNAiMax (Life Technologies) following the manufacturer’s protocol. 72h later, DNA damage was induced and samples were collected. See Supplementary Table 2 for the complete list of siRNA used.
Permeabilization and incubation with DDRNA
NIH2/4 cells were seeded on coverslips and transfected with YFP-TetR and I-SceI expressing vectors. 24h later cells were permeabilized in 0.6% Tween20 (Euroclone) in sterile 1X PBS for 15 min at RT. After washing in sterile 1X PBS, cells were incubated in 70μL of a solution containing sterile 1X PBS, 80 units of RNase inhibitor (RNaseOUT Life Technologies 40 units/μL) and annealed DDRNA-Cy5 (100nM) or miRNA let-7a-Cy5 (100nM) as control for 30 min at RT. Cells were then fixed in PFA 4%, re-permeabilized in Triton 0.2% for 2 min and stained for DDR markers as described below.
Indirect immunofluorescence and imaging analysis
NIH2/4 and NIH3T3duo cells were fixed in 4% PFA for 10 min at RT. HeLa and BJ cells were fixed in methanol:acetone 1:1 for 2 min at RT or in 4% PFA. For RIF1, FK2 and RNF168 immunofluorescence, BJ cells were pre-extracted in 0.5% Triton for 5 min at 4°C and then washed in 1X PBS and fixed in 4% PFA for 10 min at RT. Immunofluorescence for DDR markers was performed as described16.
Immunofluorescence images of HeLa and BJ cells were acquired in parallel with identical acquisition parameters using widefield Olympus Biosystems Microscope BX71 and the MetaMorph software (Soft Imaging System GmbH). Quantification of the number of nuclear foci per nucleus was performed with the automated image-analysis software CellProfiler 2.1.1. Cells with more than 10 DDR foci were scored positive. For experiments with NIH2/4 and NIH3T3duo cells, image sections were obtained at the Delta Vision microscope (Applied Precision) by acquisition of 30 optical z-sections (0.25μm) at different levels along the optical axis to allow a more accurate signal discrimination and detection of co-localization events. Each image was automatically subjected to deconvolution by the softWoRx software (Applied Precision). The z-sections were then loaded onto ImageJ software and z-projected to obtain a sum of image signals. For experiments with DDRNA-Cy5, cells were considered positive when there was an overlapping signal between DDRNA-Cy5 and YFP-TetR in the z-projection.
RNA pull-down
NIH2/4 cells transduced with I-SceI-GR were transfected with in vitro annealed 3’-end biotinylated DDRNA (btn-L1:L2, btn-U1:U2; see the “RNA oligonucleotides” section for sequence details) or btn-let-7a:let-7a* at the final concentration of 20nM with Lipofectamine RNAiMAX. For the experiment with ASOs and biotinylated DDRNA, NIH2/4 cells transduced with I-SceI-GR were transfected with control ASO or specific ASOs at the final concentration of 20nM by Lipofectamine RNAiMAX. The day after cells were transfected with annealed btn-L1:L2 or btn-let-7a:let-7a* at the final concentration of 20nM by Lipofectamine RNAiMAX. 24h later, cells were treated with TA (0.1nM) for 1h to activate I-SceI and trypsinised. After two washes with cold 1X PBS, cell pellets were resuspended in cell lysis buffer (25mM Tris-HCl pH 7.4, 150mM KCl, 5mM MgCl2, 0.5% NP-40, 0.5mM DTT, 40 U/mL of RNaseOUT and Protease Inhibitor Cocktail Set III (Merck Millipore)) for 30’ at 4°C. Streptavidine beads (Dynabeads MyOne Streptavidin C1, Life Technologies) were blocked in lysis buffer supplemented with 1 mg/mL tRNA and 1 mg/mL BSA (Ambion) for 2h at 4°C. Total cell extracts were cleared by centrifugation, added to the blocked beads and incubated 4h at 4°C. After five washes with lysis buffer, bound RNAs were isolated with proteinase-K (Roche) prior to acid-phenol:chloroform (Life Technologies) extraction and ethanol precipitation. Input RNAs were treated in the same manner. Purified RNAs were treated with DNaseI (Thermo Scientific) and analysed by strand-specific RT-qPCR, as described above.
RNA immunoprecipitation (RIP)
I-SceI-GR expressing NIH2/4 cells were lysed in RIP buffer (150mM KCl, 25mM Tris-HCl pH 7.4, 5 % Glycerol, 0.5 % NP40, 10mM MgCl2, 1mM CaCl2, 0.5mM DTT, 40 U/mL RNaseOUT and Protease Inhibitor Cocktail Set III) in the presence of 1000 UmL-1 DNaseI (Roche). Total cell lysates were cleared by centrifugation and 5mM EDTA was added. Before immunoprecipitation (IP), 10% of lysates was saved as RNA and protein INPUT. 10µg of anti-53BP1 (NB100-304, Novus Biologicals), anti-GFP (ab290, Abcam) or normal rabbit IgGs (sc-2027, Santa Cruz) were coupled with Dynabeads® Protein G (Life Technologies) for 2h at 4°C in RIP buffer prior to IP. IP was carried out by incubating cleared lysates with the antibody-coupled beads overnight at 4°C. After 5 washes with RIP buffer, 10% of IPed samples were eluted in SDS loading buffer for protein analysis. Bound and input RNAs were isolated as described above (see “RNA pull-down” section). DilncRNAs and mRNAs were analysed by qRT-PCR as already described, whereas DDRNAs and small RNAs were analysed using miScript PCR system (Qiagen). See Extended Data Table 1 for the complete list of primers used.
For 53BP1 ectopic expression, NIH2/4 were transfected with GFP-53BP1 (pcDNA-FRT/T0-eGFPnls-53BP1 1220-1631 WT, gift from D. Durocher, Addgene, 6081439) or with GFP-53BP1ΔTUD plasmids. GFP-53BP1ΔTUD construct was generated from GFP-53BP1 plasmid by inverse PCR. See Supplementary Table 1 for primer sequences.
RNaseA treatment
RNaseA treatment was performed as described16. Briefly, NIH2/4 cells expressing I-SceI were permeabilized 1h post DSB induction and treated with RNaseA (1mg/mL) or acetylated BSA (1mg/mL) for 30min at RT. After washes, RNase-treated cells were incubated with tRNA for 30min. RNA was collected and equal volumes were used in strand-specific RT-qPCR.
Comet assay
Neutral comet assay was performed following manufacturer’s instructions (Trevigen). Briefly, HeLa cells were trypsinized, washed once with ice-cold PBS and resuspended in cold PBS at the final concentration of 105 cells per ml. Cell suspension was then combined with pre-warmed low-melting agarose at a ratio of 1:10 and poured onto the slides. Lysis was performed over-night at 4 °C. Electrophoresis was carried out in 1X Neutral Electrophoresis Buffer for 45 min at 21V. After DNA precipitation and wash in 70% ethanol, slides were dried up and DNA stained with SYBR Gold (Thermo-Fisher) before epifluorescence microscopy analysis (Olympus Biosystems). Comet tail moment was calculated using OpenComet software.
Antisense oligonucleotides
Locked nucleic acid ASOs (Exiqon) were co-transfected with Cherry-LacR and I-SceI expressing vectors in NIH2/4 cells by Lipofectamine 2000. ASOs (0.2nM) were first boiled at 90°C for 5 min and immediately transferred into ice for 5 min and then added in different combinations to a transfection mix containing Cherry-LacR and I-SceI expressing vectors. 24h post transfection cells were scored for DDR markers at the LacR locus. For DNA repair experiment, I-SceI-GR translocation to the nucleus by adding TA 0.1nM to the medium for 3h. After extensive washes in PBS, medium was replaced and DNA repair was allowed for 24h.
ASOs (20nM) were co-transfected with I-SceI expressing vector in NIH3T3duo cells by Lipofectamine 2000, as described above. 24h post transfection cells were scored for DDR markers at the LacR and TetR loci. See Supplementary Table 3 for ASO sequences used in NIH2/4 and in NIH3T3duo cells.
Locked nucleic acid ASOs (Exiqon) were co-transfected with I-PpoI expressing vectors in HeLa cells by Lipofectamine 2000. ASOs (20nM final concentration of the pooled ASOs) were first boiled at 90°C for 5 min and immediately transferred into ice for 5 min and then added in different combinations to a transfection mix containing I-PpoI expressing vector. 24h post transfection, ER-I-PpoI was induced by 4-OHT (Sigma-Aldrich) at 2μM final concentration for 3h and samples were collected for ChIP experiments. See Supplementary Table 3 for DAB1-specific ASO sequences.
Statistics and reproducibility
All experiments were performed three or more times independently under similar conditions, except for experiments performed twice shown in Figure 2I (the same observation was independently reproduced in Figure 7D); Figure 5A, E; Supplementary Figures 1I, 3B-D 3G-I, 5F-I, 6E, 6G, 6H-J, 8D, 8H, 8I. Results are shown as mean and the error bars represent the standard error of the mean (SEM), unless stated differently. Representative experiments are shown as mean of technical triplicates. Prism 6 software was used to generate graphs and to perform statistical analysis. P values were calculated by chi-squared test or unpaired two-tailed Student’s t-test as reported in the figure legends. P values of statistical significance are represented as *P<0.05, **P<0.01, ***P<0.001, ****P<0.0001.
Data availability
RNA-seq data are deposited in NCBI GEO (Gene Expression Omnibus) under accession number GSE75512. Statistical source data are shown in Supplementary Table 4. All other data supporting the findings of this study are available from the corresponding author on reasonable request.
Supplementary Material
Acknowledgments
We thank E. Soutoglou (Institut de Génétique et de Biologie Moléculaire et Cellulaire, Strasbourg, France), T. Misteli (National Cancer Institute, Bethesda, USA), G. Legube (Centre de Biologie Intégrative, Toulouse, France), M. Kastan (Duke Cancer Institute, Durham, USA), A. Aguilera, (Centro Andaluz de Biología Molecular y Medicina Regenerativa, Sevilla, Spain), Y. Xu (University of California, San Diego, USA), S. P. Jackson (Gurdon Institute, Cambridge, UK), D. Durocher (The Lunenfeld-Tanenbaum Research Institute, Toronto, Canada), B. Amati (European Institute of Oncology, Milan, Italy), A. Verrecchia (European Institute of Oncology, Milan, Italy), P. Pellanda (European Institute of Oncology, Milan, Italy) for reagents; Single Molecule Analysis in Real-Time Center (University of Michigan, USA) for instruments; M. Bedford (MD Anderson Cancer Center, Texas, USA), C. A. Sagum (MD Anderson Cancer Center, Texas, USA) and M. Roncador (Italian National Research Council, Pavia, Italy) for their help during the revision of the manuscript and all F.d’A.d.F. group members for reading the manuscript, support and constant discussions. F.M. was supported by Fondazione Italiana Ricerca Sul Cancro (FIRC, 12491). S.F. was supported by Collegio Ghislieri and Fondazione Cariplo (Grant rif. 2014-1215). G.V.S. is supported by Mechanobiology Institute (MBI) and Singapore Ministry of Education Academic Research Fund Tier3 (MOE2012-T3-1-001). N.G.W. is supported by NIH grants 2R01 GM062357, 1R01 GM098023 and 1R21 AI109791. F.d’A.d.F. was supported by the Associazione Italiana per la Ricerca sul Cancro, AIRC (application 12971), Human Frontier Science Program (contract RGP 0014/2012), Cariplo Foundation (grant 2010.0818 and 2014-0812), Marie Curie Initial Training Networks (FP7 PEOPLE 2012 ITN (CodAge)), Fondazione Telethon (GGP12059), Association for International Cancer Research (AICR-Worldwide Cancer Research Rif. N. 14-1331), Progetti di Ricerca di Interesse Nazionale (PRIN) 2010–2011, the Italian Ministry of Education Universities and Research EPIGEN Project, an European Research Council advanced grant (322726) and AriSLA (project “DDRNA and ALS”).
F.d’A.d.F., F.M. and S.F. are inventors on the following patent application: PCT/EP2013/059753.
Footnotes
Author contributions
S.P. conceived and performed all microinjection assays, intracellular single-molecule imaging of DDRNA, FISH and kinetics experiments. V.V. generated the lentiviral I-SceI-GR construct, produced strand-specific RT-qPCR data for dilncRNA detection (NIH2/4 cells, NIH3T3duo cells, U2OS19ptight cells, HeLa111 cells, HeLa I-PpoI cells cut in DAB1 gene) and qPCR analyses of ChIP experiments in NIH2/4 and determined dilncRNA polyadenylation status. S.S. performed all in vitro DSB-induced transcription assays and 5’RACE and produced samples for sequencing. U.G. performed the RNA pull-down experiments without ASOs and RIP experiments, performed RT-qPCR analyses of DDRNA and generated the GFP-53BP1ΔTUD construct. M.C. performed ChIP experiments of RNAPII and the phosphorylated forms in NIH2/4 cells and the ChIP in AsiSI-ER BJ-5Ta cells treated with DRB. F.P. performed the in vitro binding assay of RNAPII to DNA ends, the co-immunoprecipitations of RNAPII with MRN and the ChIP of RNAPII in HeLa I-PpoI cells. Y.W. performed confocal and super-resolution analyses of RNAPII localization on damaged chromatin. F.I. conducted bioinformatics analyses of next generation sequencing data. I.C. detected dilncRNA in the AsiSI system. V.M. contributed with technical support. S.F. supervised M.C. and I.C. G.V.S. supervised Y.W. N.G.W. initiated the single molecule experiments, advised S.P. in their execution, provided critical input in experimental design and result interpretation, and edited the manuscript. F.M. designed and performed all the remaining experiments and wrote the manuscript. F.d’A.d.F. conceived the study and, together with F.M., assembled and revised the manuscript. All authors commented on the manuscript.
References
- 1.Polo SE, Jackson SP. Dynamics of DNA damage response proteins at DNA breaks: a focus on protein modifications. Genes Dev. 2011;25:409–433. doi: 10.1101/gad.2021311. [DOI] [PMC free article] [PubMed] [Google Scholar]
- 2.Sharma V, Misteli T. Non-coding RNAs in DNA damage and repair. FEBS Lett. 2013;587:1832–1839. doi: 10.1016/j.febslet.2013.05.006. [DOI] [PMC free article] [PubMed] [Google Scholar]
- 3.Derr LK, Strathern JN. A role for reverse transcripts in gene conversion. Nature. 1993;361:170–173. doi: 10.1038/361170a0. [DOI] [PubMed] [Google Scholar]
- 4.Storici F, Bebenek K, Kunkel TA, Gordenin DA, Resnick MA. RNA-templated DNA repair. Nature. 2007;447:338–341. doi: 10.1038/nature05720. [DOI] [PMC free article] [PubMed] [Google Scholar]
- 5.Keskin H, et al. Transcript-RNA-templated DNA recombination and repair. Nature. 2014;515:436–439. doi: 10.1038/nature13682. [DOI] [PMC free article] [PubMed] [Google Scholar]
- 6.Wei W, et al. A role for small RNAs in DNA double-strand break repair. Cell. 2012;149:101–112. doi: 10.1016/j.cell.2012.03.002. [DOI] [PubMed] [Google Scholar]
- 7.Wang Q, Goldstein M. Small RNAs Recruit Chromatin-Modifying Enzymes MMSET and Tip60 to Reconfigure Damaged DNA upon Double-Strand Break and Facilitate Repair. Cancer Res. 2016;76:1904–1915. doi: 10.1158/0008-5472.CAN-15-2334. [DOI] [PubMed] [Google Scholar]
- 8.Gao M, et al. Ago2 facilitates Rad51 recruitment and DNA double-strand break repair by homologous recombination. Cell Res. 2014;24:532–541. doi: 10.1038/cr.2014.36. [DOI] [PMC free article] [PubMed] [Google Scholar]
- 9.Qi Y, Zhang Y, Baller JA, Voytas DF. Histone H2AX and the small RNA pathway modulate both non-homologous end-joining and homologous recombination in plants. Mutat Res. 2016;783:9–14. doi: 10.1016/j.mrfmmm.2015.12.002. [DOI] [PubMed] [Google Scholar]
- 10.Yang YG, Qi Y. RNA-directed repair of DNA double-strand breaks. DNA Repair (Amst) 2015;32:82–85. doi: 10.1016/j.dnarep.2015.04.017. [DOI] [PubMed] [Google Scholar]
- 11.Ohle C, et al. Transient RNA-DNA Hybrids Are Required for Efficient Double-Strand Break Repair. Cell. 2016;167:1001–1013e1007. doi: 10.1016/j.cell.2016.10.001. [DOI] [PubMed] [Google Scholar]
- 12.Chakraborty A, et al. Classical non-homologous end-joining pathway utilizes nascent RNA for error-free double-strand break repair of transcribed genes. Nature communications. 2016;7:13049. doi: 10.1038/ncomms13049. [DOI] [PMC free article] [PubMed] [Google Scholar]
- 13.Mochizuki K, Fine NA, Fujisawa T, Gorovsky MA. Analysis of a piwi-related gene implicates small RNAs in genome rearrangement in tetrahymena. Cell. 2002;110:689–699. doi: 10.1016/s0092-8674(02)00909-1. [DOI] [PubMed] [Google Scholar]
- 14.Schmidts I, Bottcher R, Mirkovic-Hosle M, Forstemann K. Homology directed repair is unaffected by the absence of siRNAs in Drosophila melanogaster. Nucleic Acids Res. 2016;44:8261–8271. doi: 10.1093/nar/gkw570. [DOI] [PMC free article] [PubMed] [Google Scholar]
- 15.Miki D, et al. Efficient Generation of diRNAs Requires Components in the Posttranscriptional Gene Silencing Pathway. Sci Rep. 2017;7:301. doi: 10.1038/s41598-017-00374-7. [DOI] [PMC free article] [PubMed] [Google Scholar]
- 16.Francia S, et al. Site-specific DICER and DROSHA RNA products control the DNA-damage response. Nature. 2012;488:231–235. doi: 10.1038/nature11179. [DOI] [PMC free article] [PubMed] [Google Scholar]
- 17.Francia S, Cabrini M, Matti V, Oldani A, d'Adda di Fagagna F. DICER, DROSHA and DNA damage response RNAs are necessary for the secondary recruitment of DNA damage response factors. J Cell Sci. 2016;129:1468–1476. doi: 10.1242/jcs.182188. [DOI] [PMC free article] [PubMed] [Google Scholar]
- 18.Rossiello F, et al. DNA damage response inhibition at dysfunctional telomeres by modulation of telomeric DNA damage response RNAs. Nat Commun. 2017;8:13980. doi: 10.1038/ncomms13980. [DOI] [PMC free article] [PubMed] [Google Scholar]
- 19.Michalik KM, Bottcher R, Forstemann K. A small RNA response at DNA ends in Drosophila. Nucleic Acids Res. 2012;40:9596–9603. doi: 10.1093/nar/gks711. [DOI] [PMC free article] [PubMed] [Google Scholar]
- 20.Soutoglou E, et al. Positional stability of single double-strand breaks in mammalian cells. Nat Cell Biol. 2007;9:675–682. doi: 10.1038/ncb1591. [DOI] [PMC free article] [PubMed] [Google Scholar]
- 21.Pitchiaya S, Androsavich JR, Walter NG. Intracellular single molecule microscopy reveals two kinetically distinct pathways for microRNA assembly. EMBO Rep. 2012;13:709–715. doi: 10.1038/embor.2012.85. [DOI] [PMC free article] [PubMed] [Google Scholar]
- 22.Pitchiaya S, Krishnan V, Custer TC, Walter NG. Dissecting non-coding RNA mechanisms in cellulo by Single-molecule High-Resolution Localization and Counting. Methods. 2013;63:188–199. doi: 10.1016/j.ymeth.2013.05.028. [DOI] [PMC free article] [PubMed] [Google Scholar]
- 23.Pitchiaya S, Heinicke LA, Park JI, Cameron EL, Walter NG. Resolving Subcellular miRNA Trafficking and Turnover at Single-Molecule Resolution. Cell Rep. 2017;19:630–642. doi: 10.1016/j.celrep.2017.03.075. [DOI] [PMC free article] [PubMed] [Google Scholar]
- 24.Bensaude O. Inhibiting eukaryotic transcription: Which compound to choose? How to evaluate its activity? Transcription. 2011;2:103–108. doi: 10.4161/trns.2.3.16172. [DOI] [PMC free article] [PubMed] [Google Scholar]
- 25.Raj A, van den Bogaard P, Rifkin SA, van Oudenaarden A, Tyagi S. Imaging individual mRNA molecules using multiple singly labeled probes. Nat Methods. 2008;5:877–879. doi: 10.1038/nmeth.1253. [DOI] [PMC free article] [PubMed] [Google Scholar]
- 26.Lemaitre C, et al. The nucleoporin 153, a novel factor in double-strand break repair and DNA damage response. Oncogene. 2012;31:4803–4809. doi: 10.1038/onc.2011.638. [DOI] [PubMed] [Google Scholar]
- 27.Lemaitre C, et al. Nuclear position dictates DNA repair pathway choice. Genes Dev. 2014;28:2450–2463. doi: 10.1101/gad.248369.114. [DOI] [PMC free article] [PubMed] [Google Scholar]
- 28.Roukos V, et al. Spatial dynamics of chromosome translocations in living cells. Science. 2013;341:660–664. doi: 10.1126/science.1237150. [DOI] [PMC free article] [PubMed] [Google Scholar]
- 29.Pankotai T, Bonhomme C, Chen D, Soutoglou E. DNAPKcs-dependent arrest of RNA polymerase II transcription in the presence of DNA breaks. Nat Struct Mol Biol. 2012;19:276–282. doi: 10.1038/nsmb.2224. [DOI] [PubMed] [Google Scholar]
- 30.Iacovoni JS, et al. High-resolution profiling of gammaH2AX around DNA double strand breaks in the mammalian genome. Embo J. 2010;29:1446–1457. doi: 10.1038/emboj.2010.38. [DOI] [PMC free article] [PubMed] [Google Scholar]
- 31.Asada K, et al. Rescuing dicer defects via inhibition of an anti-dicing nuclease. Cell Rep. 2014;9:1471–1481. doi: 10.1016/j.celrep.2014.10.021. [DOI] [PMC free article] [PubMed] [Google Scholar]
- 32.Feuerhahn S, Iglesias N, Panza A, Porro A, Lingner J. TERRA biogenesis, turnover and implications for function. FEBS Lett. 2010;584:3812–3818. doi: 10.1016/j.febslet.2010.07.032. [DOI] [PubMed] [Google Scholar]
- 33.Wang Y, Maharana S, Wang MD, Shivashankar GV. Super-resolution microscopy reveals decondensed chromatin structure at transcription sites. Sci Rep. 2014;4:4477. doi: 10.1038/srep04477. [DOI] [PMC free article] [PubMed] [Google Scholar]
- 34.Dupre A, et al. A forward chemical genetic screen reveals an inhibitor of the Mre11-Rad50-Nbs1 complex. Nature chemical biology. 2008;4:119–125. doi: 10.1038/nchembio.63. [DOI] [PMC free article] [PubMed] [Google Scholar]
- 35.Kumar R, Cheok CF. RIF1: a novel regulatory factor for DNA replication and DNA damage response signaling. DNA Repair (Amst) 2014;15:54–59. doi: 10.1016/j.dnarep.2013.12.004. [DOI] [PubMed] [Google Scholar]
- 36.Goodarzi AA, Jeggo PA. The heterochromatic barrier to DNA double strand break repair: how to get the entry visa. Int J Mol Sci. 2012;13:11844–11860. doi: 10.3390/ijms130911844. [DOI] [PMC free article] [PubMed] [Google Scholar]
- 37.Smeenk G, Mailand N. Writers, Readers, and Erasers of Histone Ubiquitylation in DNA Double-Strand Break Repair. Front Genet. 2016;7:122. doi: 10.3389/fgene.2016.00122. [DOI] [PMC free article] [PubMed] [Google Scholar]
- 38.Pryde F, et al. 53BP1 exchanges slowly at the sites of DNA damage and appears to require RNA for its association with chromatin. J Cell Sci. 2005;118:2043–2055. doi: 10.1242/jcs.02336. [DOI] [PubMed] [Google Scholar]
- 39.Fradet-Turcotte A, et al. 53BP1 is a reader of the DNA-damage-induced H2A Lys 15 ubiquitin mark. Nature. 2013;499:50–54. doi: 10.1038/nature12318. [DOI] [PMC free article] [PubMed] [Google Scholar]
- 40.Burger K, et al. Nuclear phosphorylated Dicer processes double-stranded RNA in response to DNA damage. J Cell Biol. 2017;216:2373–2389. doi: 10.1083/jcb.201612131. [DOI] [PMC free article] [PubMed] [Google Scholar]
- 41.Holoch D, Moazed D. RNA-mediated epigenetic regulation of gene expression. Nature reviews. Genetics. 2015;16:71–84. doi: 10.1038/nrg3863. [DOI] [PMC free article] [PubMed] [Google Scholar]
- 42.Guil S, Esteller M. RNA-RNA interactions in gene regulation: the coding and noncoding players. Trends in biochemical sciences. 2015;40:248–256. doi: 10.1016/j.tibs.2015.03.001. [DOI] [PubMed] [Google Scholar]
- 43.Vitelli V, et al. Recent Advancements in DNA Damage,ÄìTranscription Crosstalk and High-Resolution Mapping of DNA Breaks. Annual Review of Genomics and Human Genetics. 2017;18:87–113. doi: 10.1146/annurev-genom-091416-035314. [DOI] [PubMed] [Google Scholar]
- 44.Proudfoot NJ. Transcriptional termination in mammals: Stopping the RNA polymerase II juggernaut. Science. 2016;352:aad9926. doi: 10.1126/science.aad9926. [DOI] [PMC free article] [PubMed] [Google Scholar]
- 45.Skourti-Stathaki K, Kamieniarz-Gdula K, Proudfoot NJ. R-loops induce repressive chromatin marks over mammalian gene terminators. Nature. 2014;516:436–439. doi: 10.1038/nature13787. [DOI] [PMC free article] [PubMed] [Google Scholar]
- 46.Capozzo I, Iannelli F, Francia S, d'Adda di Fagagna F. Express or repress? The transcriptional dilemma of damaged chromatin. Febs J. 2017 doi: 10.1111/febs.14048. [DOI] [PubMed] [Google Scholar]
- 47.Iannelli F, et al. A damaged genome's transcriptional landscape through multilayered expression profiling around in situ-mapped DNA double-strand breaks. Nature communications. 2017;8:15656. doi: 10.1038/ncomms15656. [DOI] [PMC free article] [PubMed] [Google Scholar]
- 48.Britton S, et al. DNA damage triggers SAF-A and RNA biogenesis factors exclusion from chromatin coupled to R-loops removal. Nucleic Acids Res. 2014;42:9047–9062. doi: 10.1093/nar/gku601. [DOI] [PMC free article] [PubMed] [Google Scholar]
- 49.Boeing S, et al. Multiomic Analysis of the UV-Induced DNA Damage Response. Cell Rep. 2016 doi: 10.1016/j.celrep.2016.04.047. [DOI] [PMC free article] [PubMed] [Google Scholar]
- 50.Kakarougkas A, et al. Requirement for PBAF in transcriptional repression and repair at DNA breaks in actively transcribed regions of chromatin. Mol Cell. 2014;55:723–732. doi: 10.1016/j.molcel.2014.06.028. [DOI] [PMC free article] [PubMed] [Google Scholar]
- 51.Nojima T, Gomes T, Carmo-Fonseca M, Proudfoot NJ. Mammalian NET-seq analysis defines nascent RNA profiles and associated RNA processing genome-wide. Nature protocols. 2016;11:413–428. doi: 10.1038/nprot.2016.012. [DOI] [PMC free article] [PubMed] [Google Scholar]
- 52.Cawthon RM. Telomere measurement by quantitative PCR. Nucleic Acids Res. 2002;30:e47. doi: 10.1093/nar/30.10.e47. [DOI] [PMC free article] [PubMed] [Google Scholar]
- 53.Berkovich E, Monnat RJ, Jr, Kastan MB. Roles of ATM and NBS1 in chromatin structure modulation and DNA double-strand break repair. Nat Cell Biol. 2007;9:683–690. doi: 10.1038/ncb1599. [DOI] [PubMed] [Google Scholar]
- 54.Dignam JD, Lebovitz RM, Roeder RG. Accurate transcription initiation by RNA polymerase II in a soluble extract from isolated mammalian nuclei. Nucleic Acids Res. 1983;11:1475–1489. doi: 10.1093/nar/11.5.1475. [DOI] [PMC free article] [PubMed] [Google Scholar]
- 55.Langmead B, Salzberg SL. Fast gapped-read alignment with Bowtie 2. Nat Methods. 2012;9:357–359. doi: 10.1038/nmeth.1923. [DOI] [PMC free article] [PubMed] [Google Scholar]
- 56.Li H, et al. The Sequence Alignment/Map format and SAMtools. Bioinformatics. 2009;25:2078–2079. doi: 10.1093/bioinformatics/btp352. [DOI] [PMC free article] [PubMed] [Google Scholar]
Associated Data
This section collects any data citations, data availability statements, or supplementary materials included in this article.
Supplementary Materials
Data Availability Statement
RNA-seq data are deposited in NCBI GEO (Gene Expression Omnibus) under accession number GSE75512. Statistical source data are shown in Supplementary Table 4. All other data supporting the findings of this study are available from the corresponding author on reasonable request.