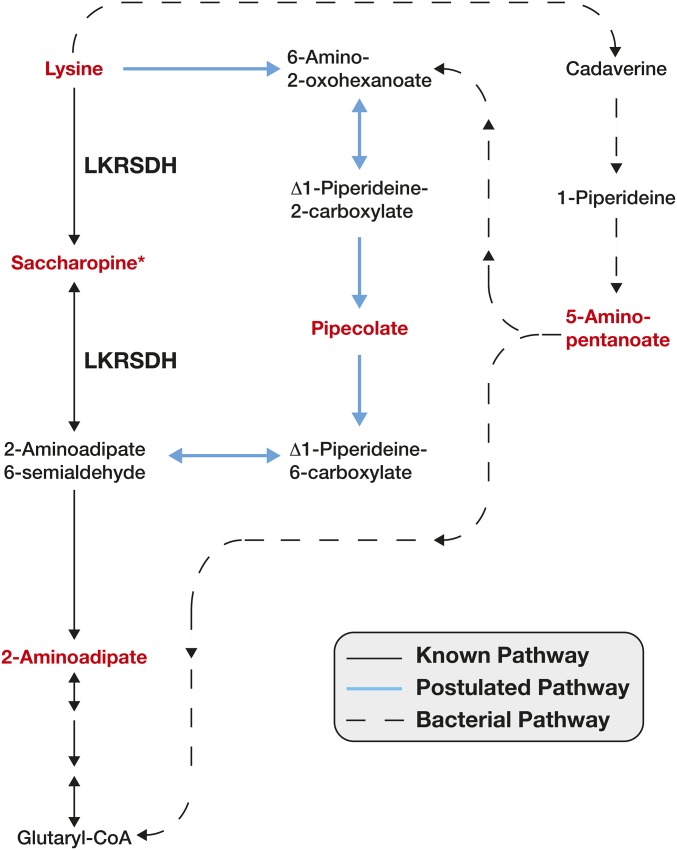
Figure 5.
A schematic diagram illustrating the metabolic pathways that catabolize lysine. Metabolites highlighted in red text were measured using a targeted metabolomics approach. Solid black arrows represent the LKRSDH-dependent pathway. Blue solid arrows indicate the postulated pipecolic acid pathway. Dashed arrows indicate those metabolic reactions are catalyzed by bacterial enzymes. *, saccharopine was undetectable in both control and mutant samples.

